
(This is an excerpt from today's member only DecisionPoint Alert on DecisionPoint.com)
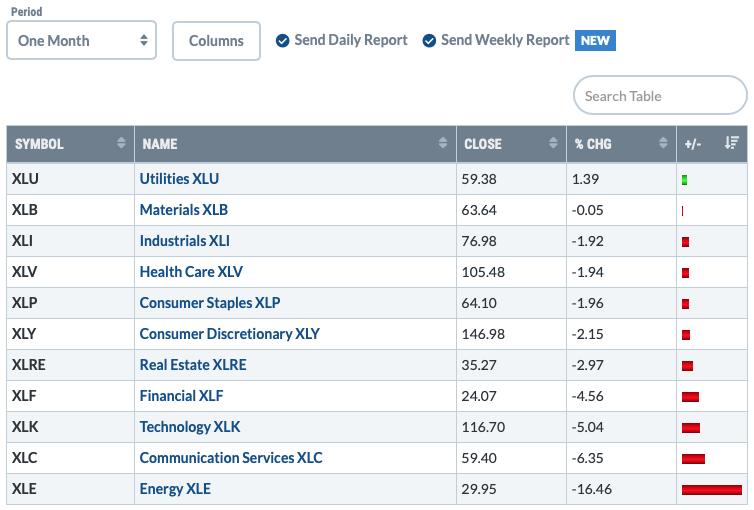
The Utilities SPDR (XLU) is the only sector that is up over the past month. Yes! It surprised me too, but you can see the graphic below! Yet today, we have an IT Trend Model Neutral signal given the 20-EMA had crossed below the 50-EMA while the 50-EMA was above the 200-EMA (had it been below the 200-EMA it would've been a SELL signal). Ah! But we also had a new LONG-term Trend Model BUY signal trigger today as the 50-EMA crossed above the 200-EMA. Mixed messages? I don't think so when you look at the sector chart.


Don't miss the October 5th free DP Trading Room! I will have guest Julius de Kempenaer from RRG Research. He will show us how he uses RRGs to trade!
***Click here to register for this recurring free DecisionPoint Trading Room!***
Did you miss the 9/28 trading room? Here is a link to the recording (password: FT&&l3#K). For best results, copy and paste the password to avoid typos.
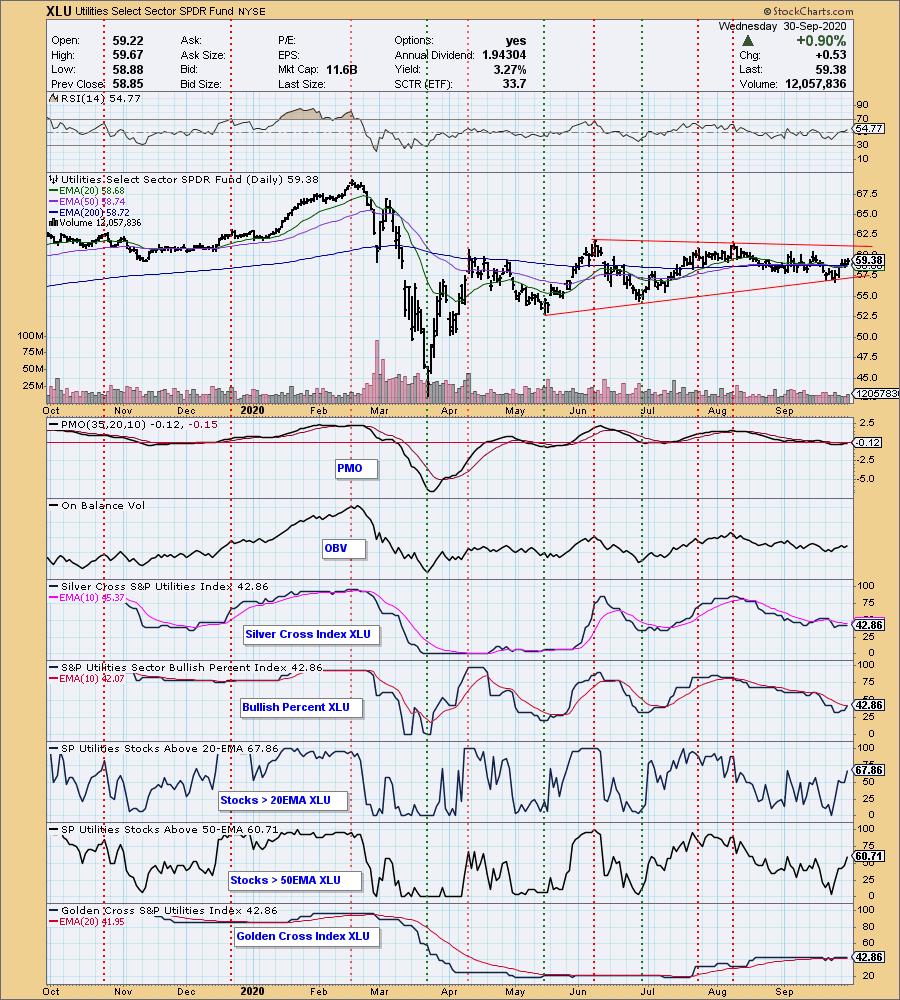
Looking at the DecisionPoint indicators on the XLU chart, it doesn't look that terrible. Part of the problem is that price action has been mostly sideways, traveling toward the apex of a symmetrical triangle. This has brought the EMAs close enough together that they are "braiding" and triggering Trend Model crossover signals.
When you dig down into those indicators you can see a now positive RSI, a positive crossover of the BPI, a PMO crossover BUY signal and plenty of support from component stocks with 67% having price above the 20-EMA and 61% having price above the 50-EMA. The Silver Cross Index (SCI) is in near-term oversold territory and we are seeing a slight rise in the Golden Cross Index (GCI).
Conclusion: I'm not a huge fan of the Utilities sector for investing right now, I'd like to see the IT Trend Model move to a BUY. Sideways price action isn't particularly profitable. The indicators do leave me bullish on this sector, but I do worry that they are near-term overbought. In my DP Diamonds Reports I haven't featured any Utilities as they are mostly absent from my scan results. If you like the sector chart above, then you will love your membership to DecisionPoint.com where you can access the DP Sector ChartList of all of the sectors with the same in-depth indicators that reveal the true story behind the price action. Come try us out with a free trial! Subscribe to the Bundle package and use coupon code: dptrial.
Happy Charting! - Erin Swenlin
Technical Analysis is a windsock, not a crystal ball.
As investors we want to accomplish two basic things: (1) Determine the trend and condition of the market, and (2) select stocks that will ride that tide. The DecisionPoint Alert helps with the first step, and DecisionPoint Diamonds helps with the second. Go to DecisionPoint.com and SUBSCRIBE TODAY! (Charter Subscriber Discounts Available!
Helpful DecisionPoint Links:
DecisionPoint Alert Chart List
DecisionPoint Golden Cross/Silver Cross Index Chart List
DecisionPoint Sector Chart List
Price Momentum Oscillator (PMO)
Swenlin Trading Oscillators (STO-B and STO-V)