
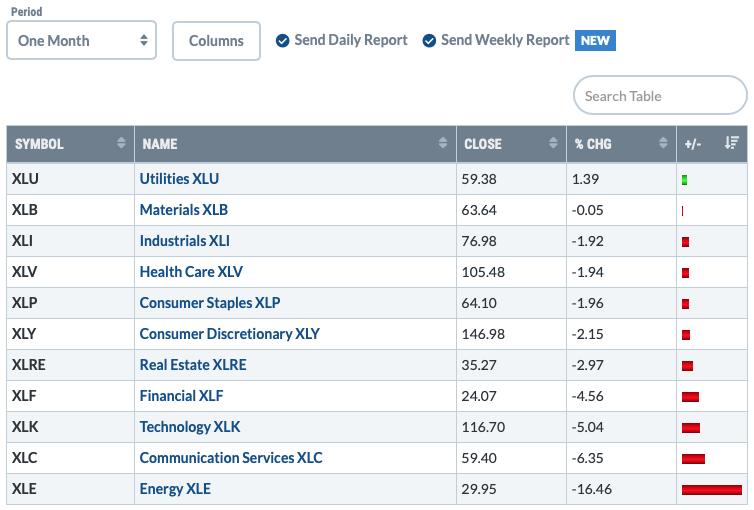
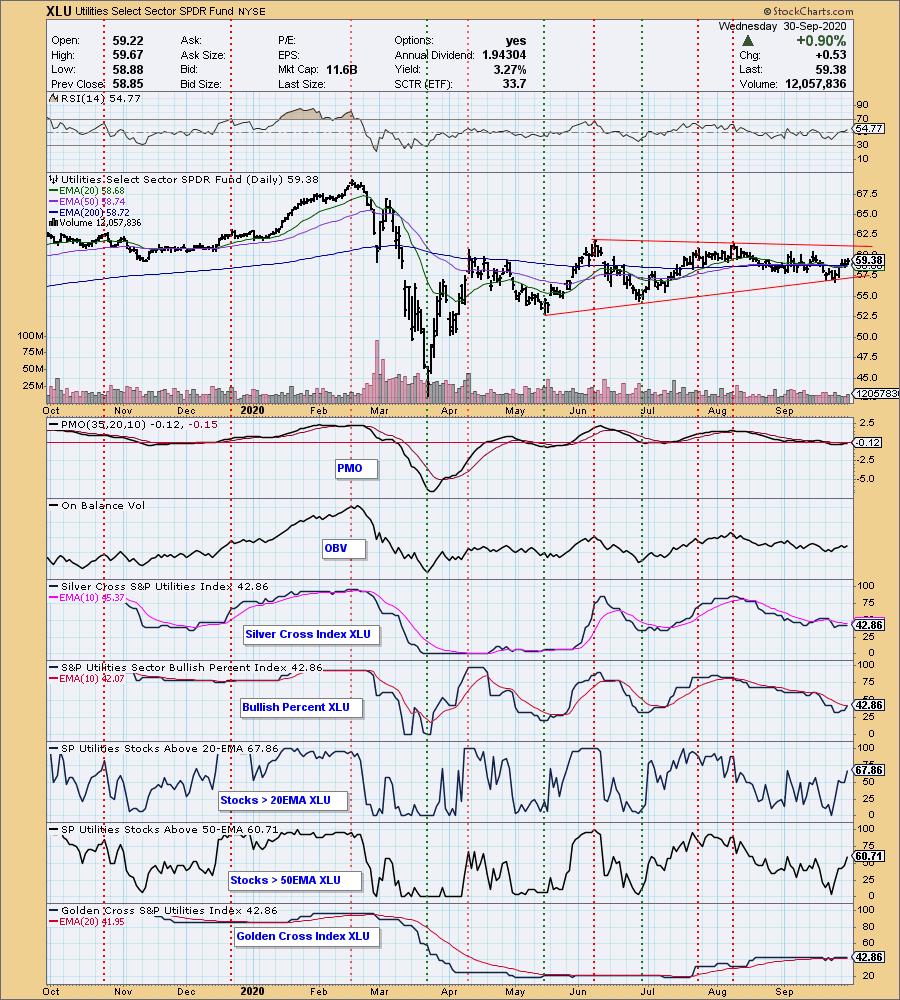
The Utilities SPDR (XLU) is the only sector that is up over the past month. Yes! It surprised me too, but you can see the graphic below! Yet today, we have an IT Trend Model Neutral signal given the 20-EMA had crossed below the 50-EMA while the 50-EMA was above the 200-EMA (had it been below the 200-EMA it would've been a SELL signal). Ah! But we also had a new LONG-term Trend Model BUY signal trigger today as the 50-EMA crossed above the 200-EMA. Mixed messages? I don't think so when you look at the sector chart.
Looking at the DecisionPoint indicators on the XLU chart, it doesn't look that terrible. Part of the problem is that price action has been mostly sideways, traveling toward the apex of a symmetrical triangle. This has brought the EMAs close enough together that they are "braiding" and triggering Trend Model crossover signals. When you dig down into those indicators you can see a now positive RSI, a positive crossover of the BPI, a PMO crossover BUY signal and plenty of support from component stocks with 67% having price above the 20-EMA and 61% having price above the 50-EMA. The Silver Cross Index (SCI) is in near-term oversold territory and we are seeing a slight rise in the Golden Cross Index (GCI).
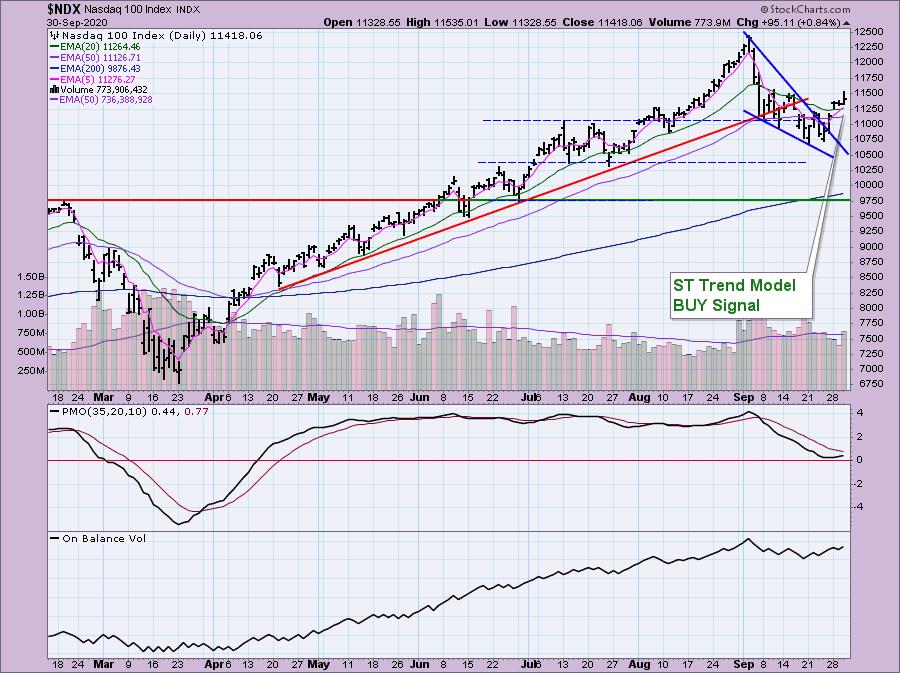
A quick FYI, the NDX triggered a ST Trend Model BUY signal as the 5-EMA crossed above the 20-EMA.


Don't miss the October 5th free DP Trading Room! I will have guest Julius de Kempenaer from RRG Research. He will show us how he uses RRG to trade!
***Click here to register for this recurring free DecisionPoint Trading Room!***
Did you miss the 9/28 trading room? Here is a link to the recording (password: FT&&l3#K). For best results, copy and paste the password to avoid typos.
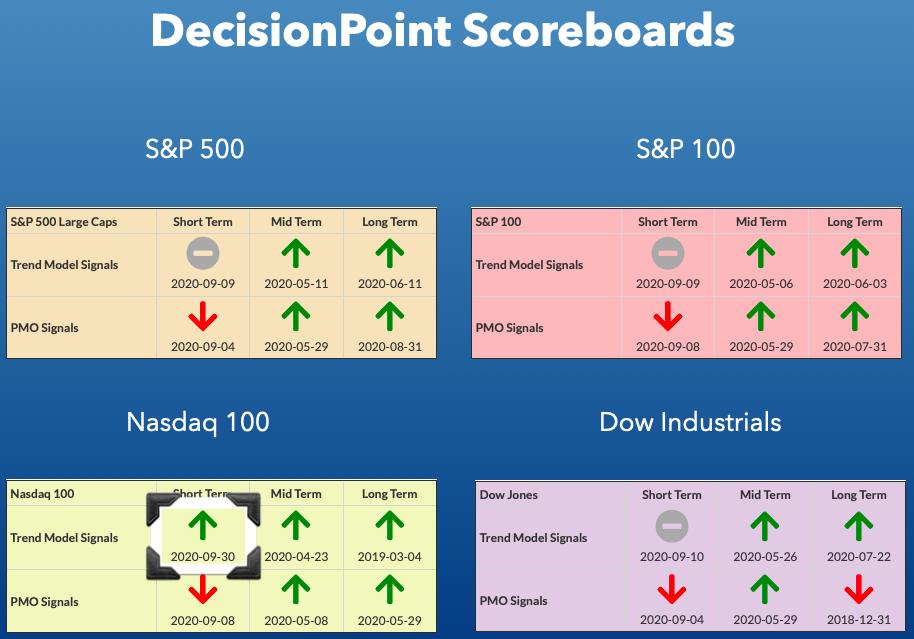
DP INDEX SCOREBOARDS:
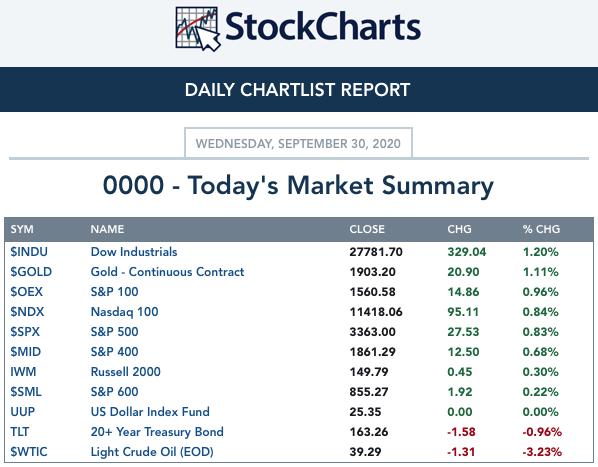
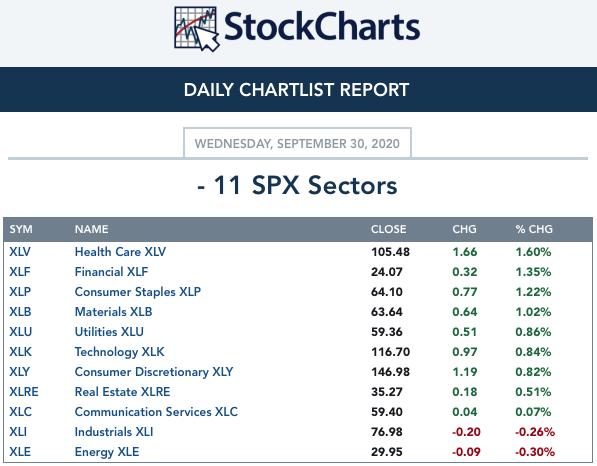
TODAY'S Broad Market Action:
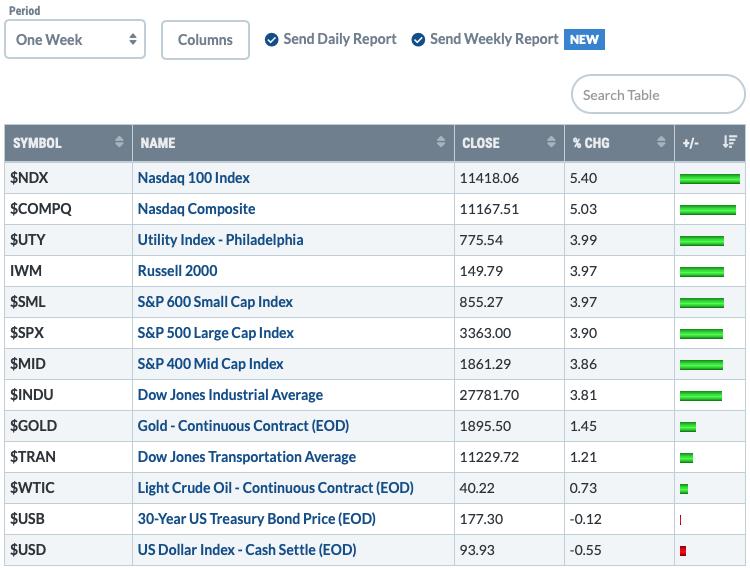
One WEEK Results:
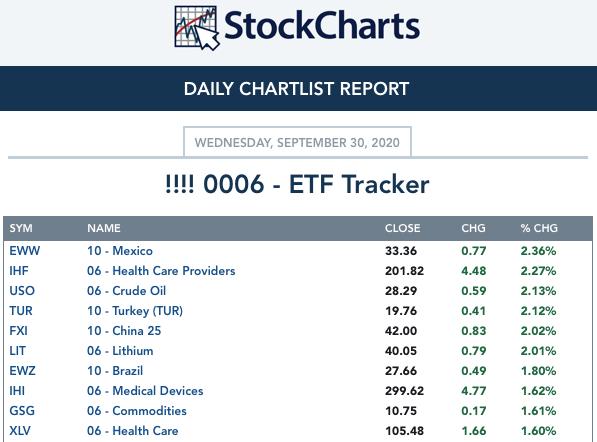
Top 10 from ETF Tracker:
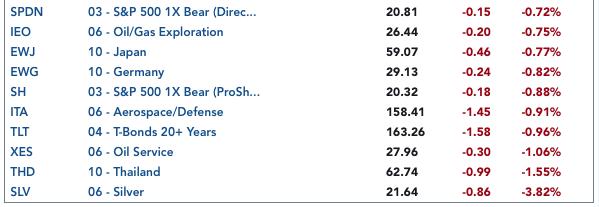
Bottom 10 from ETF Tracker:
On Friday, the DecisionPoint Alert Weekly Wrap presents an assessment of the trend and condition of the stock market (S&P 500), the U.S. Dollar, Gold, Crude Oil, and Bonds. Monday through Thursday the DecisionPoint Alert daily report is abbreviated and covers changes for the day.
Watch the latest episode of DecisionPoint on StockCharts TV's YouTube channel here!
SECTORS
SIGNALS:
Each S&P 500 Index component stock is assigned to one, and only one, of 11 major sectors. This is a snapshot of the Intermediate-Term (Silver Cross) and Long-Term (Golden Cross) Trend Model signal status for those sectors.
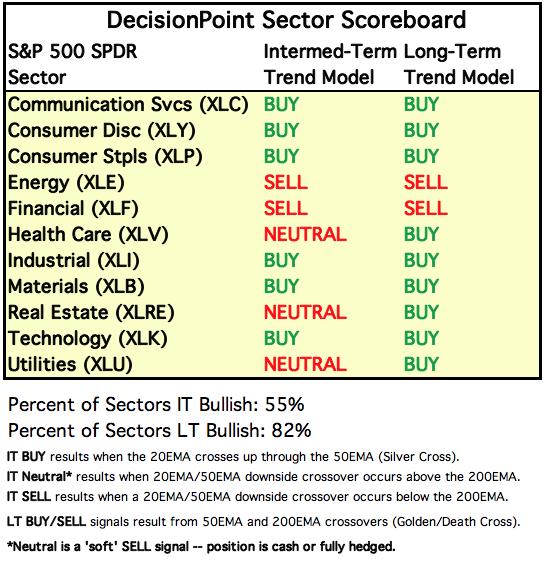
TODAY'S RESULTS:
One WEEK Results: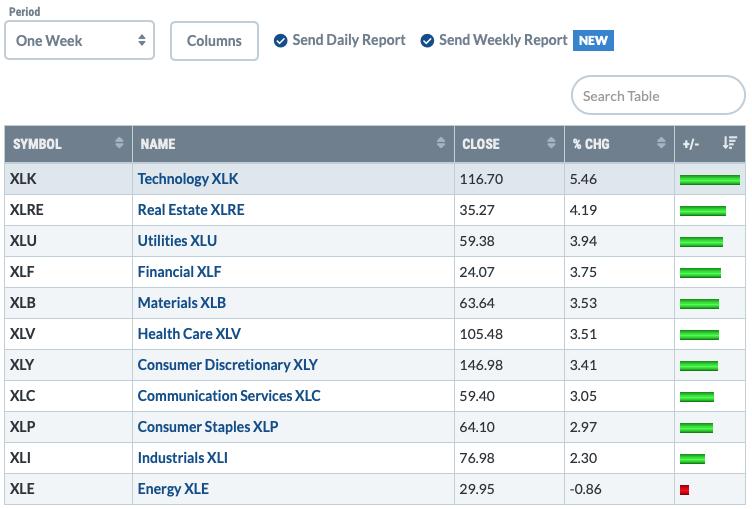
STOCKS
IT Trend Model: BUY as of 5/8/2020
LT Trend Model: BUY as of 6/8/2020
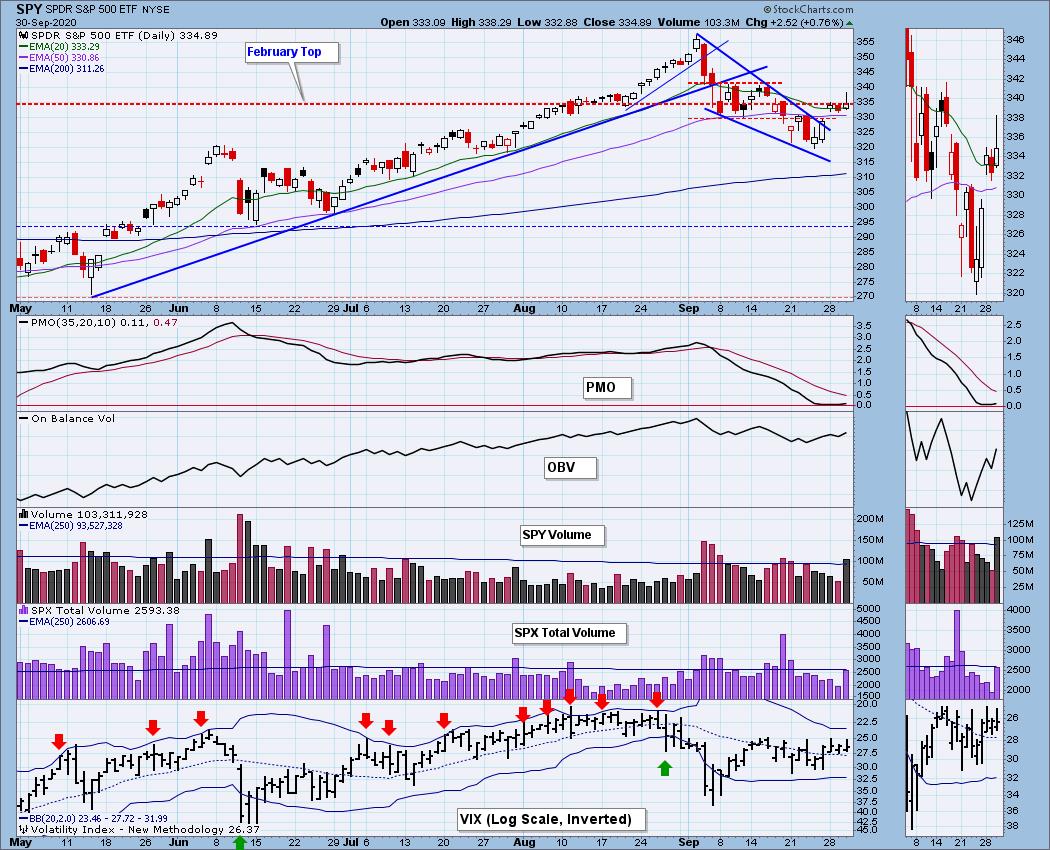
SPY Daily Chart: We've now added yet another negative candlestick to the 5-month SPY daily chart. This looks like a shooting star which is bearish for the following day. The market hasn't rid itself of the island formation yet. These are also bearish patterns that suggest a gap down reversal soon. The big pop in volume was nice to see on a rally and does suggest conviction in the move. The VIX is now hovering above its EMA on the inverted scale and that is bullish for the market. The PMO is turning up above the zero line which is also bullish.
Climactic Market Indicators: We see somewhat climactic positive readings today and a slight rise in New Highs. The VIX looks like it is getting squeezed again and that generally is a prelude to high volatility generated by selling.
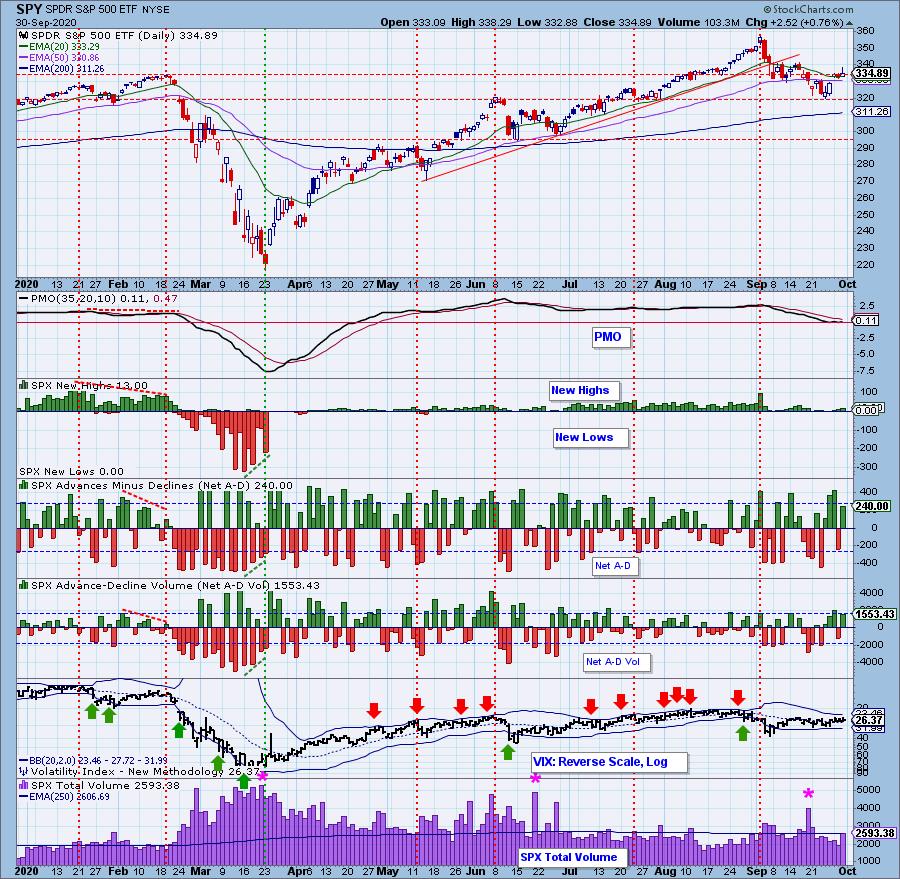
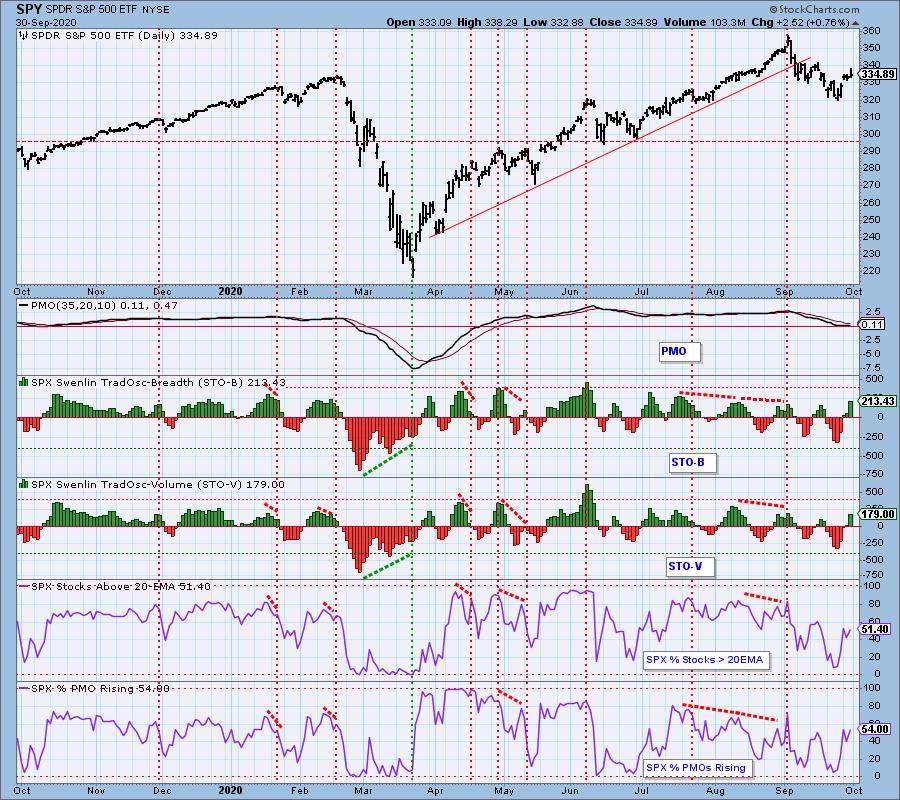
Short-Term Market Indicators: The short-term market trend is DOWN and the condition is OVERBOUGHT. Based upon the STO ranges, market bias is BULLISH.
The pop on the STOs has put them in overbought territory quickly. We didn't get the improvement that I would expect on today's rally as far as %Stocks > 20-EMA and %PMOs Rising.
Intermediate-Term Market Indicators: The following chart uses different methodologies for objectively showing the depth and trend of participation for intermediate- and long-term time frames.
- The Silver Cross Index (SCI) shows the percentage of SPX stocks on IT Trend Model BUY signals (20-EMA > 50-EMA).
- The Golden Cross Index (GCI) shows the percentage of SPX stocks on LT Trend Model BUY signals (50-EMA > 200-EMA).
- The Bullish Percent Index (BPI shows the percentage of SPX stocks on Point & Figure BUY signals.
The BPI had a positive crossover today, but we aren't seeing any improvement on the SCI and GCI.
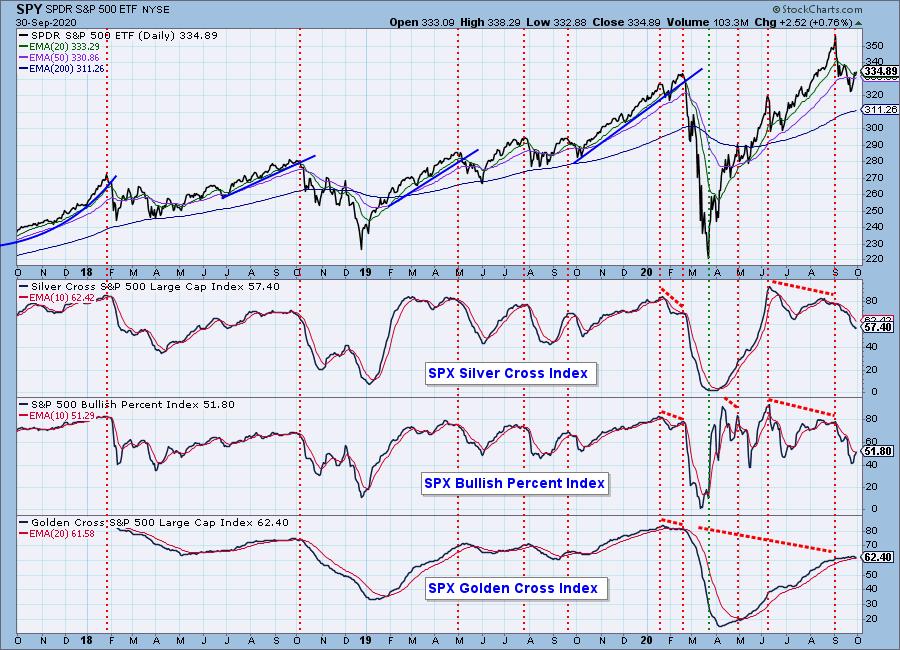
The intermediate-term market trend is DOWN and the condition is NEUTRAL. The market bias is NEUTRAL.
These indicators are rising slightly and we did see a positive crossover of the %PMO BUY signals, but that seems to be arriving right before price declines.
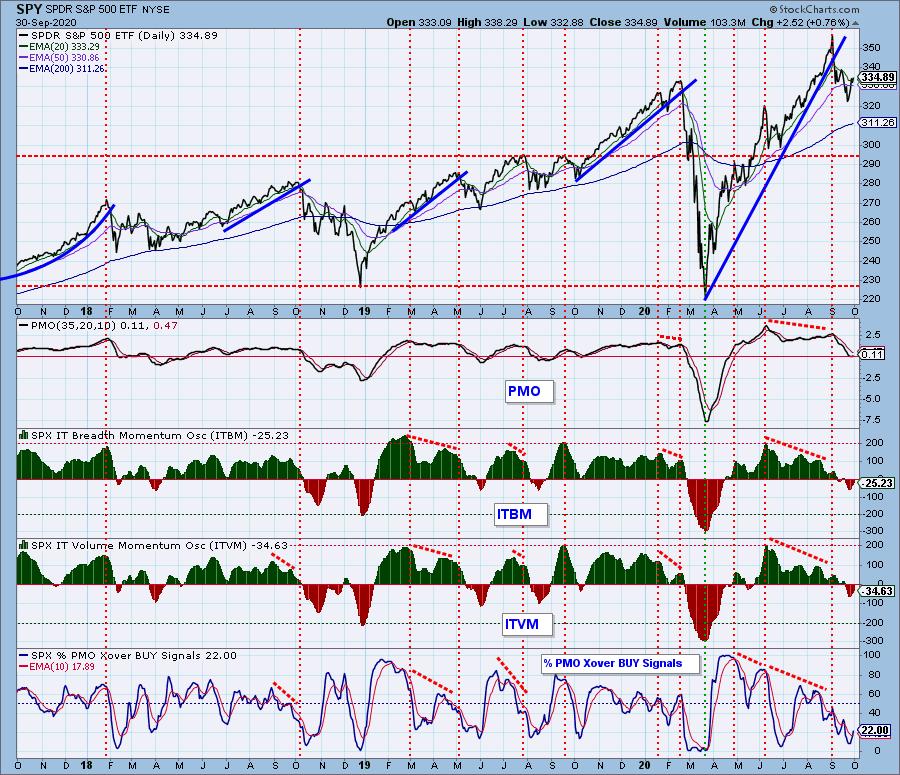
CONCLUSION: Overhead resistance wasn't overcome and we now have a bearish candlestick punctuating an island formation. A breakout here is certainly possible as there are indicators that would support that, unfortunately, we are seeing overbought readings on the ITBM/ITVM as well as in the short term on the STOs. I believe you can make a case for either a breakout or a breakdown right now. I'm leaning bearish right now based on the upside pops on the STOs that have quickly put them into overbought territory.
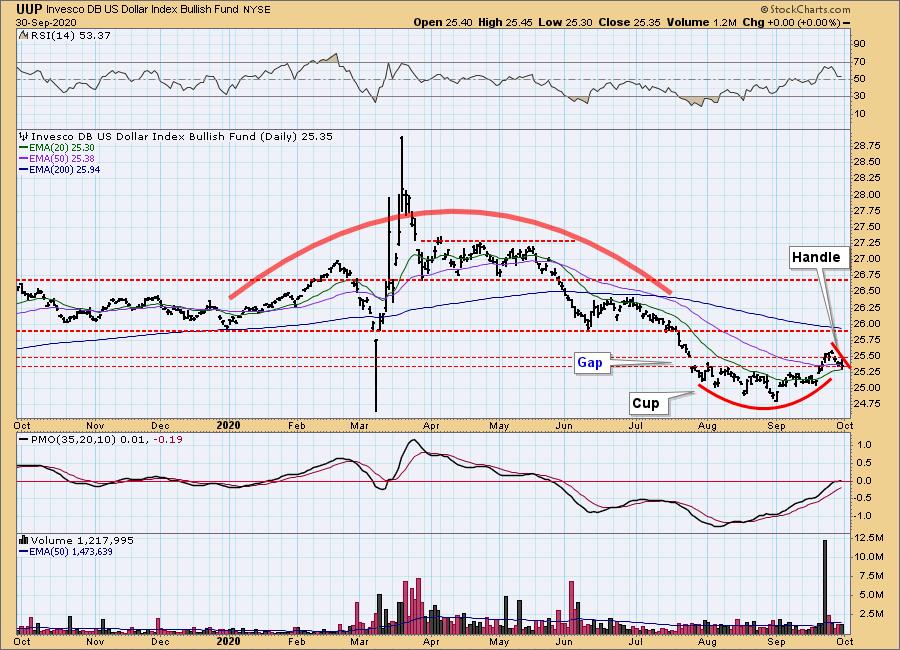
DOLLAR (UUP)
IT Trend Model: NEUTRAL as of 5/28/2020
LT Trend Model: SELL as of 7/10/2020
UUP Daily Chart: Yesterday's comments still apply:
"The gap was covered last week and now we see a pullback. This sure looks like a bullish cup and handle. The PMO is rising nicely and the RSI is positive and not overbought. We could see another day of lower prices, but the cup and handle along with the PMO and RSI tell me to expect higher prices soon."
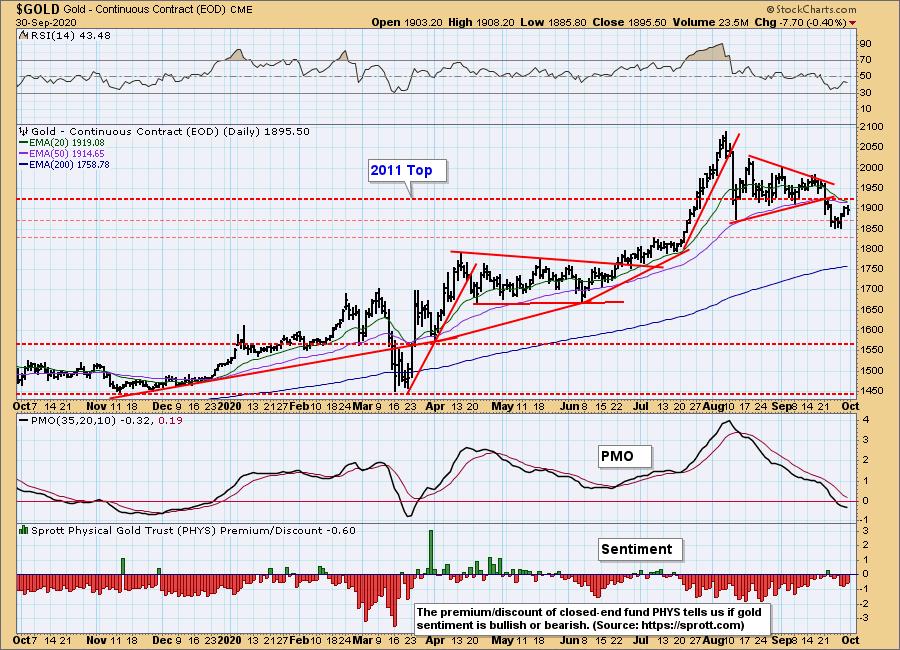
GOLD
IT Trend Model: BUY as of 3/24/2020
LT Trend Model: BUY as of 1/8/2019
GOLD Daily Chart: Gold was lower on the day as it pushes against the 20/50-EMAs and overhead resistance at 1925. The PMO is decelerating right now and there are discounts on PHYS which suggests bearish sentiment. Sentiment being contrarian, that is good for Gold. Gold needs to get back above that 50-EMA or we will see an IT Trend Model Neutral signal generate.
Full Disclosure: I own GLD.
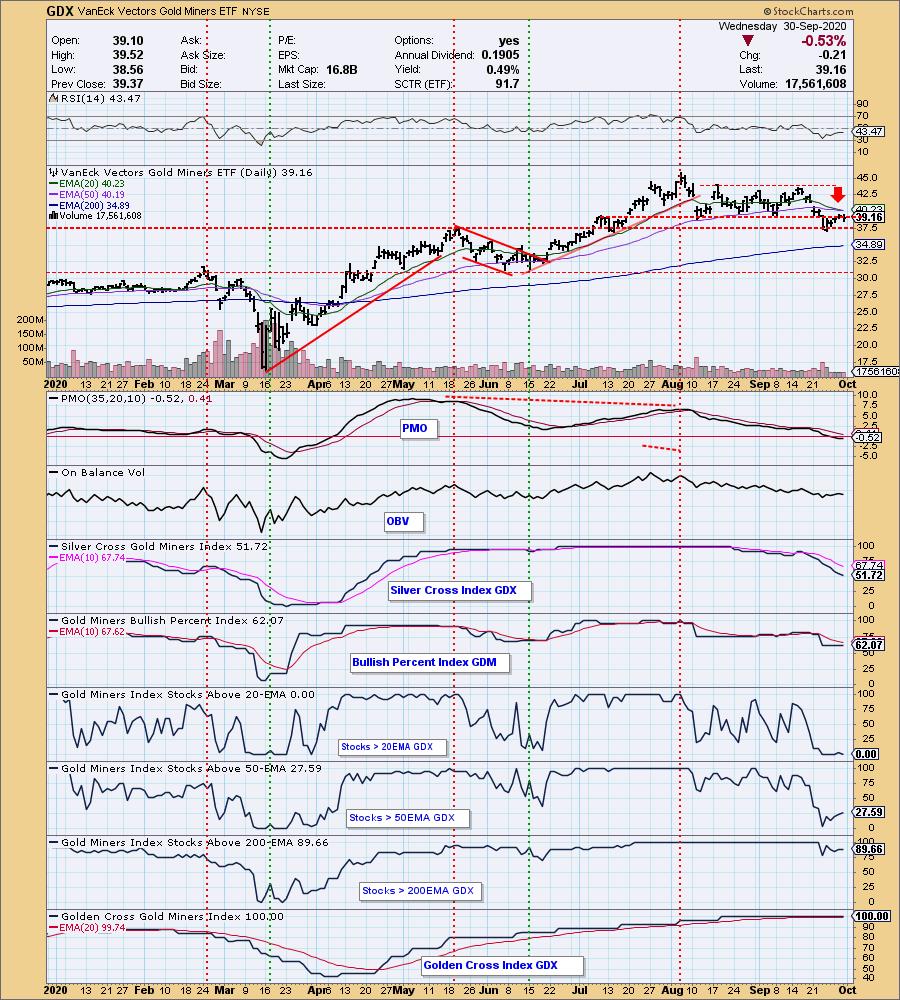
GOLD MINERS Golden and Silver Cross Indexes: Miners took back some profits and we have zero Miners with price above their 20-EMA. That's as oversold as possible but also suggests that Miners have some ground to cover. One big positive is that 100% of components have "golden crosses". We should see an IT Trend Model Neutral signal tomorrow as the 20-EMA is close to a negative crossover the 50-EMA. I don't see a big breakdown ahead, but conversely I don't see a breakout either given the damage that this last pullback had on price > 20-EMA.
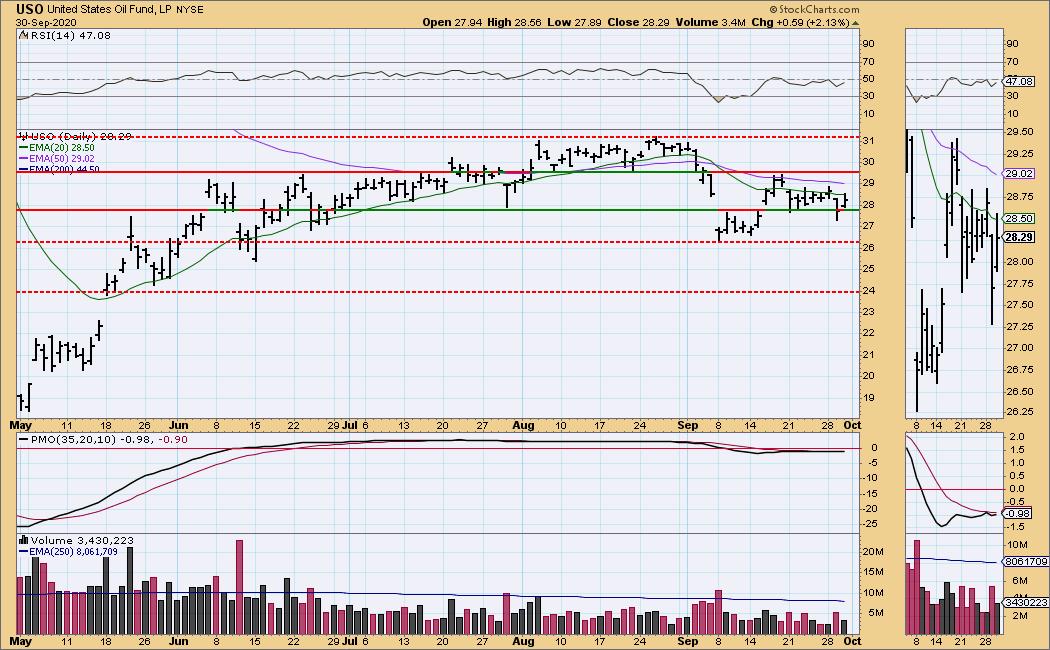
CRUDE OIL (USO)
IT Trend Model: SELL as of 9/8/2020
LT Trend Model: SELL as of 2/3/2020
USO Daily Chart: USO is back in the thin trading range. The RSI remains negative and the PMO has topped below its signal line. I don't see anything ahead but more sideways movement.
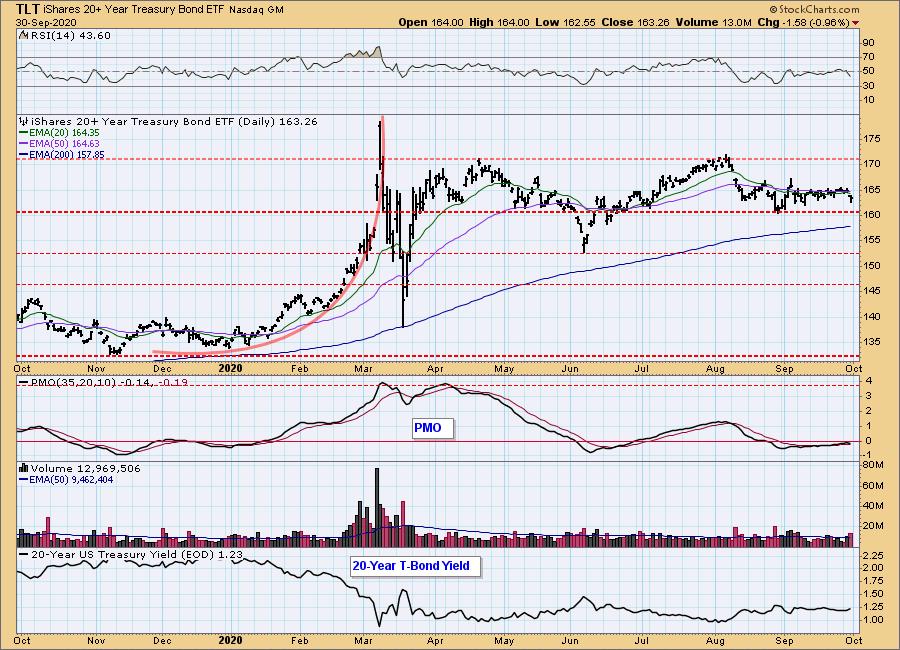
BONDS (TLT)
IT Trend Model: Neutral as of 8/27/2020
LT Trend Model: BUY as of 1/2/2019
TLT Daily Chart: Big drop on Bonds today as yields rose. The very small rising trend was broken and price is now well-below the 20/50-EMAs. The RSI is negative and the PMO topped beneath the zero line. It appears we will see a test of the $160 support level.
Full disclosure: I own TLT.
Have you subscribed the DecisionPoint Diamonds yet? DP does the work for you by providing handpicked stocks/ETFs from exclusive DP scans! Get in on the new "DecisionPoint Diamond Mine" trading room that is part of that subscription! Contact support@decisionpoint.com for more information!
Technical Analysis is a windsock, not a crystal ball.
Happy Charting! - Erin
Email: erin@decisionpoint.com
NOTE: The signal status reported herein is based upon mechanical trading model signals, specifically, the DecisionPoint Trend Model. They define the implied bias of the price index based upon moving average relationships, but they do not necessarily call for a specific action. They are information flags that should prompt chart review. Further, they do not call for continuous buying or selling during the life of the signal. For example, a BUY signal will probably (but not necessarily) return the best results if action is taken soon after the signal is generated. Additional opportunities for buying may be found as price zigzags higher, but the trader must look for optimum entry points. Conversely, exit points to preserve gains (or minimize losses) may be evident before the model mechanically closes the signal.
Helpful DecisionPoint Links (Can Be Found on DecisionPoint.com Links Page):
DecisionPoint Shared ChartList and DecisionPoint Chart Gallery
Price Momentum Oscillator (PMO)