
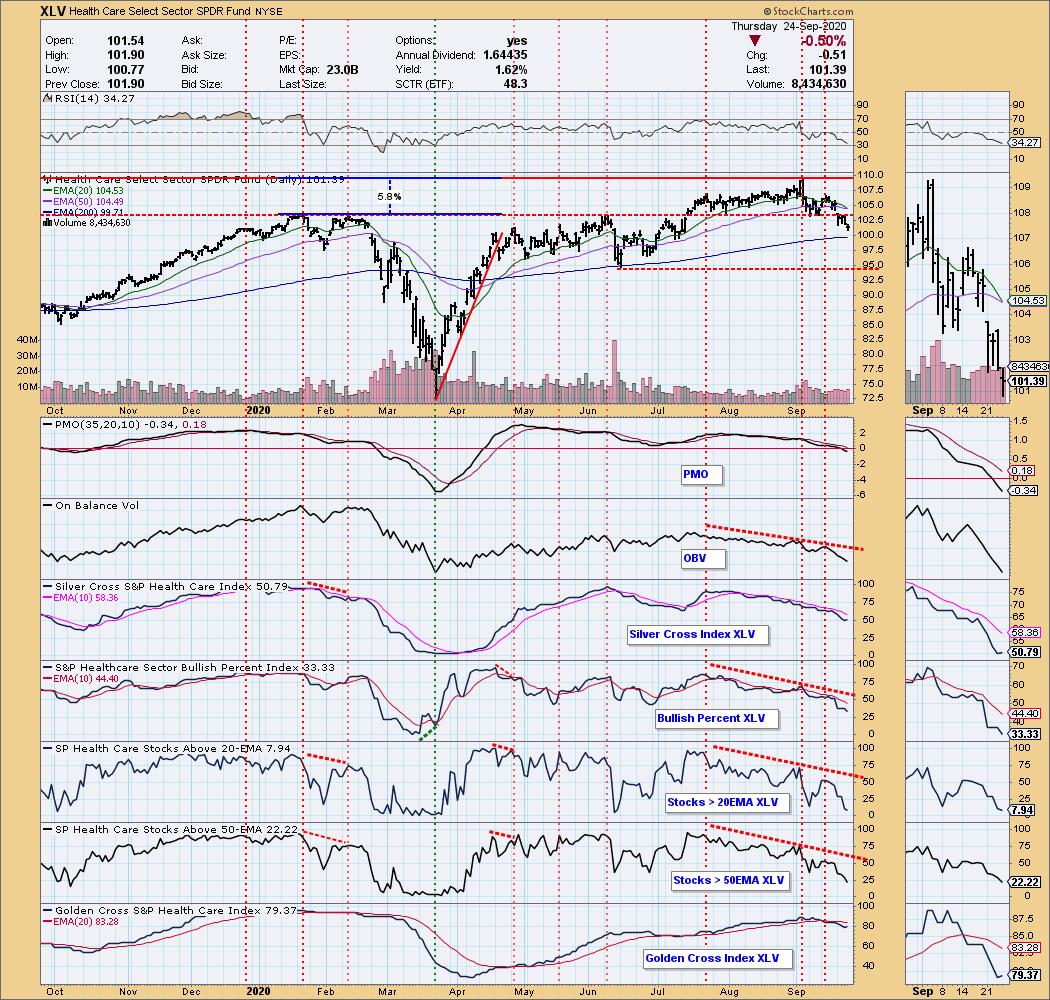
The Health Care Sector (XLV) is about ready to trigger an IT Trend Model Neutral signal. That occurs when the 20-EMA drops below the 50-EMA while the 50-EMA is above the 200-EMA. Health Care certainly is getting plenty of press with the pandemic, but it is being taken down with the rest of the market. While we're seeing some oversold readings on %Stocks above 20/50-EMAs and RSI, the other indicators are barely or somewhat oversold. The drop this week below support was significant on a gap down. It needs to hold support at the 200-EMA. If that is breached, it could mean a price drop to $95. One thing to keep in mind regarding the COVID vaccines and needed medical supplies to administer them, many of the companies are going to manufacture and distribute them at or below cost. It likely won't be a big money maker for these companies.

Click here to register in advance for the recurring free DecisionPoint Trading Room (Next one is 9/28)!
Did you miss the September 21st trading room? Here is a link to the recording (password: 2Ai3a=r4).
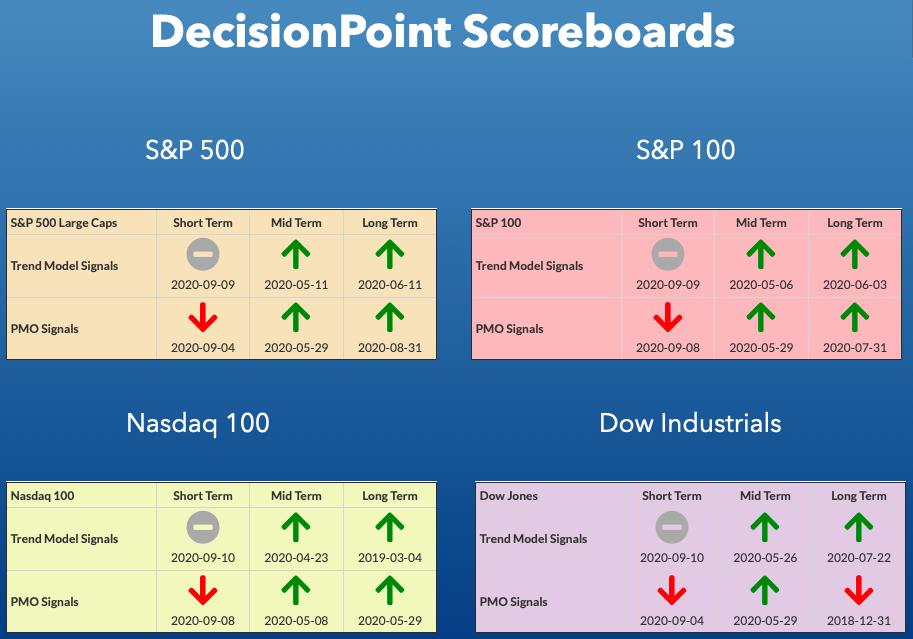
DP INDEX SCOREBOARDS:
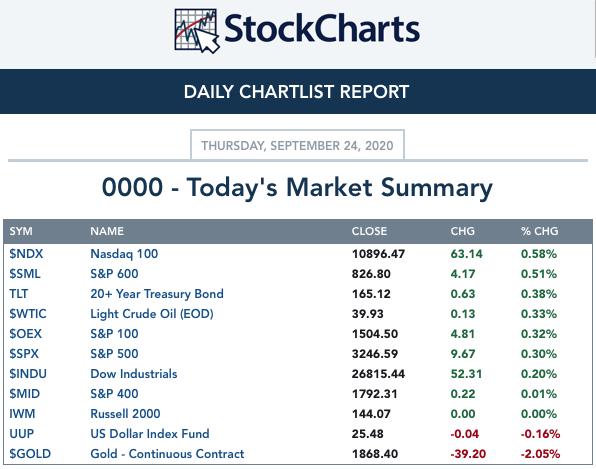
TODAY'S Broad Market Action:
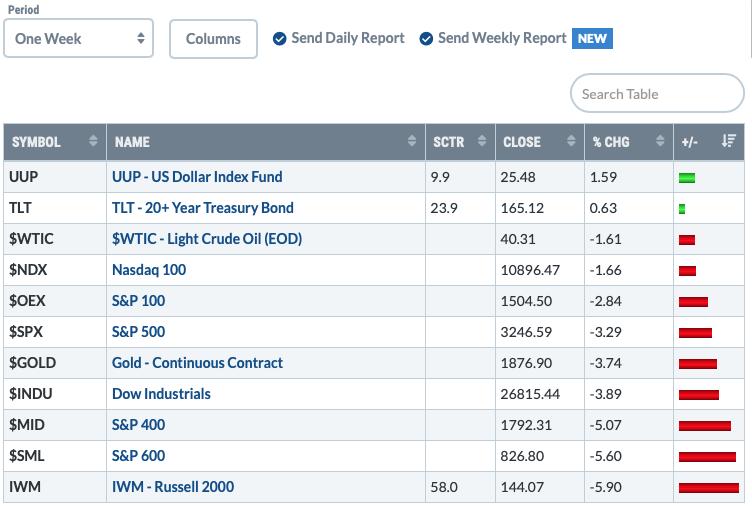
One WEEK Results:
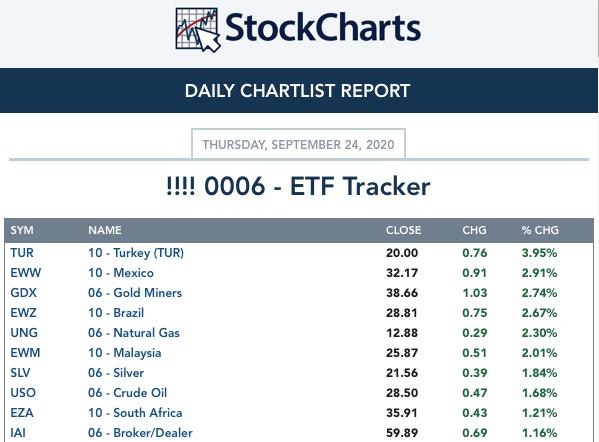
Top 10 from ETF Tracker:
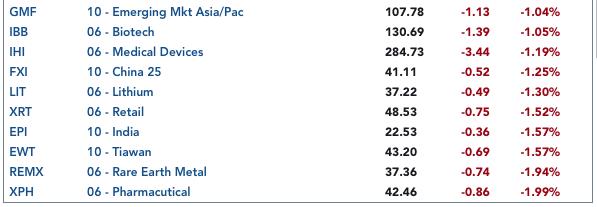
Bottom 10 from ETF Tracker:
On Friday, the DecisionPoint Alert Weekly Wrap presents an assessment of the trend and condition of the stock market (S&P 500), the U.S. Dollar, Gold, Crude Oil, and Bonds. Monday through Thursday the DecisionPoint Alert daily report is abbreviated and covers changes for the day.
Watch the latest episode of DecisionPoint on StockCharts TV's YouTube channel here!
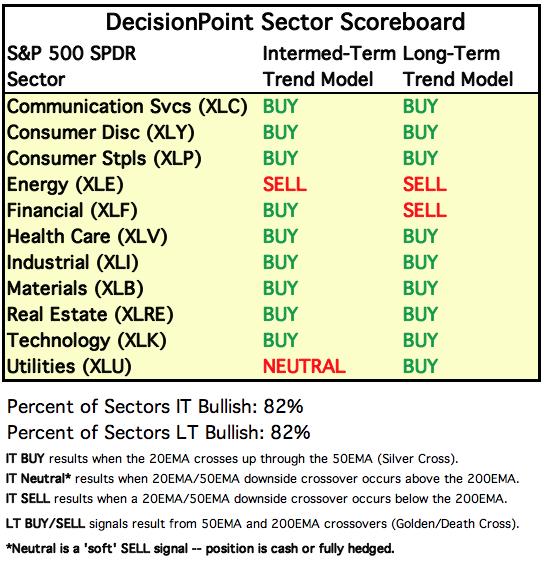
SECTORS
SIGNALS:
Each S&P 500 Index component stock is assigned to one, and only one, of 11 major sectors. This is a snapshot of the Intermediate-Term (Silver Cross) and Long-Term (Golden Cross) Trend Model signal status for those sectors.
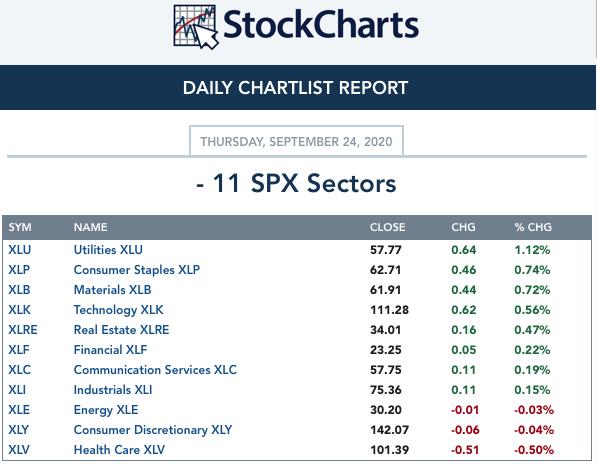
TODAY'S RESULTS:
One WEEK Results: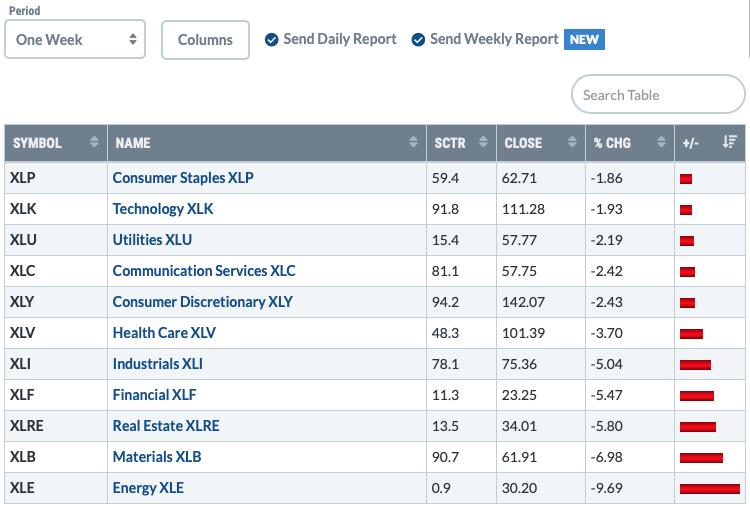
STOCKS
IT Trend Model: BUY as of 5/8/2020
LT Trend Model: BUY as of 6/8/2020
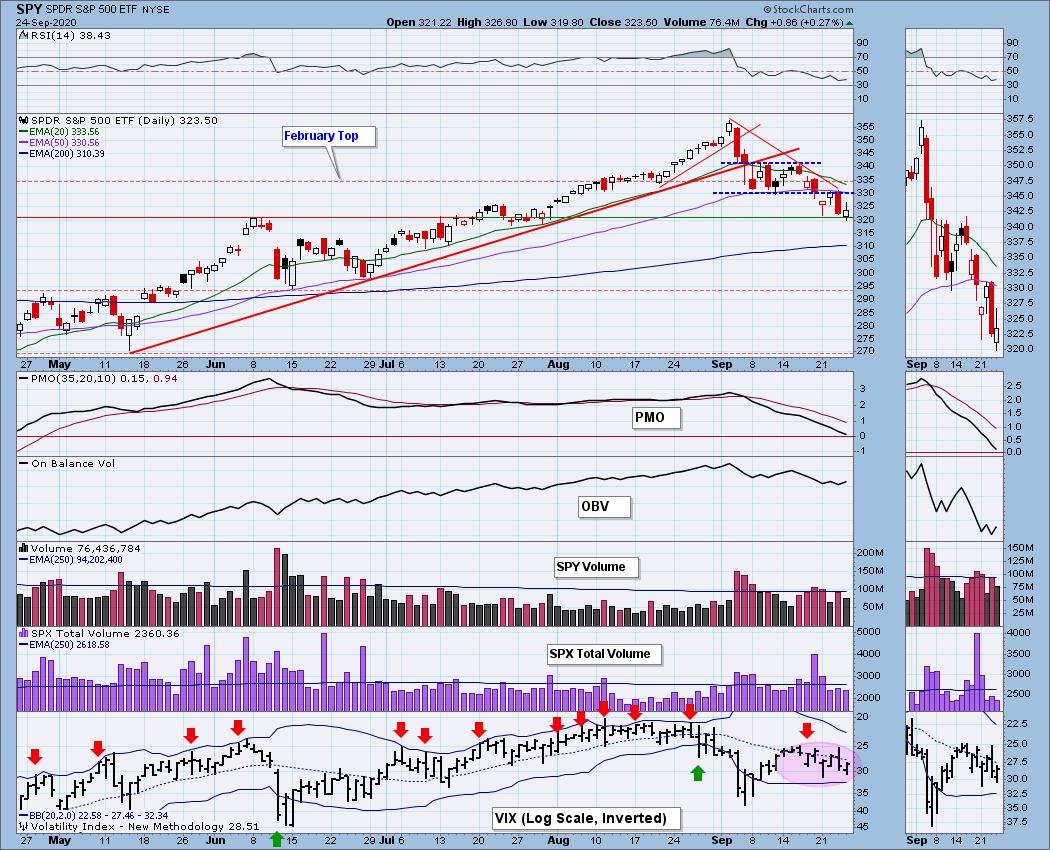
SPY Daily Chart: While price did end the day higher, it set an intraday low below support. Overall price remains in a declining trend. The PMO is almost in negative territory which is something not seen since April on our way out of the bear market. The OBV is confirming the decline and the RSI is negative. Volume was puny on this rally. The VIX continues to oscillate below its EMA on the inverted scale which implies more volatility ahead in a weakened market.
Climactic Market Indicators: No climactic numbers today. I was looking at a selling "initiation" impulse yesterday. While we did close higher on the day, we saw price dip briefly below support and it finished well below the session highs from Tuesday.
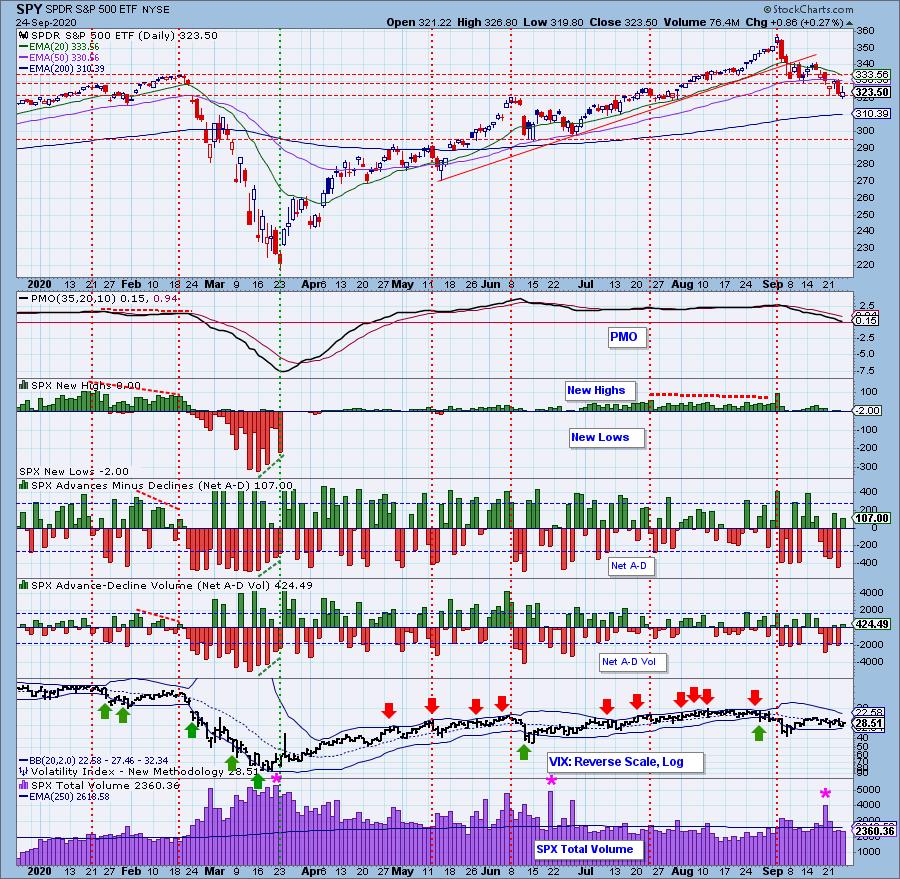
Short-Term Market Indicators: The short-term market trend is DOWN and the condition is OVERSOLD. Based upon the STO ranges, market bias is BEARISH.
These indicators continue lower and are now oversold. I am concerned when I look at the behavior of the STOs at the beginning of the bear market slide. While these are oversold readings, they look very similar to what we saw at the end of February. If we're fortunate, these conditions will be relieved with a rally. The %Stocks indicators are very oversold, but I'm reminded that they can remain there when there is a bearish market bias like we have now.
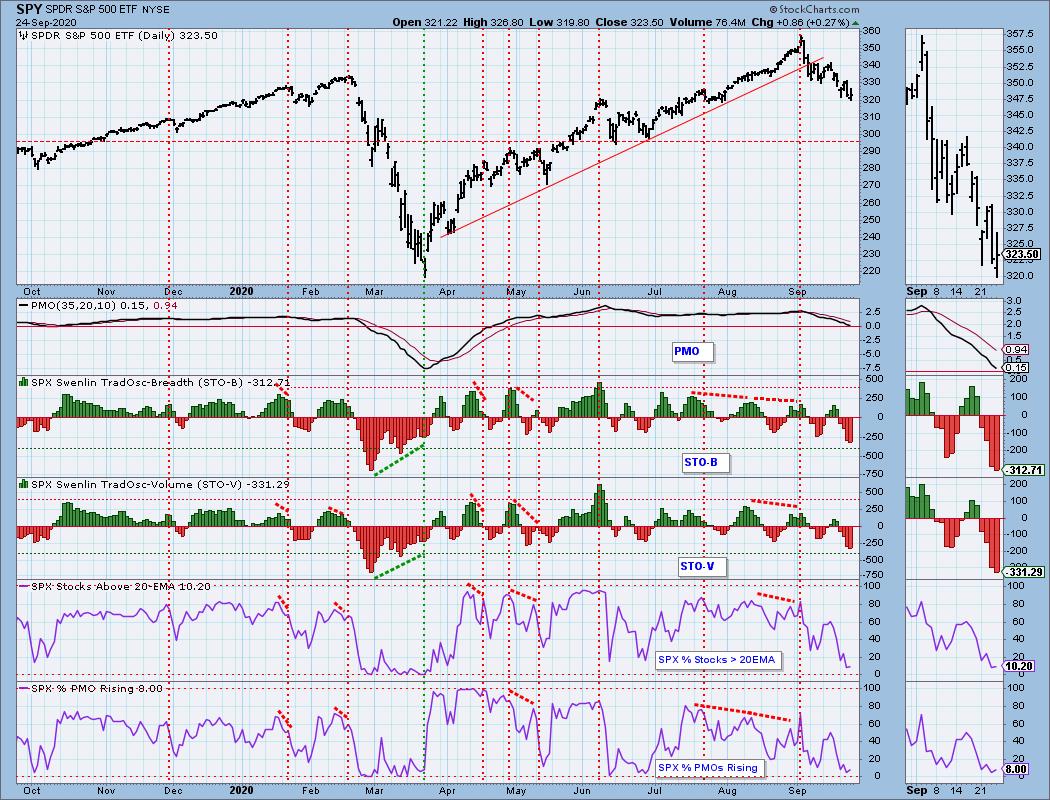
Intermediate-Term Market Indicators: The following chart uses different methodologies for objectively showing the depth and trend of participation for intermediate- and long-term time frames.
- The Silver Cross Index (SCI) shows the percentage of SPX stocks on IT Trend Model BUY signals (20-EMA > 50-EMA).
- The Golden Cross Index (GCI) shows the percentage of SPX stocks on LT Trend Model BUY signals (50-EMA > 200-EMA).
- The Bullish Percent Index (BPI shows the percentage of SPX stocks on Point & Figure BUY signals.
The GCI ticked upward today, but the SCI and BPI are in free fall. The SCI isn't really oversold at all when you look at readings from 2018 and 2019. The BPI is somewhat oversold.
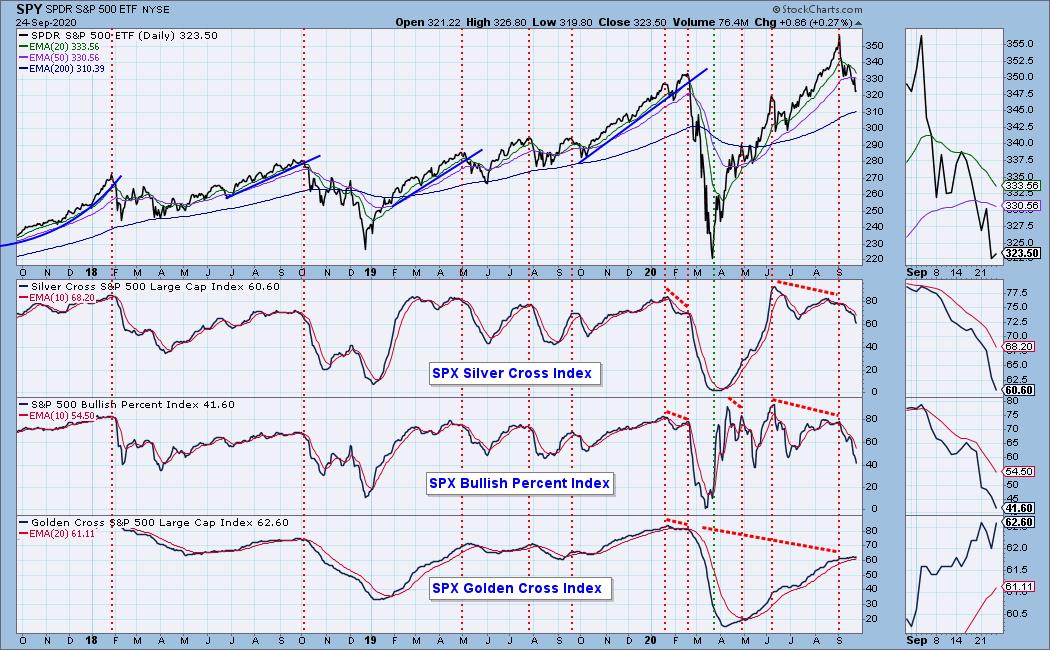
The intermediate-term market trend is DOWN and the condition is OVERSOLD. The market bias is BEARISH.
Yesterday's comments still apply:
"These indicators are oversold for a bull market bias. Unfortunately the bias is bearish and we know that these readings can move much much lower under those circumstances."
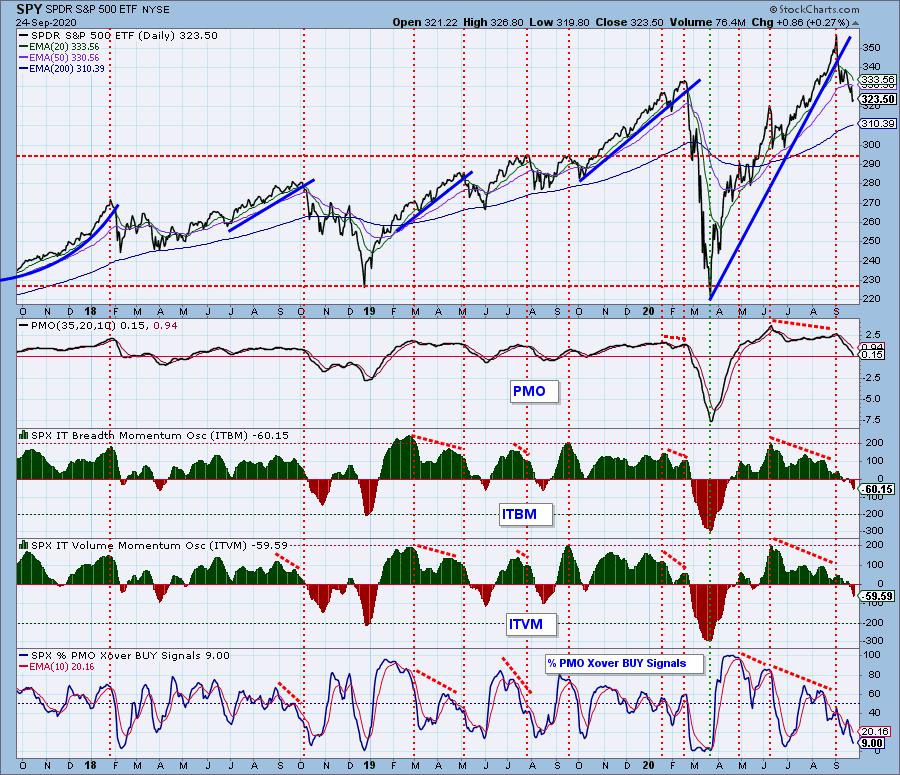
CONCLUSION: This would be the time for the market to find its legs with price sitting on support and indicators oversold. I think the selling initiation from yesterday hasn't yet played out. Many of the indicators are that oversold. With the VIX still staying below its EMA on the inverted scale and an intraday low below support, I believe price will need to test the 200-EMA before it rallies back.
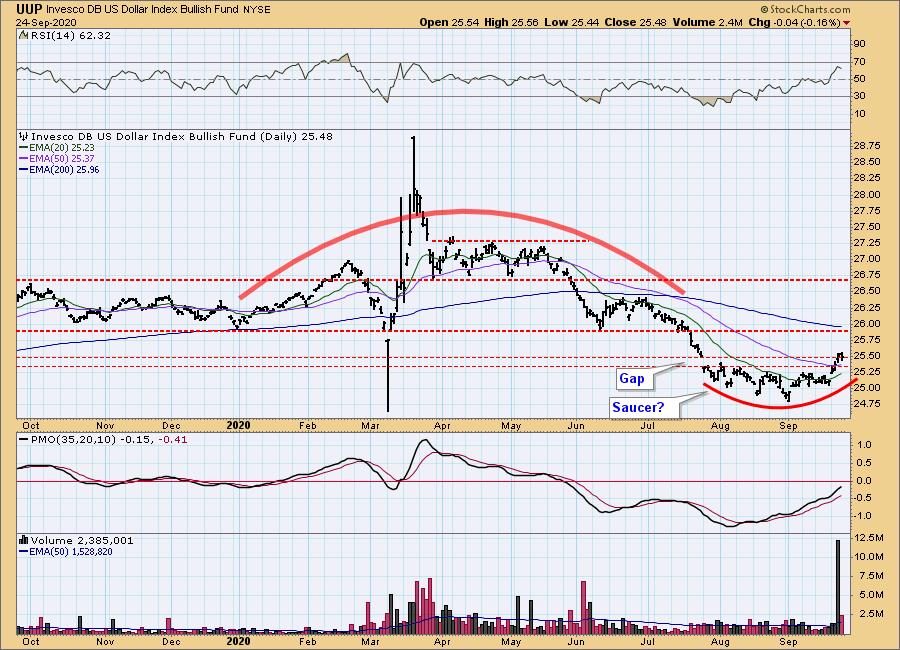
DOLLAR (UUP)
IT Trend Model: NEUTRAL as of 5/28/2020
LT Trend Model: SELL as of 7/10/2020
UUP Daily Chart: Yesterday's comments still apply:
"The Dollar was up again today and it finally pushed through the gap. If this turns out to be a "cup and handle" pattern, we could see a bit of a pullback before the rally continues. The indicators are bullish and suggest higher prices."
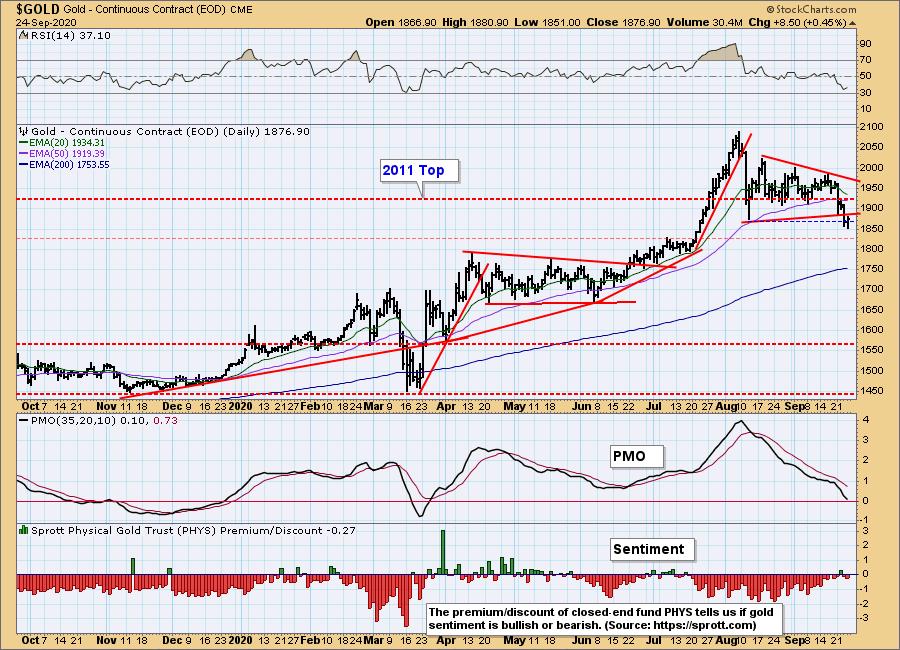
GOLD
IT Trend Model: BUY as of 3/24/2020
LT Trend Model: BUY as of 1/8/2019
GOLD Daily Chart: Yesterday the price of Gold was due more to a predominance of sellers than the rise in the Dollar. Today we had the opposite situation. The Dollar was down -0.16% and Gold was up +0.45%. Discounts returned which is good for Gold. I'm watching the 1825 area closely. While we could see a rebound here, the negative RSI and PMO nearing zero tell me to prepare for more downside.
Full Disclosure: I own GLD.
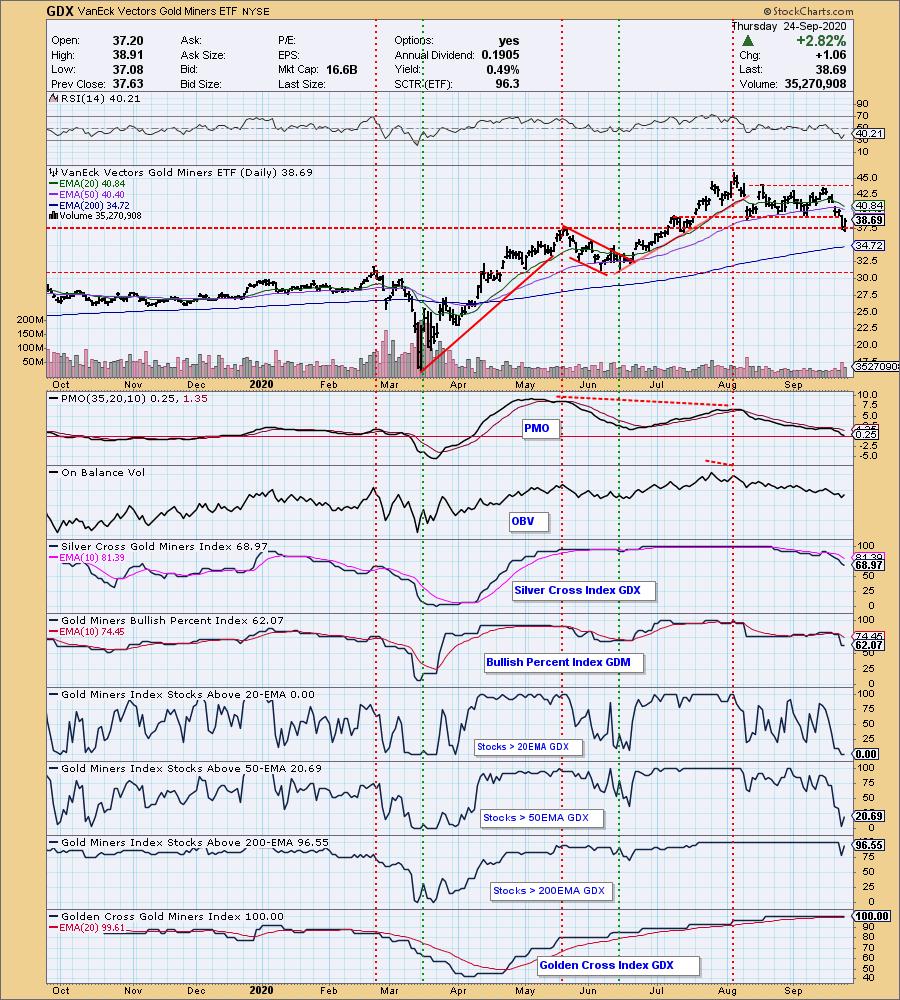
GOLD MINERS Golden and Silver Cross Indexes: Gold Miners were in the ETF Tracker top ten performers. We got the bounce we needed off support at the May top. GDX didn't get back in its trading range, but the RSI has turned up and the PMO is turning up before hitting negative territory. The %Stocks indicators are very oversold, yet all of the stocks have a "golden cross" which provides a solid foundation for a bounce.
CRUDE OIL (USO)
IT Trend Model: SELL as of 9/8/2020
LT Trend Model: SELL as of 2/3/2020
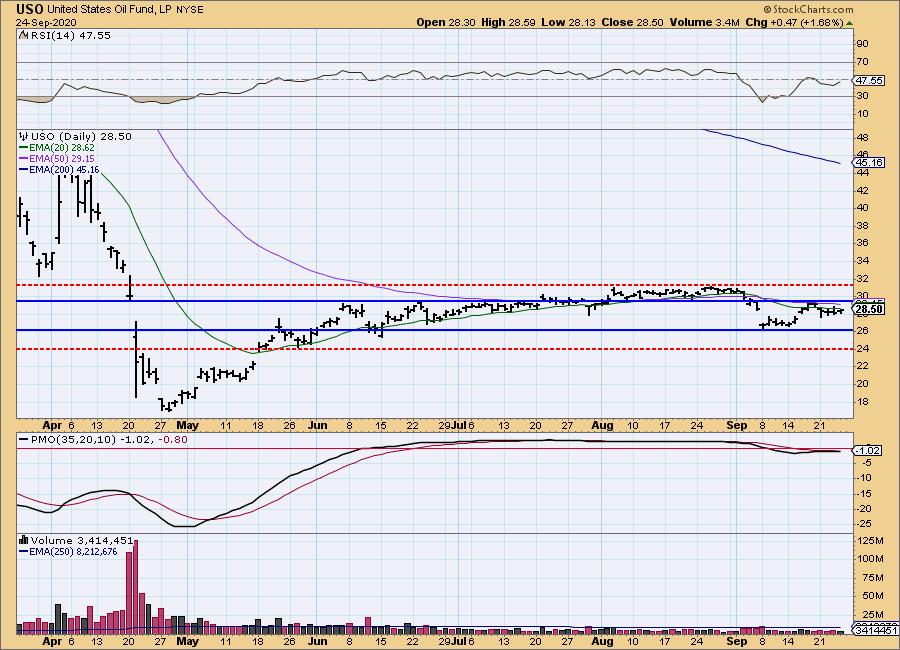
USO Daily Chart: Yesterday's comments still apply:
"The 20-EMA is still forming resistance. We have a PMO that has topped below its signal line and a negative RSI. It appears we may have a new trading channel (annotated in blue)."
BONDS (TLT)
IT Trend Model: Neutral as of 8/27/2020
LT Trend Model: BUY as of 1/2/2019
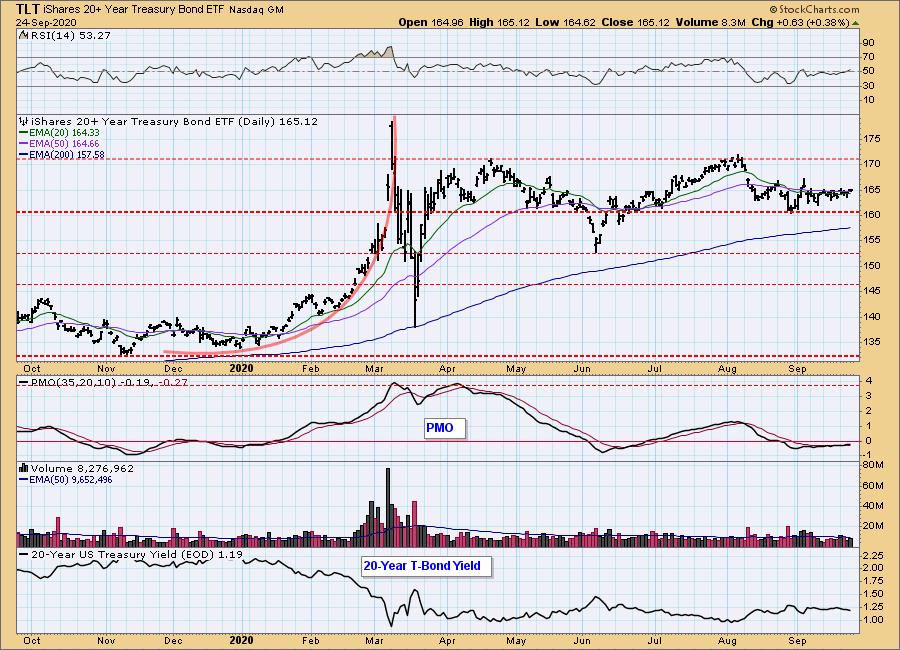
TLT Daily Chart: Yesterday's comments still apply:
"Really not much to talk about with TLT. It continues to consolidate sideways as it struggles to overcome resistance at the 20/50-EMAs. The PMO is now on a BUY signal and the RSI has reached positive territory so we could be seeing the beginning of a small rally to possibly challenge the September top."
Full disclosure: I own TLT.
Have you subscribed the DecisionPoint Diamonds yet? DP does the work for you by providing handpicked stocks/ETFs from exclusive DP scans! Get in on the new "DecisionPoint Diamond Mine" trading room that is part of that subscription! Contact support@decisionpoint.com for more information!
Technical Analysis is a windsock, not a crystal ball.
Happy Charting! - Erin
Email: erin@decisionpoint.com
NOTE: The signal status reported herein is based upon mechanical trading model signals, specifically, the DecisionPoint Trend Model. They define the implied bias of the price index based upon moving average relationships, but they do not necessarily call for a specific action. They are information flags that should prompt chart review. Further, they do not call for continuous buying or selling during the life of the signal. For example, a BUY signal will probably (but not necessarily) return the best results if action is taken soon after the signal is generated. Additional opportunities for buying may be found as price zigzags higher, but the trader must look for optimum entry points. Conversely, exit points to preserve gains (or minimize losses) may be evident before the model mechanically closes the signal.
Helpful DecisionPoint Links (Can Be Found on DecisionPoint.com Links Page):
DecisionPoint Shared ChartList and DecisionPoint Chart Gallery
Price Momentum Oscillator (PMO)