
Let me preface my comments: I am not an economist, nor could I play one on TV. Nevertheless, one does not need to be an economist to have an opinion about the economy, any more than having an opinion about the weather requires a degree in meteorology. All of us are affected by these things, and we should try to assess their potential impact on our lives, while at the same time recognizing our limitations. Here is my assessment, for what it's worth.
It wasn't many weeks ago we were being told that we were heading into a deflationary depression, but now we're being told that inflation is what we should expect. Inflation is caused by too much money chasing too few goods, and deflation is caused by excess supply and/or insufficient demand. I can't fault the assertion that inflation is headed our way -- in some respects it's already here, thanks to trillions being spent on the stimulus. But does that automatically defeat deflation pressures?
I thought about that for a while, and I realized that we could be facing both: (1) deflation in certain assets, like stocks and real estate, and (2) inflation in things like consumer staples and utilities. In my opinion, stocks and real estate are both in bubbles. Stocks have benefited from the tsunami of easy money, and the Fed kept interest rates very low so that real estate prices could reinflate after the 2008 crash. If (when) real estate prices again head lower and with interest rates still in the basement, what new device can be used to keep prices up? We probably don't want to know.
The basic argument justifying every real estate bubble I've experienced is that "people have to live somewhere." This is true, but it doesn't have to be in a $500,000 house. As for stock market bubbles, it's always "this time it's different." It usually is different in some ways, except how it ends.
The DecisionPoint Alert Weekly Wrap presents an end-of-week assessment of the trend and condition of the Stock Market, the U.S. Dollar, Gold, Crude Oil, and Bonds. The DecisionPoint Alert daily report (Monday through Thursday) is abbreviated and gives updates on the Weekly Wrap assessments.
Watch the latest episode of DecisionPoint on StockCharts TV's YouTube channel here!
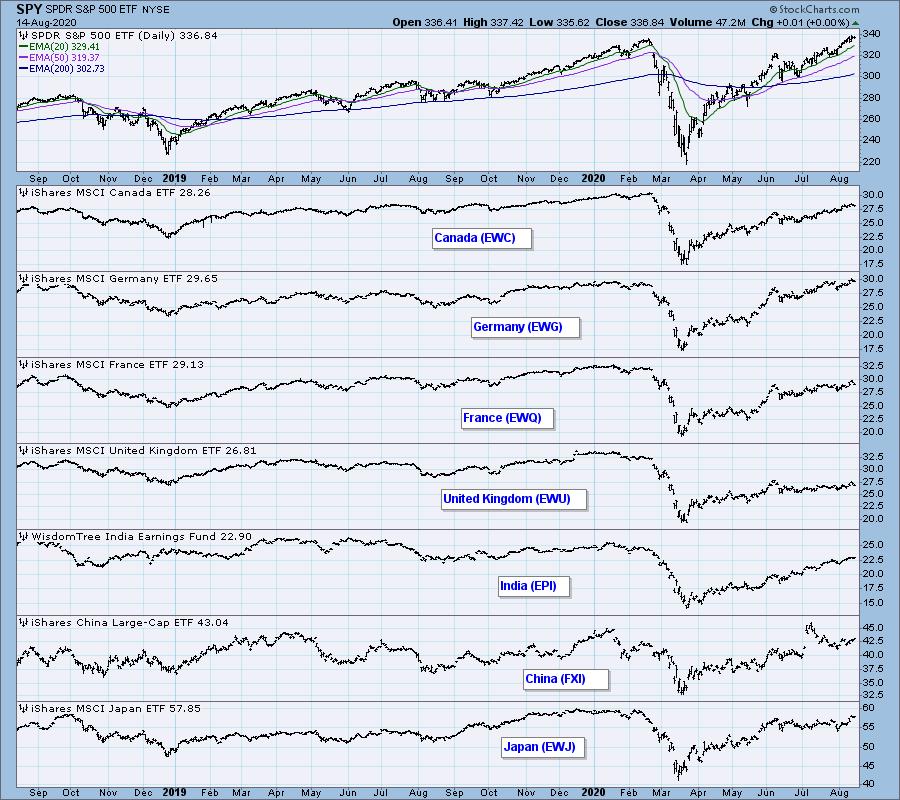
GLOBAL MARKETS
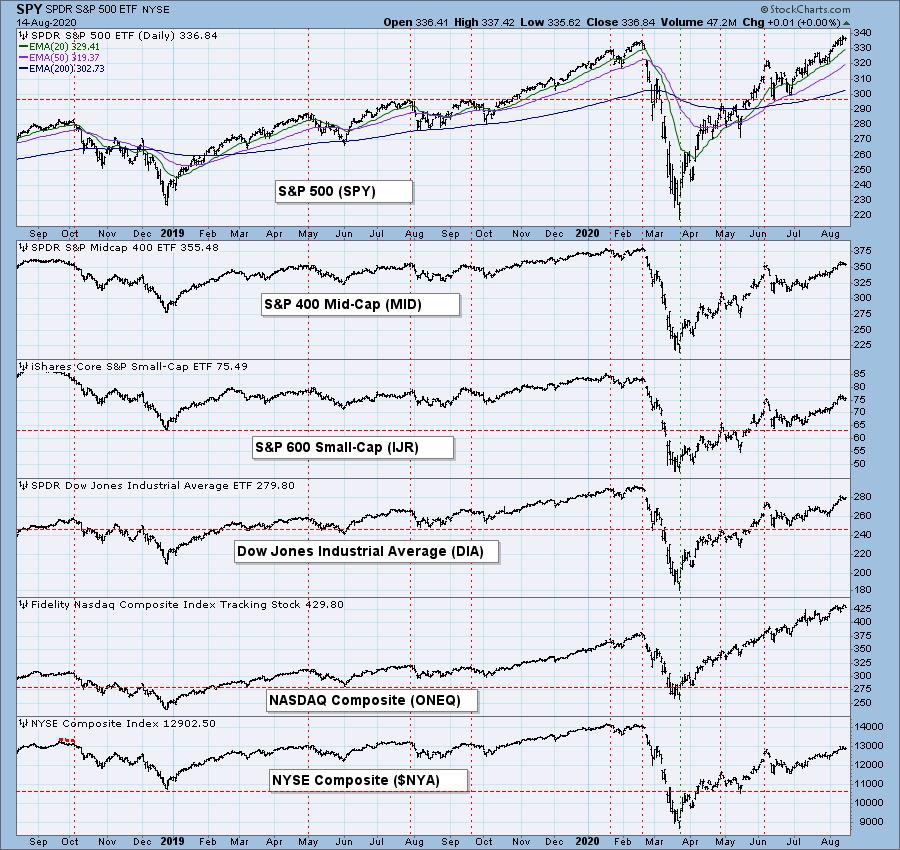
BROAD MARKET INDEXES
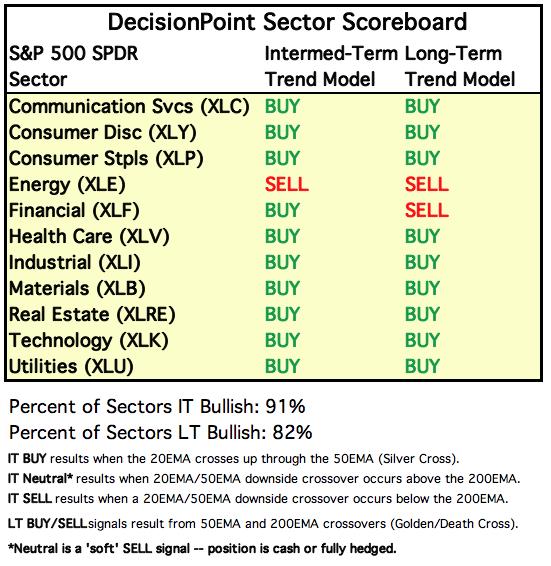
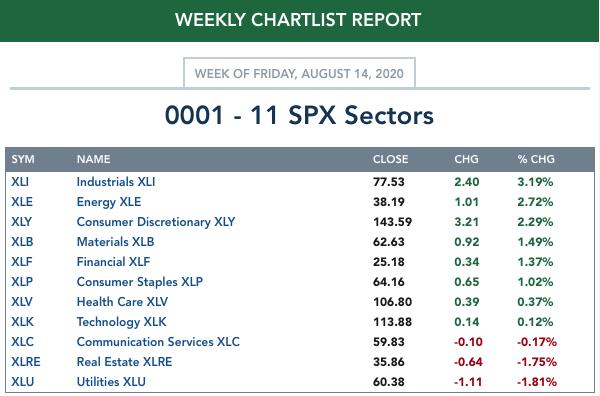
SECTORS
Each S&P 500 Index component stock is assigned to one, and only one, of 11 major sectors. This is a snapshot of the Intermediate-Term (Silver Cross) and Long-Term (Golden Cross) Trend Model signal status for those sectors.
ETF TRACKER: This is a list of about 100 ETFs intended to track a wide range of U.S. market indexes, sectors, global indexes, interest rates, currencies, and commodities. StockCharts.com subscribers can acquire it in the DecisionPoint Trend and Condition ChartPack.
Top 10 . . .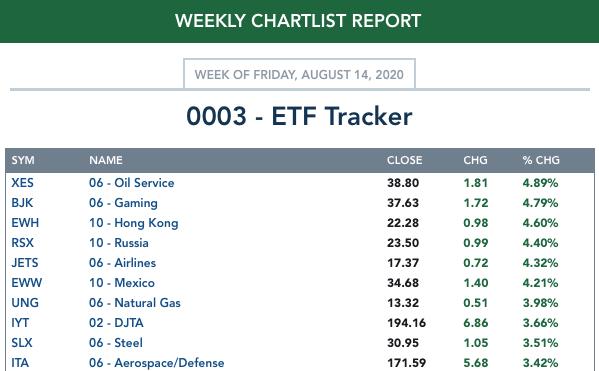
. . . and bottom 10: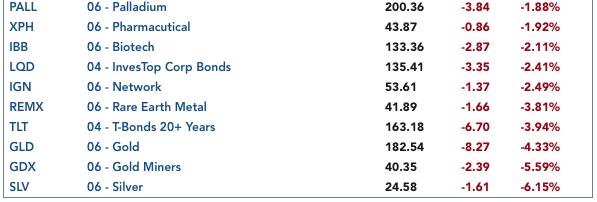
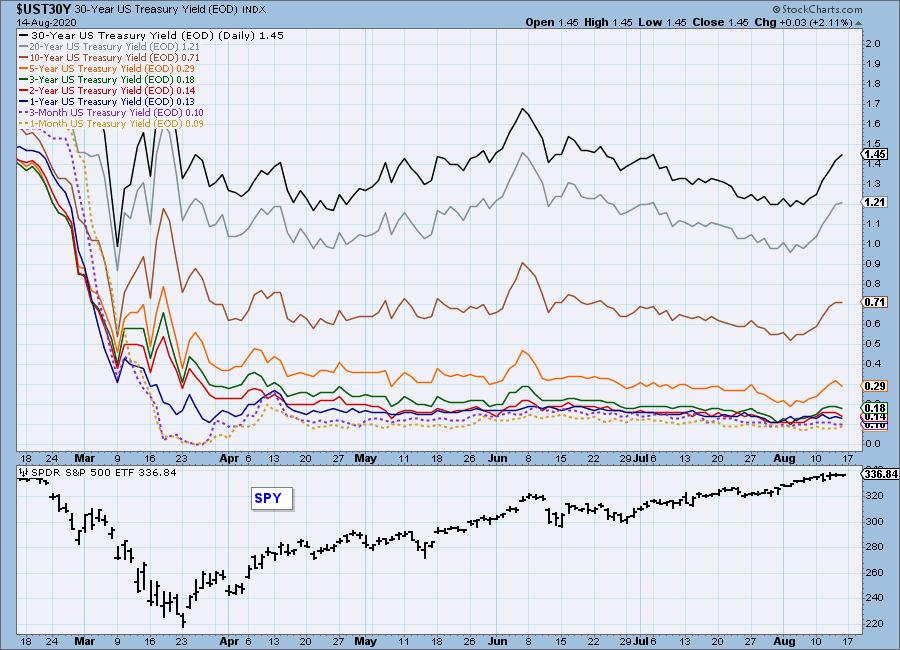
INTEREST RATES
This chart is included so we can monitor rate inversions. In normal circumstances the longer money is borrowed the higher the interest rate that must be paid. When rates are inverted, the reverse is true.
STOCKS
IT Trend Model: BUY as of 5/8/2020
LT Trend Model: BUY as of 6/8/2020
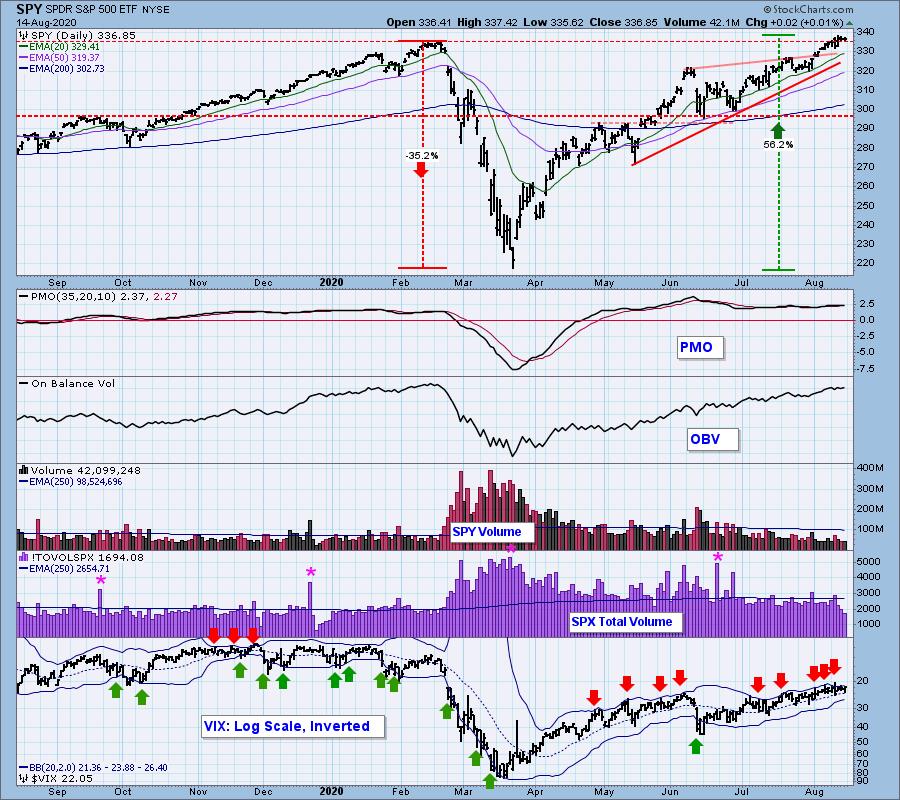
SPY Daily Charts: SPY managed to eke out new, all-time highs this week, but the S&P 500 was just a little short. After the new highs, the market stalled, and SPX Total Volume contracted -- it was only 63% of the one-year daily average. The PMO is above the signal line, but in that flat configuration it doesn't mean much.
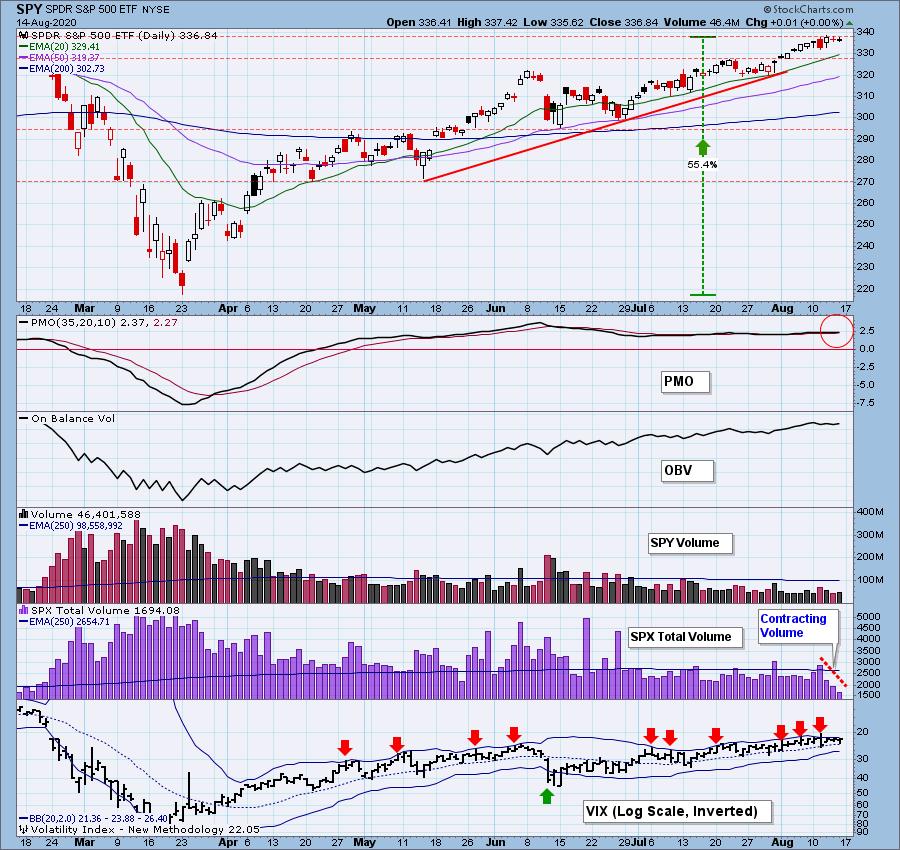
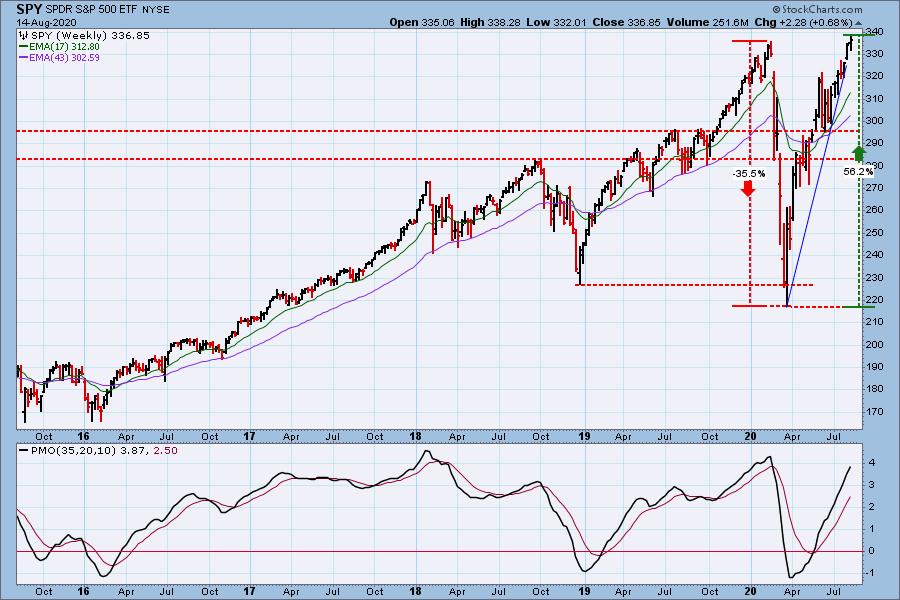
SPY Weekly Chart: With SPY making record highs this week, the bear market is officially over; however, the rally from the March low is extremely steep and begs for a steep correction.
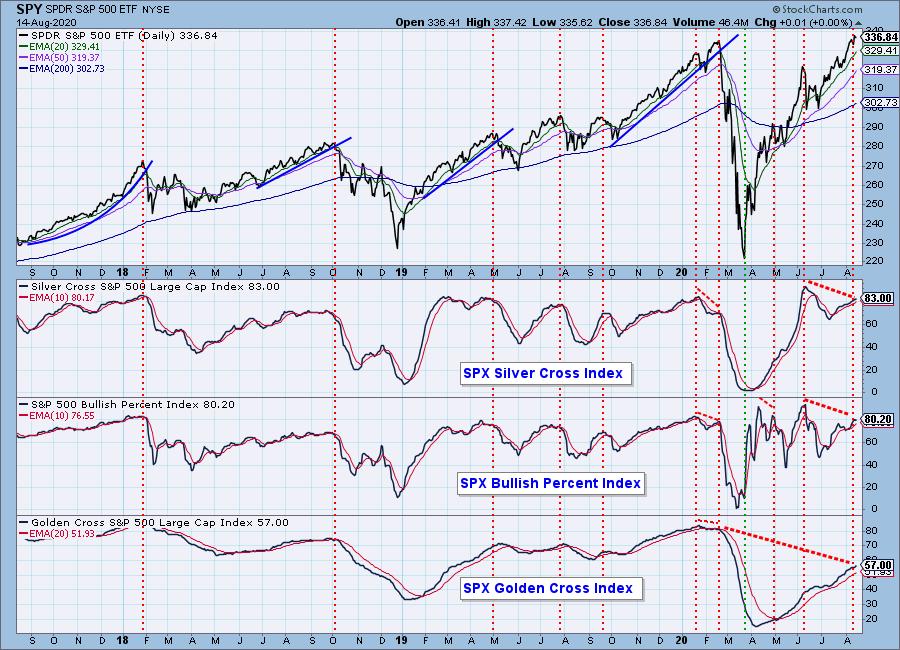
Participation: The following chart uses different methodologies for objectively showing the depth and trend of participation for intermediate- and long-term time frames.
The Silver Cross and Bullish Percent Indexes are about 11% lower than their June peaks, Maybe that's not so bad, considering that their current readings are about equal to major tops in the last three years; however, the Golden Cross Index is 32% below its February top. That is indeed very thin long-term participation.
Climactic Market Indicators: Based upon SPX Total Volume, there was an upside exhaustion climax on Tuesday, but there was no other climactic behavior to confirm that.
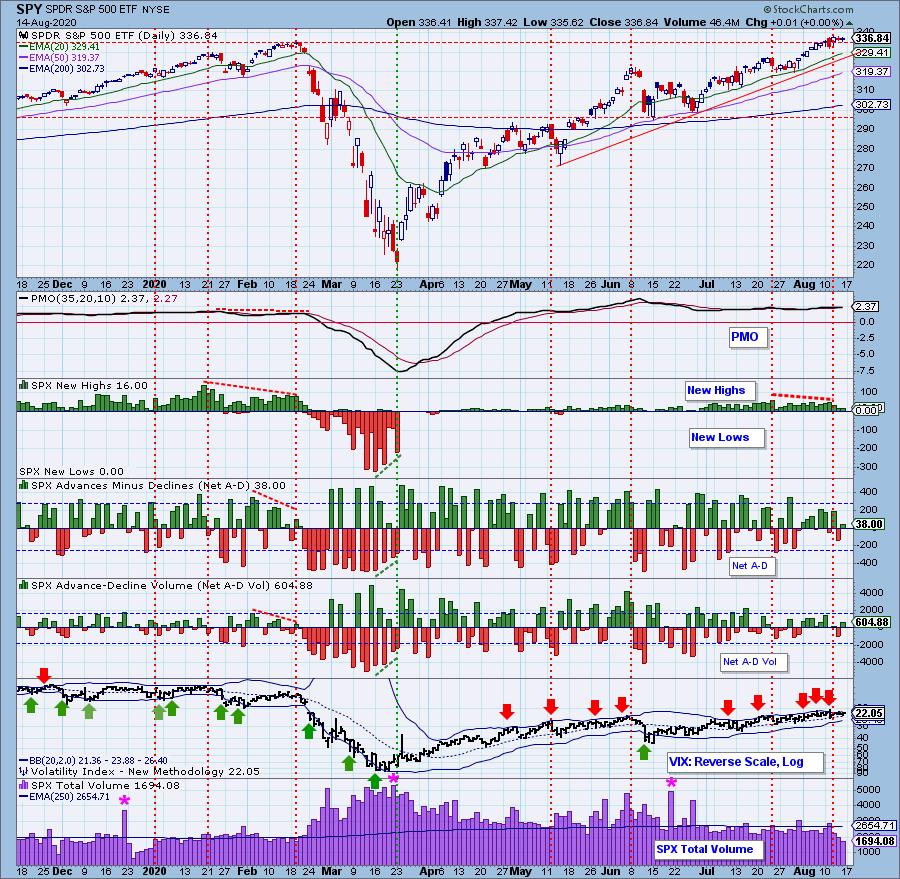
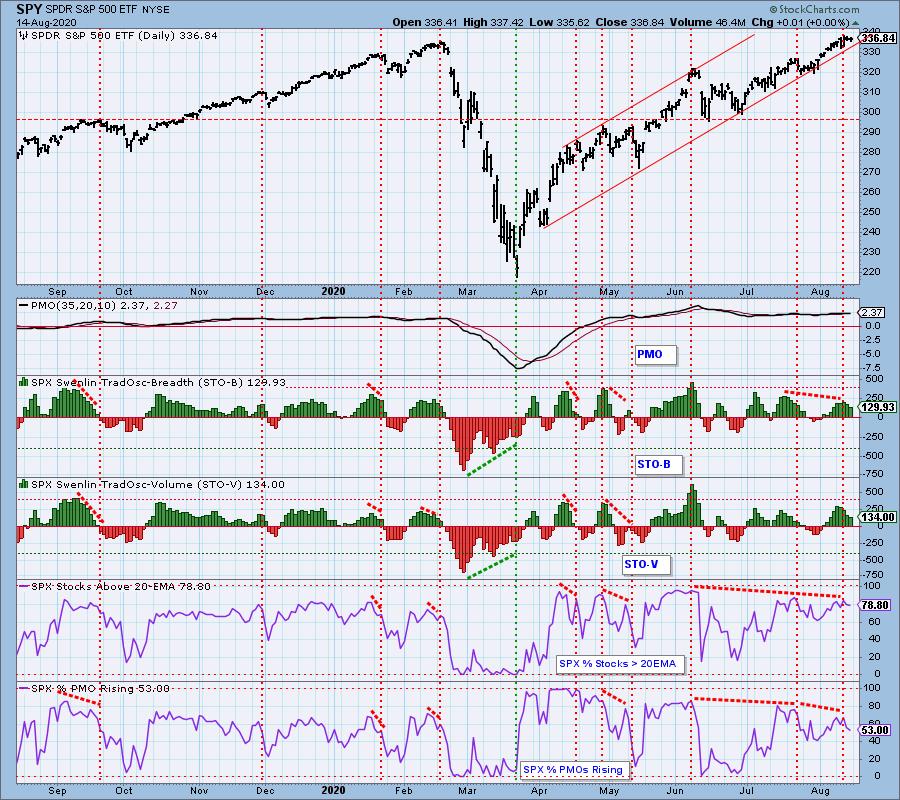
Short-Term Market Indicators: The short-term market trend is UP and the condition is NEUTRAL. The market bias is somewhat bullish. There are some negative divergences on this chart, and the Precent PMOs Rising is particularly severe.
Intermediate-Term Market Indicators: The intermediate-term market trend is UP and the condition is modestly OVERBOUGHT. The market bias in this time frame is bullish. However, all indicators have negative divergences. The Percent PMO Crossover BUY Signals, like the short-term Percent PMOs Rising, is sharply lower than its two prior tops.
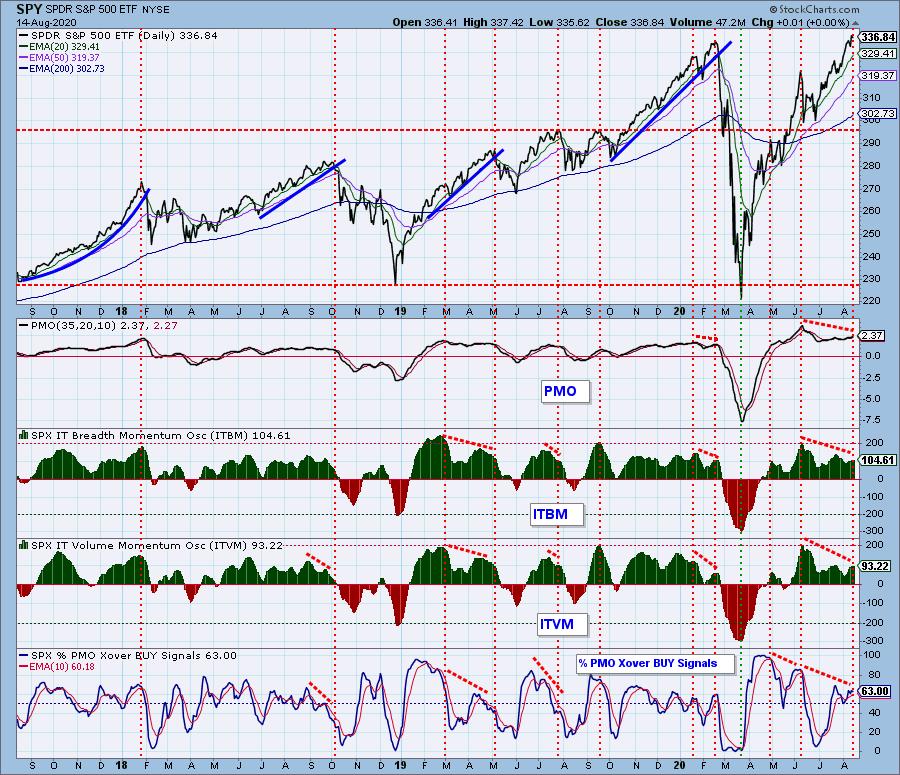
CONCLUSION: The market still shows no inclination to enter a correction, even though there are many negative divergences. Nevertheless, while the market just seems to want to go higher, the condition is such that there are probably better times to open new longs. Keep in mind that negative divergences don't always deliver price declines, but there's always a good chance that they will.
Note: Next week is an options expiration week, so we should expect low volatility toward the end of the week.
Have you subscribed the DecisionPoint Diamonds yet? DP does the work for you by providing handpicked stocks/ETFs from exclusive DP scans! Add it with a discount! Contact support@decisionpoint.com for more information!
DOLLAR (UUP)
IT Trend Model: NEUTRAL as of 5/28/2020
LT Trend Model: SELL as of 7/10/2020
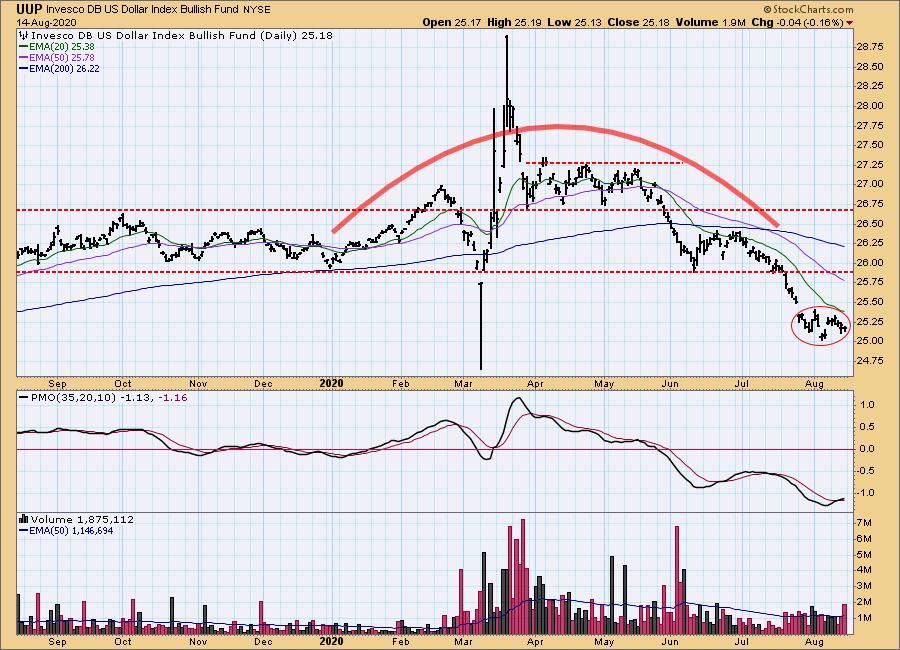
UUP Daily Chart: Price has been consolidating in an island for the last three weeks. Probably just a pause in the down trend, rather than a potential island reversal. The daily PMO is trying to top below the zero line, a bad sign.
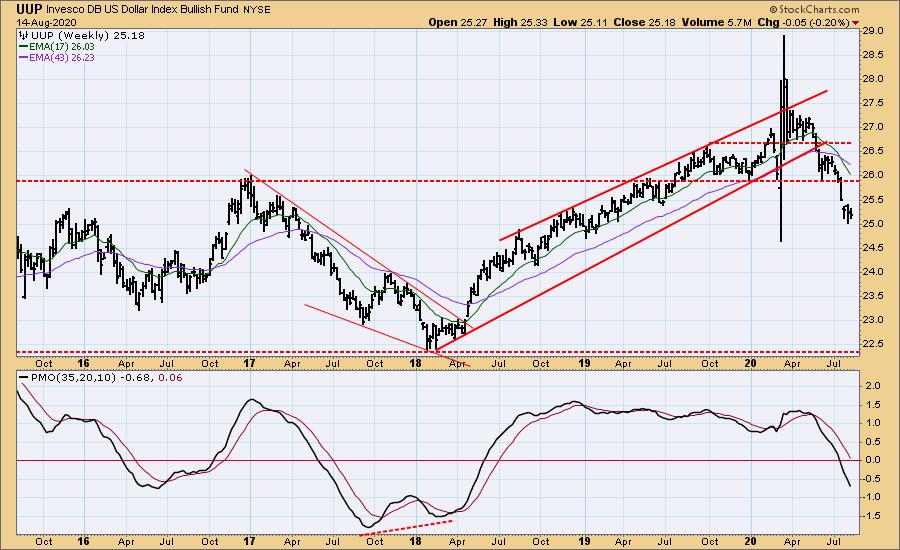
UUP Weekly Chart: The weekly PMO is below the zero line and falling at a brisk pace.
GOLD
IT Trend Model: BUY as of 3/24/2020
LT Trend Model: BUY as of 1/8/2019
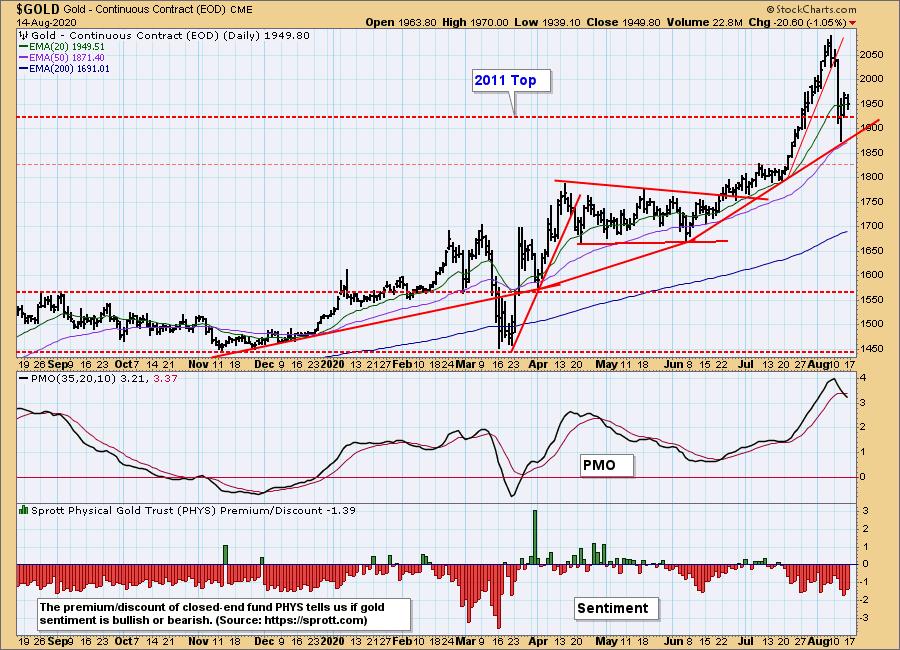
GOLD Daily Chart: On Wednesday, gold dropped below the long-term support on an intraday basis, but it bounced back above it. Notice that it intercepted a less accelerated rising trend line, which has a more sustainable rate of climb. I find it puzzling that no bullish sentiment emerged during the advance from mid-June, and I'm afraid I misinterpreted that as being bullish. I think it would have been better if the advance had seen some bullish sentiment, as a sign investors were prepared to believe the move and back it.
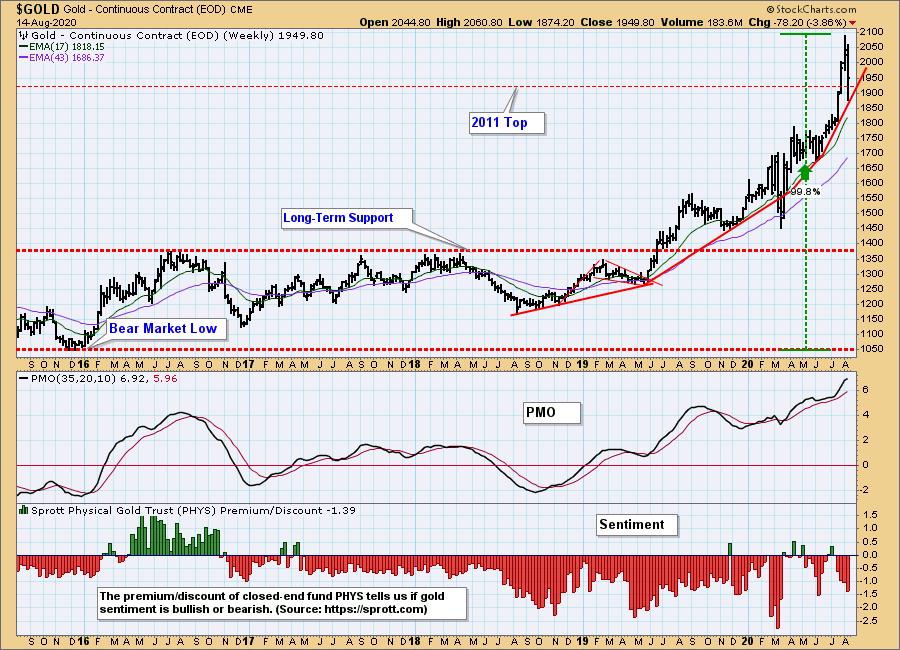
GOLD Weekly Chart: The short-term vertical move has corrected somewhat, and that may be enough of a pullback to diffuse the excesses. It would be healthy for gold to consolidate sideways for a while before launching the next leg up.
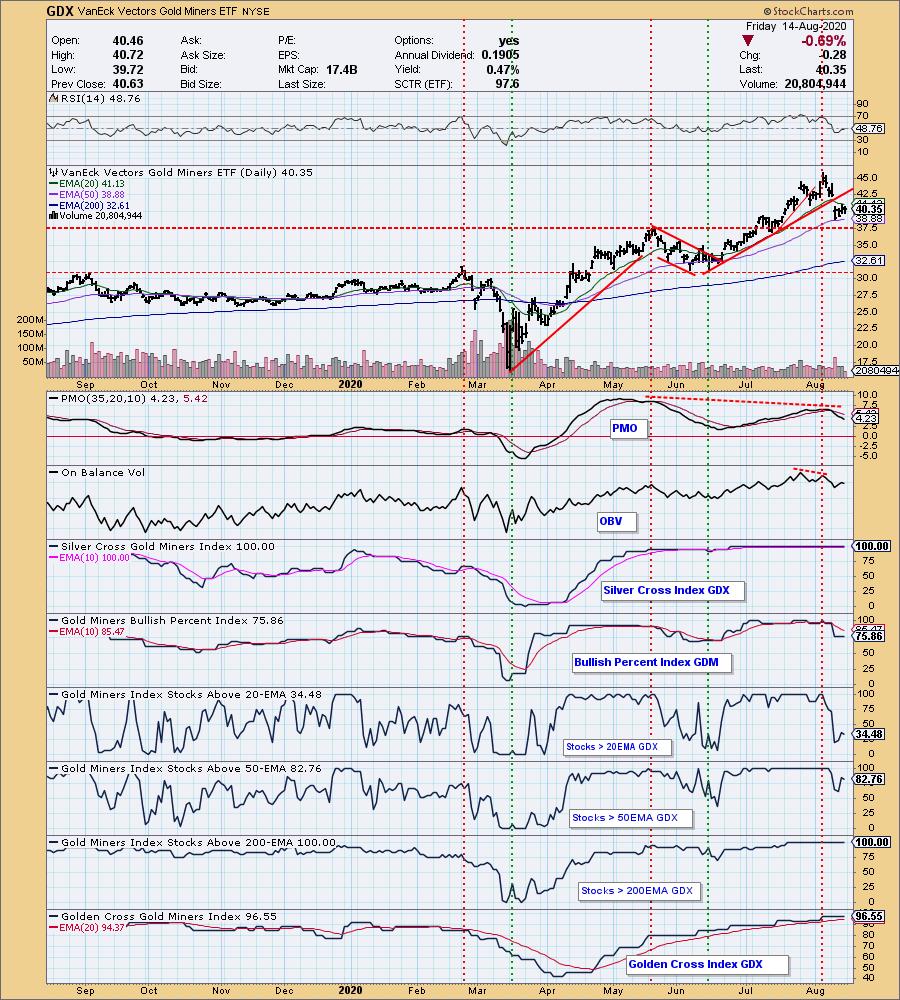
GOLD MINERS Golden and Silver Cross Indexes: The rising trend line was violated this week, and the next support is about 37.50.
CRUDE OIL (USO)
IT Trend Model: BUY as of 8/13/2020
LT Trend Model: SELL as of 2/3/2020
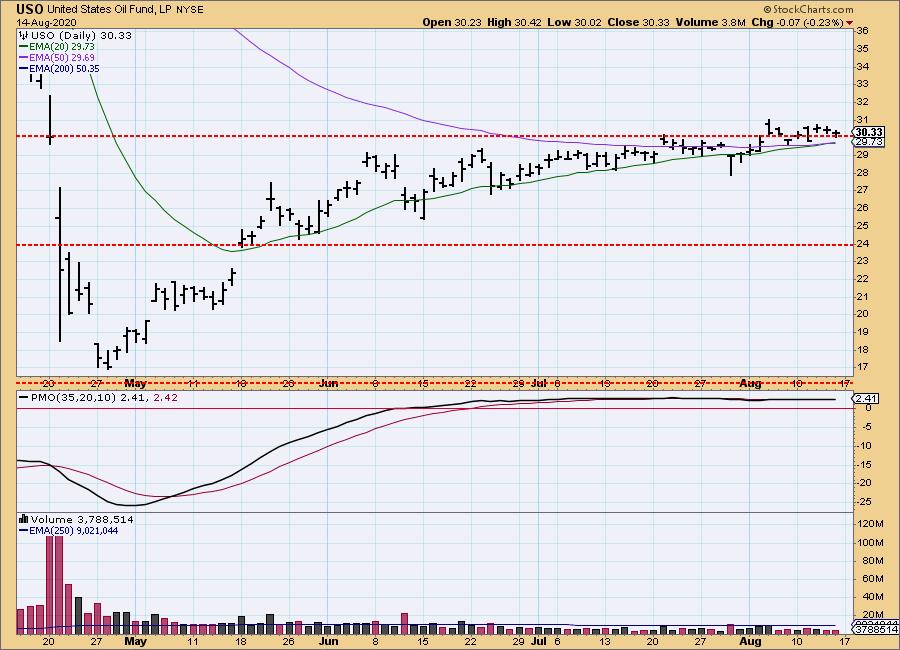
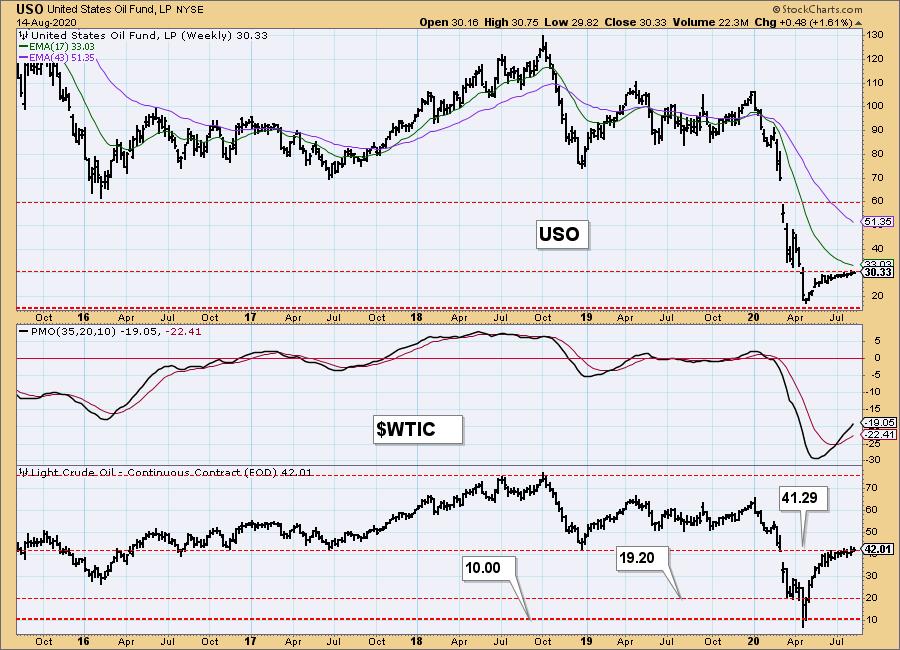
USO Daily Chart: A new IT Trend Model BUY signal (Silver Cross) was generated on Thursday, but price started flattening two months ago, and in this case the new signal doesn't indicate a change of trend.
USO/$WTIC Weekly Chart: It appears that crude has stabilized until the supply/demand equation shifts.
BONDS (TLT)
IT Trend Model: BUY as of 6/26/2020
LT Trend Model: BUY as of 1/2/2019
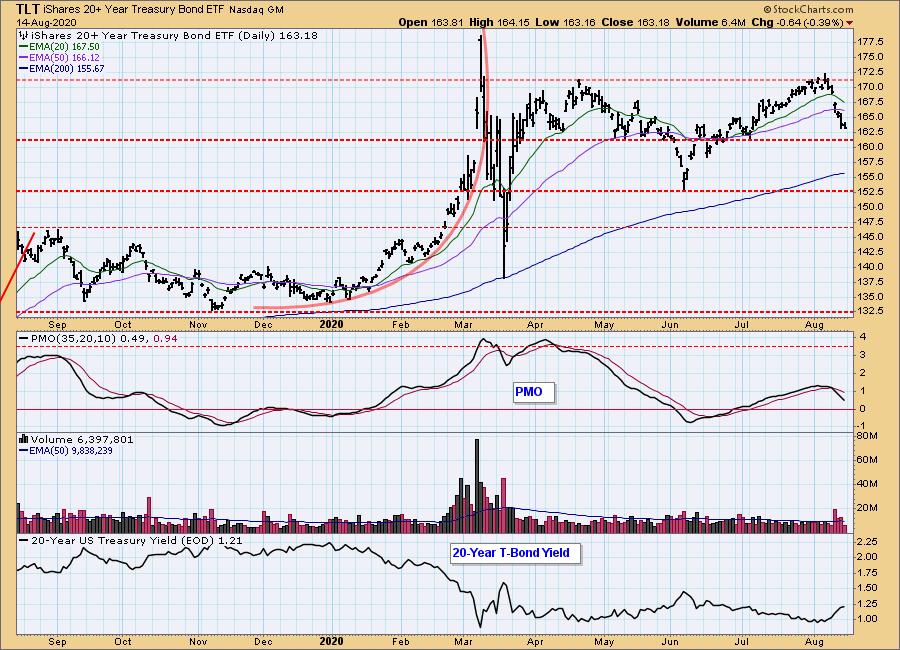
TLT Daily Chart: TLT is approaching the first likely level of support at about 161.
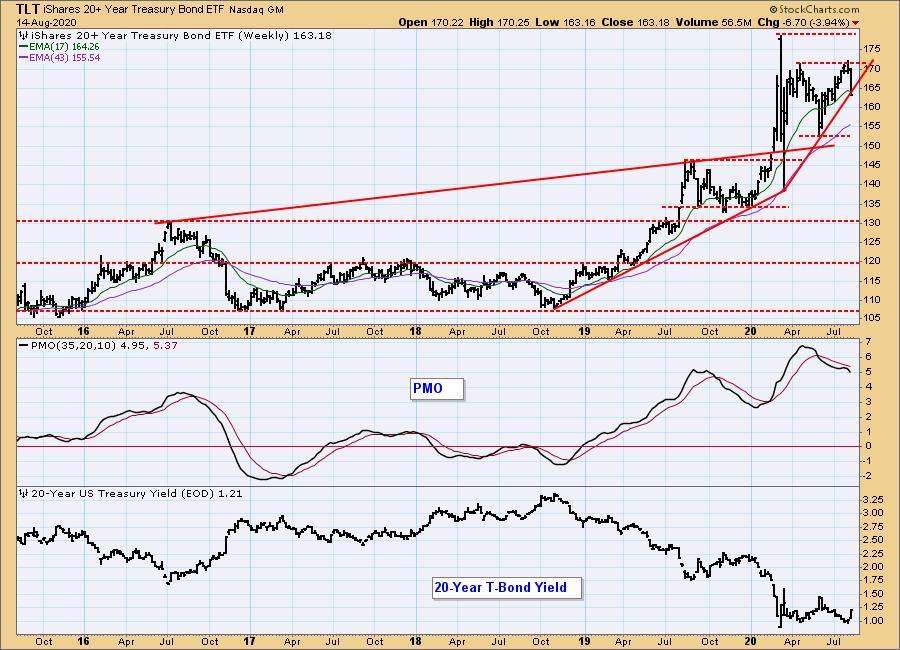
TLT Weekly Chart: This time frame looks less positive. A rising trend line has been broken, and the weekly PMO has topped below the signal line.
Technical Analysis is a windsock, not a crystal ball.
Happy Charting! - Carl
Disclaimer: This blog is for educational purposes only and should not be construed as financial advice. The ideas and strategies should never be used without first assessing your own personal and financial situation, or without consulting a financial professional. Any opinions expressed herein are solely those of the author, and do not in any way represent the views or opinions of any other person or entity.
NOTE: The signal status reported herein is based upon mechanical trading model signals, specifically, the DecisionPoint Trend Model. They define the implied bias of the price index based upon moving average relationships, but they do not necessarily call for a specific action. They are information flags that should prompt chart review. Further, they do not call for continuous buying or selling during the life of the signal. For example, a BUY signal will probably (but not necessarily) return the best results if action is taken soon after the signal is generated. Additional opportunities for buying may be found as price zigzags higher, but the trader must look for optimum entry points. Conversely, exit points to preserve gains (or minimize losses) may be evident before the model mechanically closes the signal.
Helpful DecisionPoint Links:
DecisionPoint Alert Chart List
DecisionPoint Golden Cross/Silver Cross Index Chart List
DecisionPoint Sector Chart List
Price Momentum Oscillator (PMO)
Swenlin Trading Oscillators (STO-B and STO-V)