
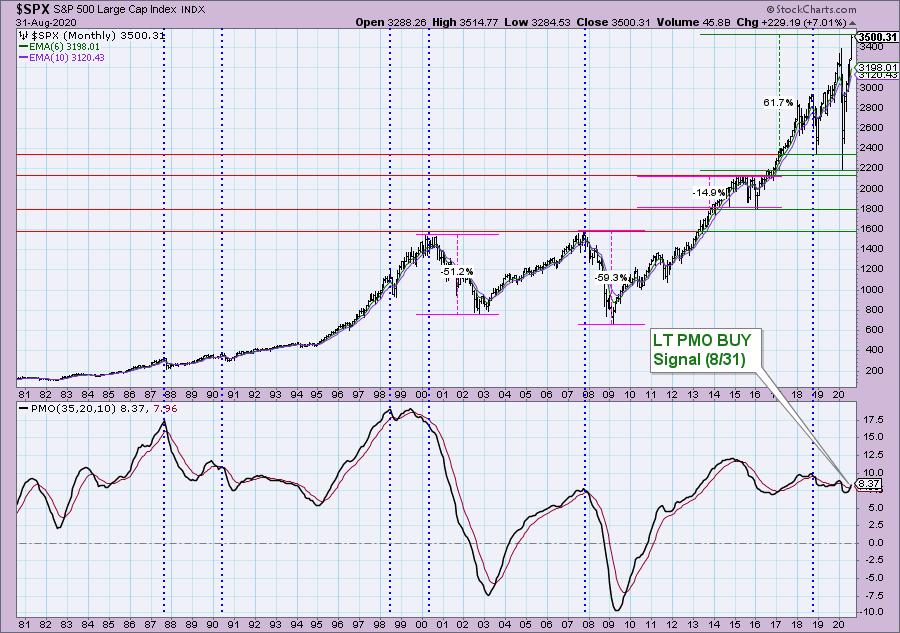
Many of you who have been watching the monthly chart for the SPX over the past few weeks will note that the monthly PMO had a positive crossover awhile ago. However, those monthly PMO crossover BUY (or SELL) signals don't go "final" until the conclusion of the last trading day of the month. Looking at the monthly chart below you can see the near vertical rally out of the bear market low. Vertical and parabolic rallies generally don't end well, so we will need to keep a close eye on the indicators. Speaking of indicators, how many of you have noticed the strange divergence of the VIX with the rising market?

Here is the link to register for next Monday's (9/7/2020) free DecisionPoint Trading Room!
Here is the link to the recording from Monday (8/31/2020) where Erin looked at Apple (AAPL) & Tesla (TSLA) and took symbol requests. She introduced how to use the 5-minute bar chart to time your entries! Password to view recording: V#^P89Yv
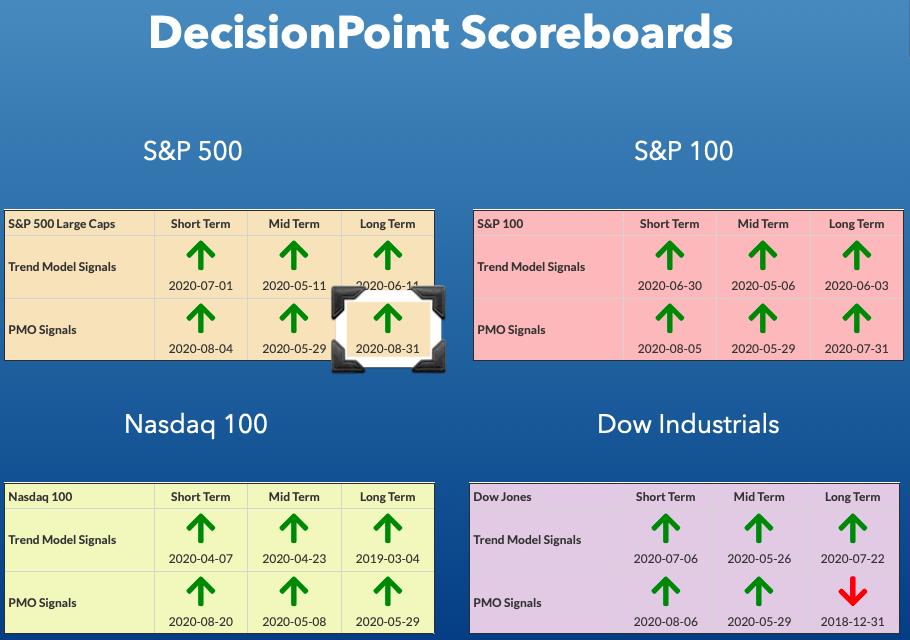
DP INDEX SCOREBOARDS:
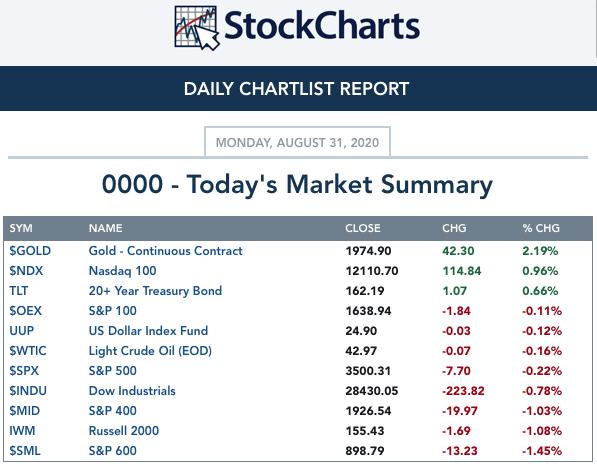
TODAY'S Broad Market Action:
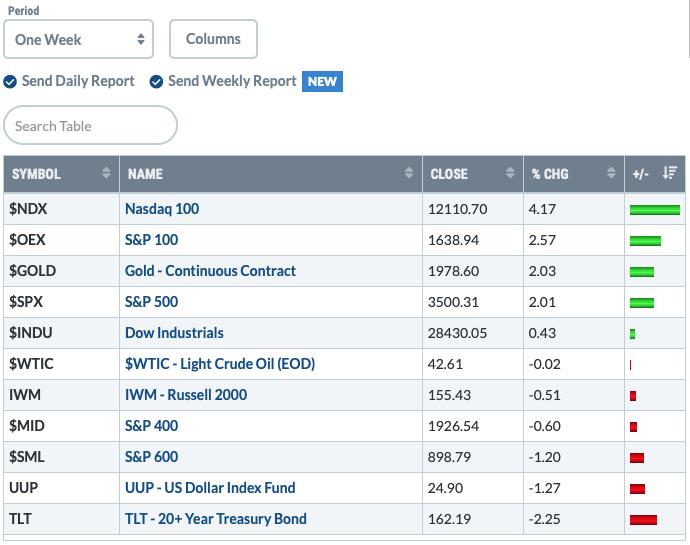
One WEEK Results:
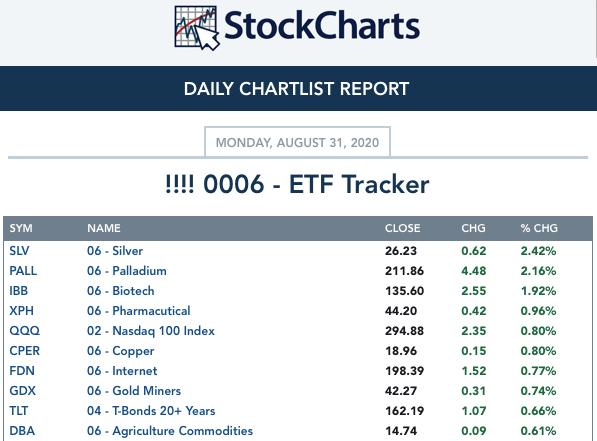
Top 10 from ETF Tracker:
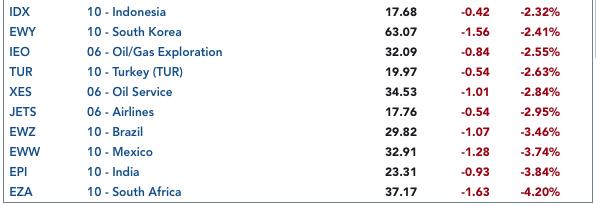
Bottom 10 from ETF Tracker:
On Friday, the DecisionPoint Alert Weekly Wrap presents an assessment of the trend and condition of the stock market (S&P 500), the U.S. Dollar, Gold, Crude Oil, and Bonds. Monday through Thursday the DecisionPoint Alert daily report is abbreviated and covers changes for the day.
Watch the latest episode of DecisionPoint on StockCharts TV's YouTube channel here!
SECTORS
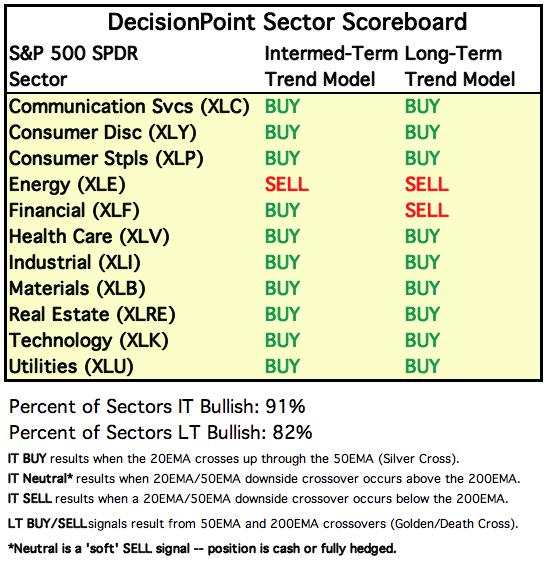
SIGNALS:
Each S&P 500 Index component stock is assigned to one, and only one, of 11 major sectors. This is a snapshot of the Intermediate-Term (Silver Cross) and Long-Term (Golden Cross) Trend Model signal status for those sectors.
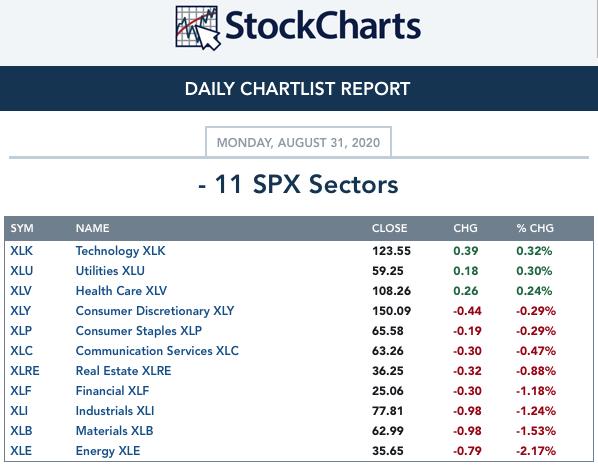
TODAY'S RESULTS:
One WEEK Results: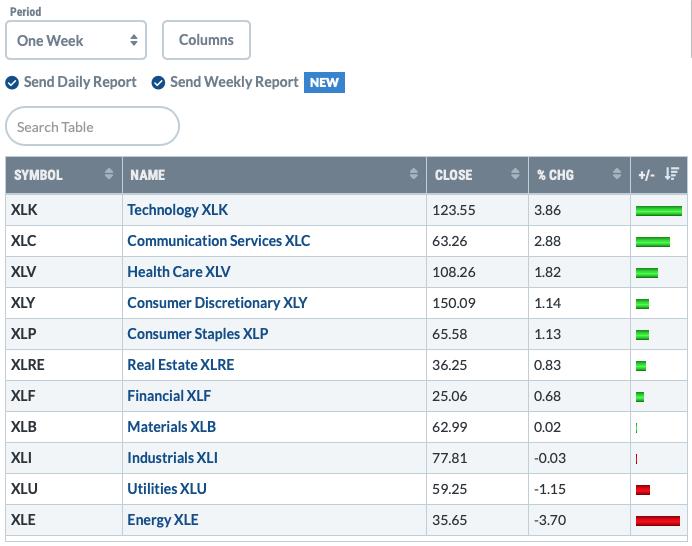
STOCKS
IT Trend Model: BUY as of 5/8/2020
LT Trend Model: BUY as of 6/8/2020
SPY Daily Chart: Although we did not get an "official" top today (a new intraday all-time high was logged), I have to say price action is beginning to look "toppy". We did get an upside breakout out of a bearish rising wedge which is particularly bullish, however it appears this short-term rally might be losing steam. This brings us to the VIX. Readings have been getting very high again. On our inverted scale, we can see a puncture of the lower Band which is generally considered a bullish sign. When everyone gets fearful to an extreme, that is usually the earmark of a reversal. Carl pointed out in today's DecisionPoint Show that the range of today's VIX nearly punctured the upper Band as well. This is the problem we have when those Bollinger Bands are squeezed so tightly together. Those Bands only unpack when volatility increases...that generally occurs on a decline.
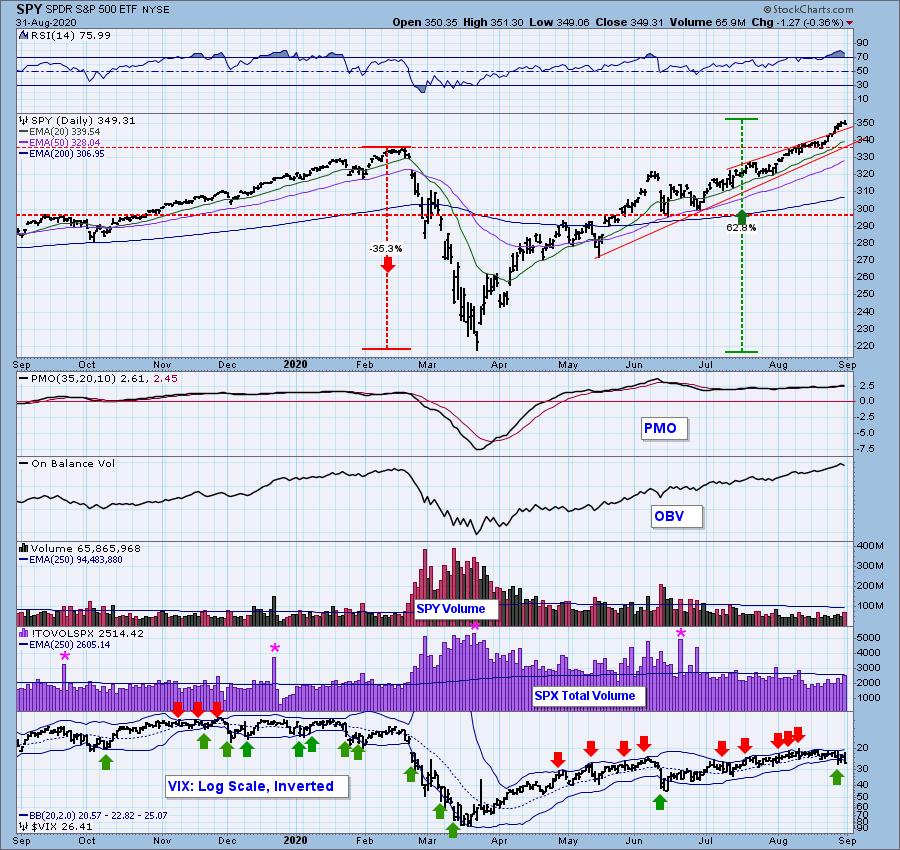
Climactic Market Indicators: Breadth was somewhat climactic to the downside. This could be an indication of a selling initiation. You'll also note that New Highs are beginning to contract. Add that to the VIX closing on a high and I see a recipe for a decline.
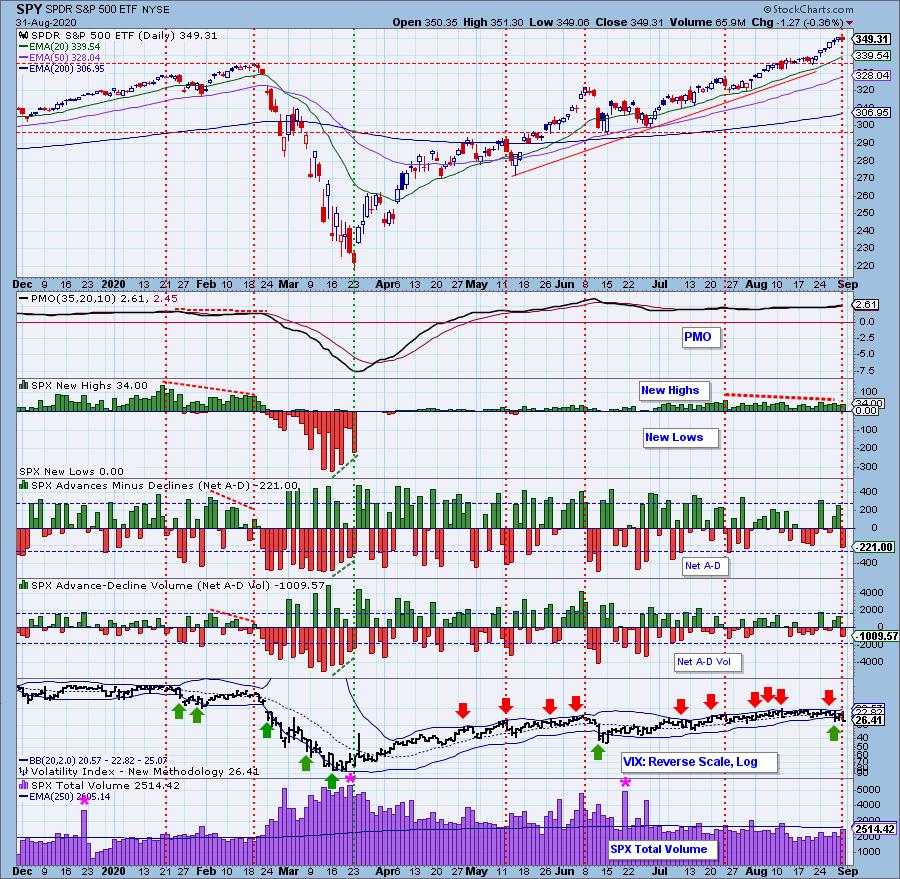
Short-Term Market Indicators: The short-term market trend is UP and the condition is NEUTRAL. Based upon the STO ranges, market bias is NEUTRAL. The STOs turned down today. I considerate it a short-term warning. Also notice that participation continues to contract as more stocks are losing support at their 20-EMAs and more stocks are shifting from positive momentum to negative momentum.
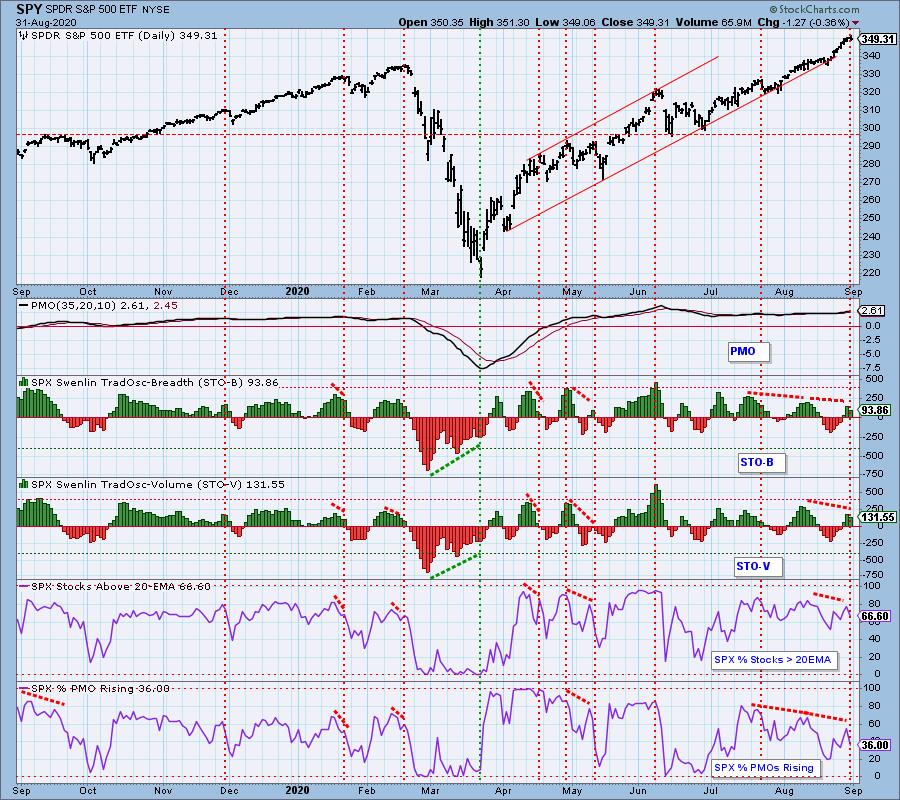
Intermediate-Term Market Indicators: The following chart uses different methodologies for objectively showing the depth and trend of participation for intermediate- and long-term time frames.
- The Silver Cross Index (SCI) shows the percentage of SPX stocks on IT Trend Model BUY signals (20-EMA > 50-EMA).
- The Golden Cross Index (GCI) shows the percentage of SPX stocks on LT Trend Model BUY signals (50-EMA > 200-EMA).
- The Bullish Percent Index (BPI shows the percentage of SPX stocks on Point & Figure BUY signals.
The BPI continues up after a positive crossover which is bullish. However, both the SCI and GCI are declining. In any case, negative divergences persist.
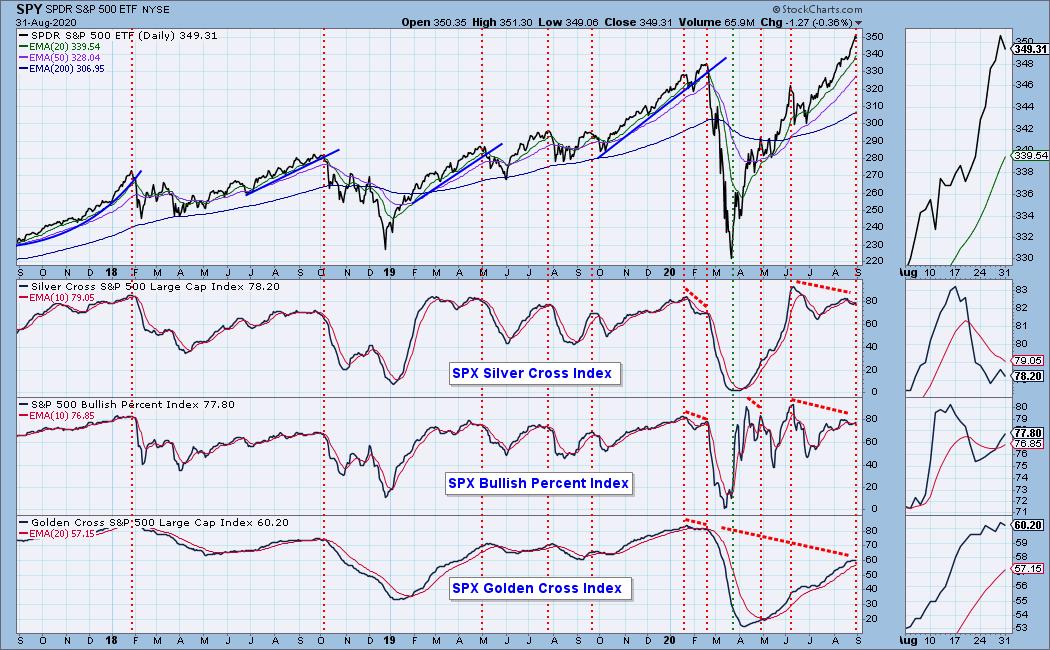
The intermediate-term market trend is UP and the condition is NEUTRAL. With most of the ITBM/ITVM readings since the end of April being above the zero lines, the market bias is BULLISH.
We had finally found consensus between the ITBM and ITVM on Friday as they both rose. However, we're back to seeing the ITBM and ITVM diverge. I read that as neutral. Notice that % PMO BUY Signals is falling which is another show of weakness in participation.
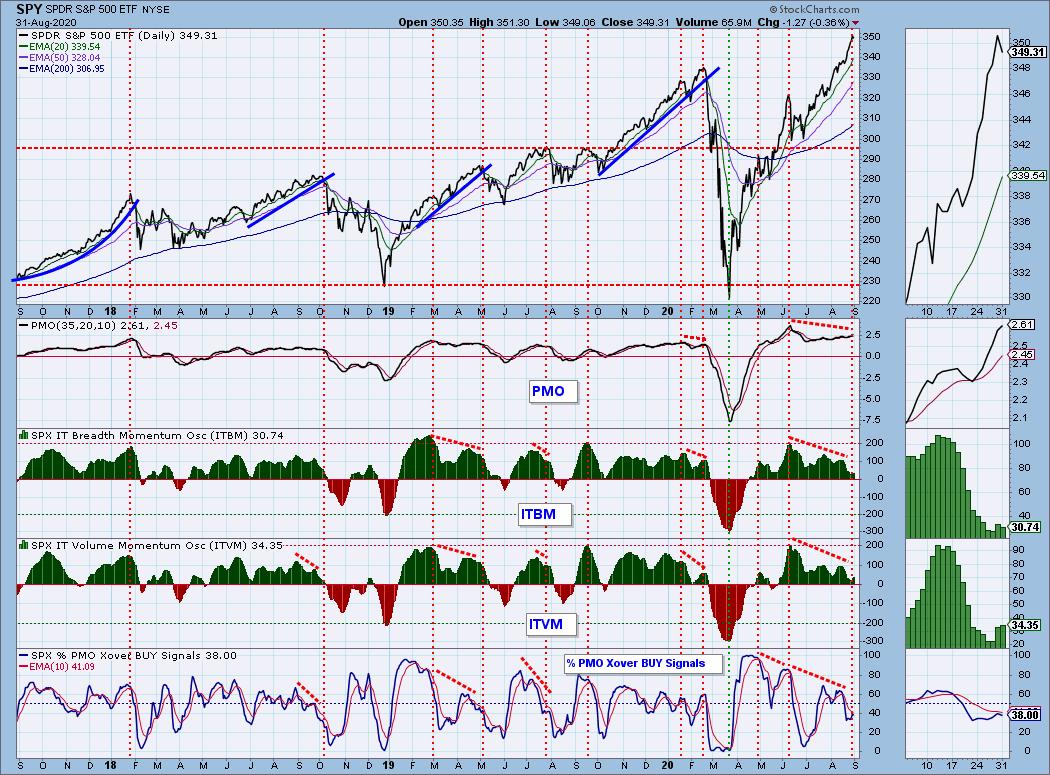
CONCLUSION: Price is acting 'toppy' and the indicators are suggesting that a wall of fear is building. I am not bullish on the market right now. This doesn't mean I'm moving completely to cash (as I did part way down the bear market crash), it means that I am making sure I have reasonable stops in place as protection against an inevitable pullback or correction.
DOLLAR (UUP)
IT Trend Model: NEUTRAL as of 5/28/2020
LT Trend Model: SELL as of 7/10/2020
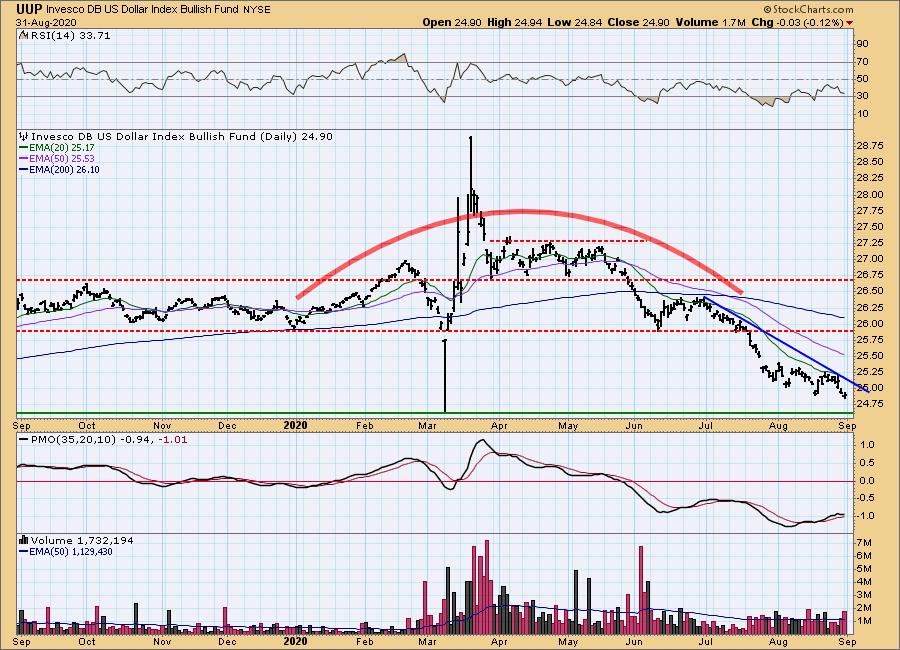
UUP Daily Chart: Despite a recent PMO BUY signal and ascent, the Dollar has done nothing but edge lower. The RSI is negative (not oversold) and the PMO has topped. Next area of support is at the March intraday low. Until I see the declining trendline broken, I'll remain bearish on the Dollar (UUP).
GOLD
IT Trend Model: BUY as of 3/24/2020
LT Trend Model: BUY as of 1/8/2019
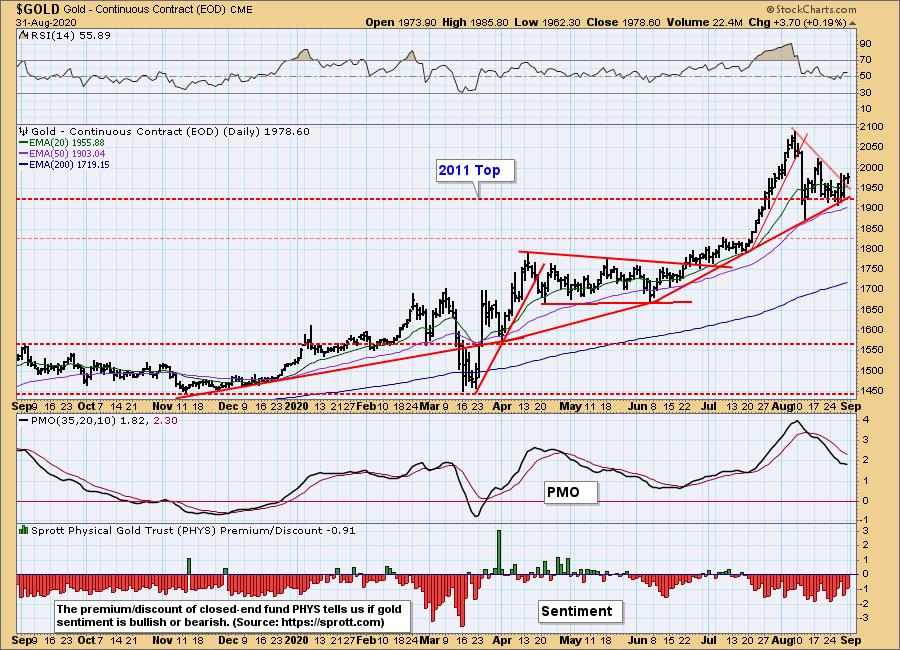
GOLD Daily Chart: Not much action on Gold. It looks like it is going to break to the upside out of the symmetrical triangle. That triangle is a continuation pattern, so the likely resolution is an upside breakout. The RSI has stayed in positive territory and the PMO has now decelerated its descent. I like Gold.
Full Disclosure: I own GLD.
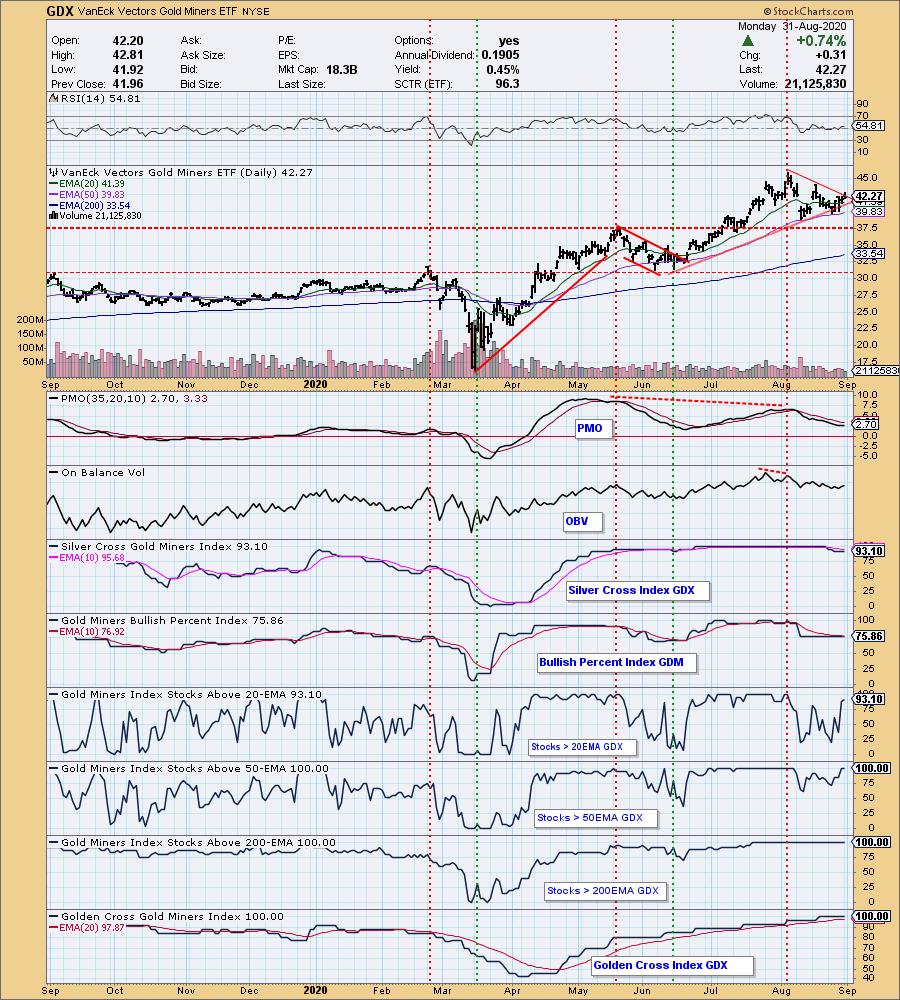
GOLD MINERS Golden and Silver Cross Indexes: Miners are trying to breakout of their symmetrical triangle. The GDX PMO is beginning to rise. The RSI is positive and we are seeing an increase in participation among the components of GDX. I am bullish Miners.
CRUDE OIL (USO)
IT Trend Model: BUY as of 8/13/2020
LT Trend Model: SELL as of 2/3/2020
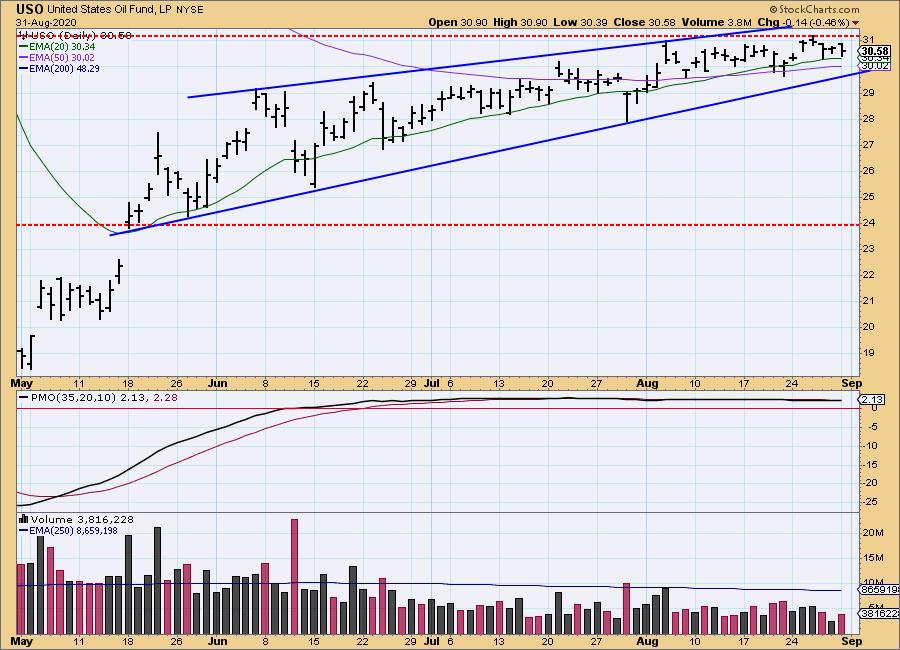
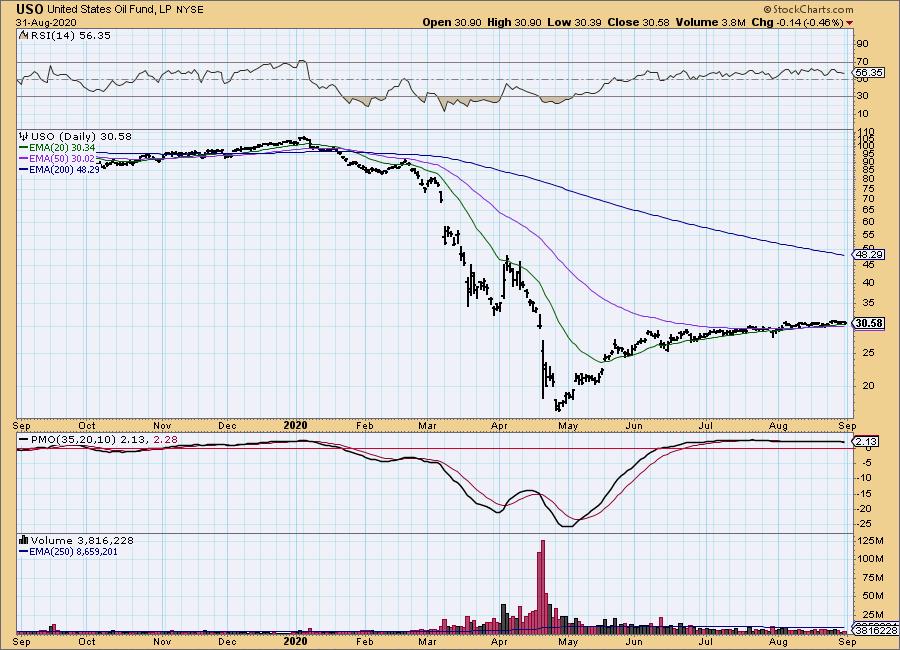
USO Daily Chart: I've moved to a 4-month chart for USO because it is impossible to decipher price movement on the one-year daily (even on a log chart). At this point, price is in a bearish rising wedge. The good news is it is holding onto support at the 20/50-EMAs and we did get that IT Trend Model BUY signal this month.
BONDS (TLT)
IT Trend Model: Neutral as of 8/27/2020
LT Trend Model: BUY as of 1/2/2019
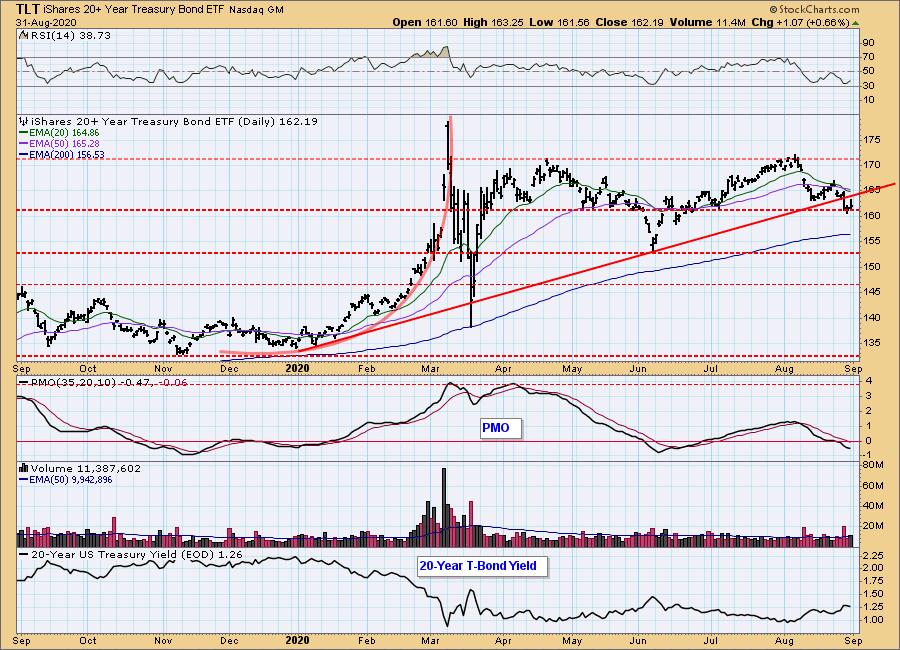
TLT Daily Chart: We did get that IT Trend Model Neutral signal last week and it came alongside a breakdown of the longer-term rising trend. At this point support is holding and the PMO is decelerating somewhat. The RSI is still negative, but is rising. I'm not bullish on TLT, but there are a few signs of life.
Full disclosure: I own TLT.
Have you subscribed the DecisionPoint Diamonds yet? DP does the work for you by providing handpicked stocks/ETFs from exclusive DP scans! Get in on the new "DecisionPoint Diamond Mine" trading room as part of that subscription! Contact support@decisionpoint.com for more information!
Technical Analysis is a windsock, not a crystal ball.
Happy Charting! - Erin
Email: erin@decisionpoint.com
NOTE: The signal status reported herein is based upon mechanical trading model signals, specifically, the DecisionPoint Trend Model. They define the implied bias of the price index based upon moving average relationships, but they do not necessarily call for a specific action. They are information flags that should prompt chart review. Further, they do not call for continuous buying or selling during the life of the signal. For example, a BUY signal will probably (but not necessarily) return the best results if action is taken soon after the signal is generated. Additional opportunities for buying may be found as price zigzags higher, but the trader must look for optimum entry points. Conversely, exit points to preserve gains (or minimize losses) may be evident before the model mechanically closes the signal.
Helpful DecisionPoint Links (Can Be Found on DecisionPoint.com Links Page):
DecisionPoint Shared ChartList and DecisionPoint Chart Gallery
Price Momentum Oscillator (PMO)