
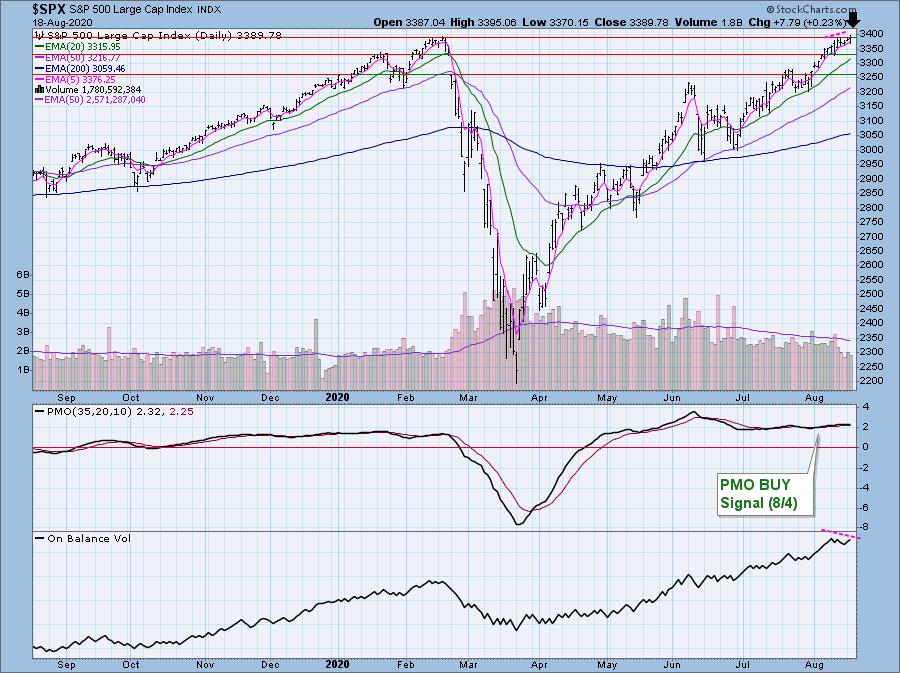
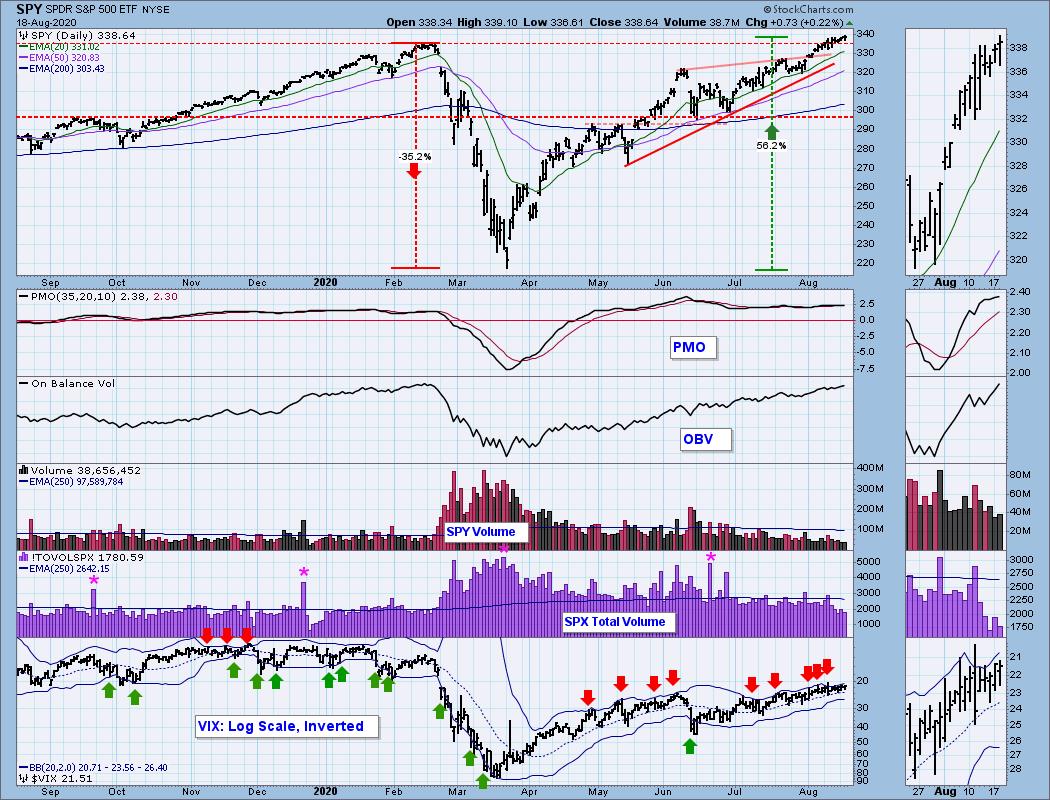
The big news is that the SPX finally closed on a new all-time high after six months. While the business news networks were celebrating this loudly, underneath the surface I noted several serious problems, especially given today's historic milestone. Let's start with the negative divergence on the OBV right now on the daily SPX chart below.
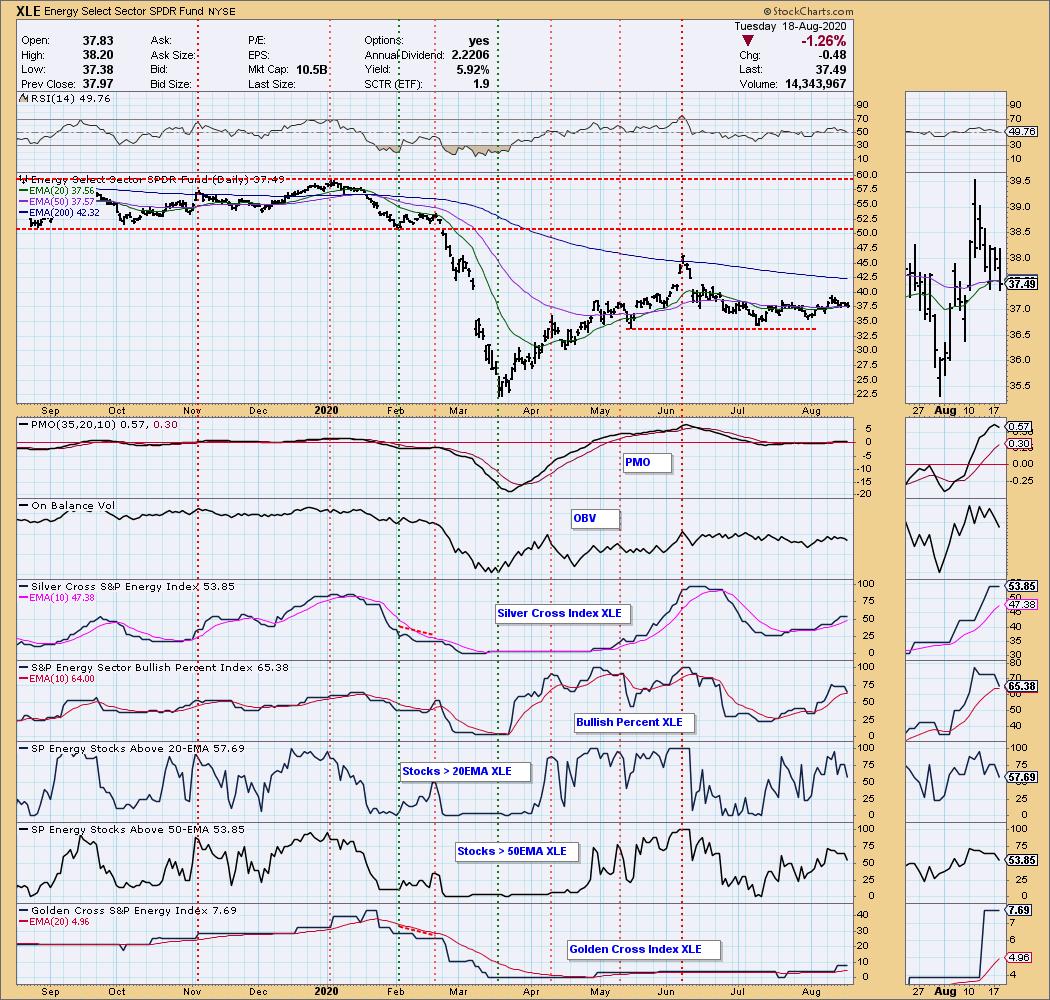
Also, I want to note that the Energy SPDR (XLE) did not have the "silver cross" we had been expecting as price dipped below the 20-EMA and prevented it from crossing above the 50-EMA.

Don't forget Diamonds-subscribers! The DecisionPoint "Diamond Mine" will be open THIS Friday, August 21st exclusively for you! Bring your questions and symbol requests as we dive into the Diamonds of the week and search for what setups are out there for Monday! Registration links will be sent out on Wednesday!
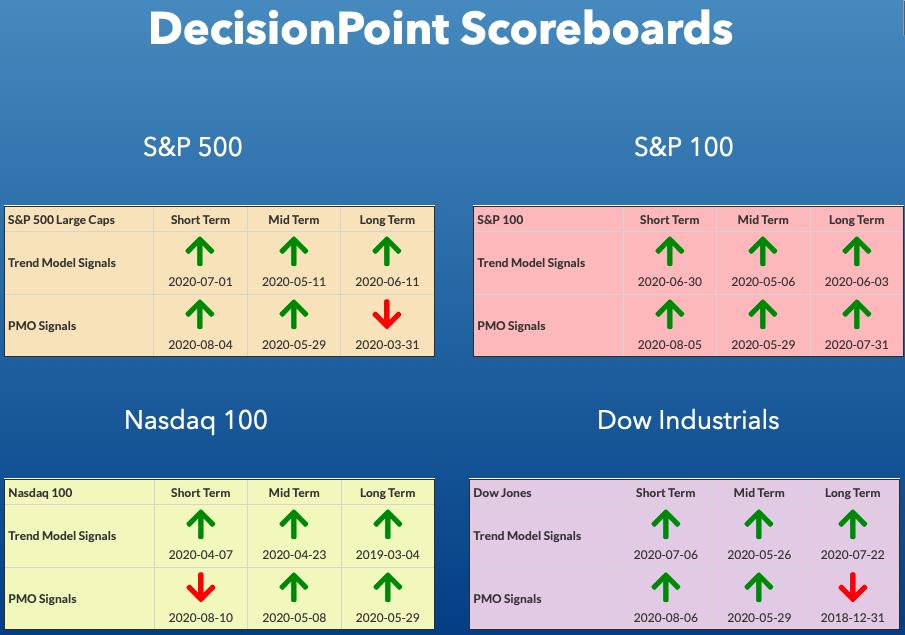
DP INDEX SCOREBOARDS:
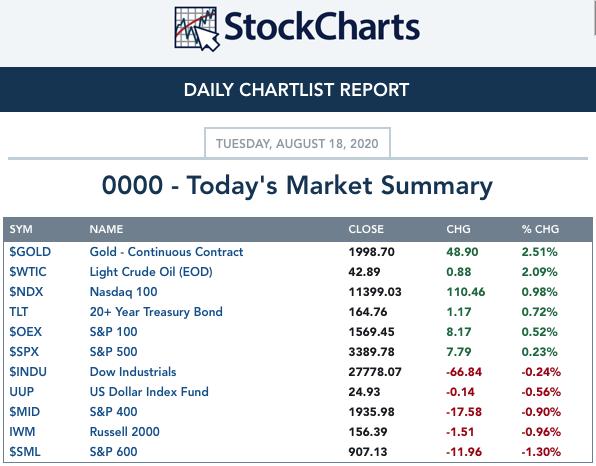
TODAY'S Broad Market Action:
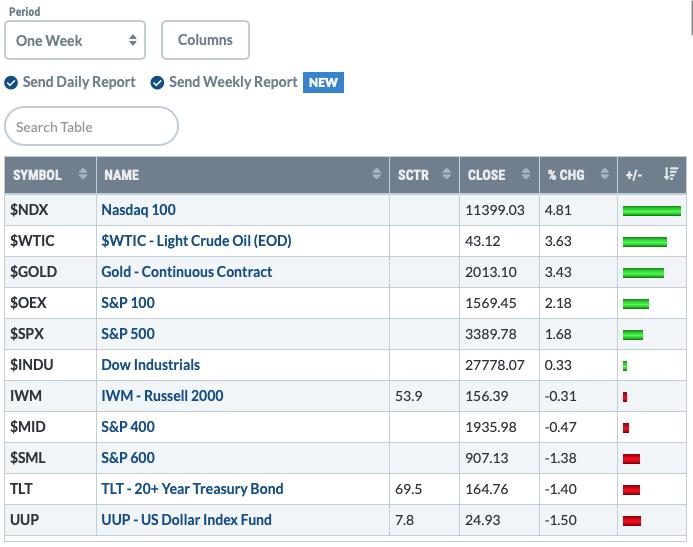
One WEEK Results:
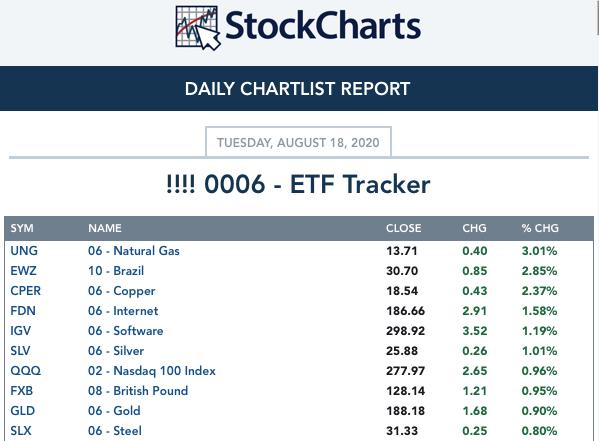
Top 10 from ETF Tracker:
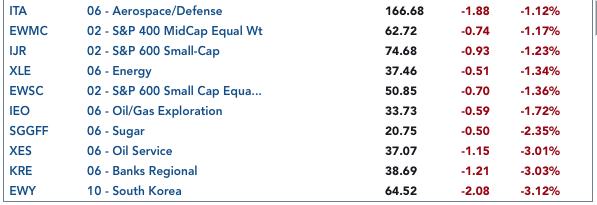
Bottom 10 from ETF Tracker:
On Friday, the DecisionPoint Alert Weekly Wrap presents an assessment of the trend and condition of the stock market (S&P 500), the U.S. Dollar, Gold, Crude Oil, and Bonds. Monday through Thursday the DecisionPoint Alert daily report is abbreviated and covers changes for the day.
Watch the latest episode of DecisionPoint on StockCharts TV's YouTube channel here!
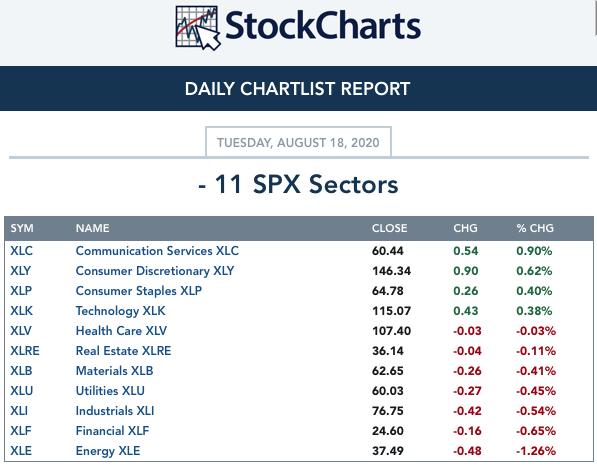
SECTORS
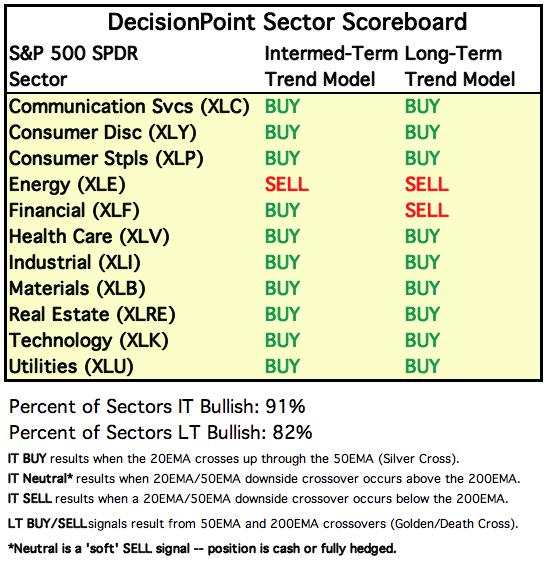
SIGNALS:
Each S&P 500 Index component stock is assigned to one, and only one, of 11 major sectors. This is a snapshot of the Intermediate-Term (Silver Cross) and Long-Term (Golden Cross) Trend Model signal status for those sectors.
TODAY'S RESULTS:
One WEEK Results: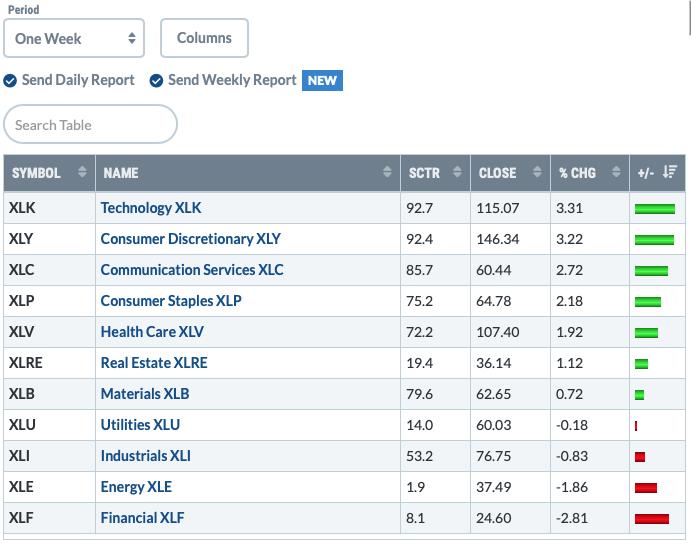
STOCKS
IT Trend Model: BUY as of 5/8/2020
LT Trend Model: BUY as of 6/8/2020
SPY Daily Chart: The SPY hit all-time highs last week. Unlike the SPX, there isn't the same negative divergence between price tops and OBV tops. Volume remains well below the annual average. The PMO wants to top, but just hasn't quite been able to.
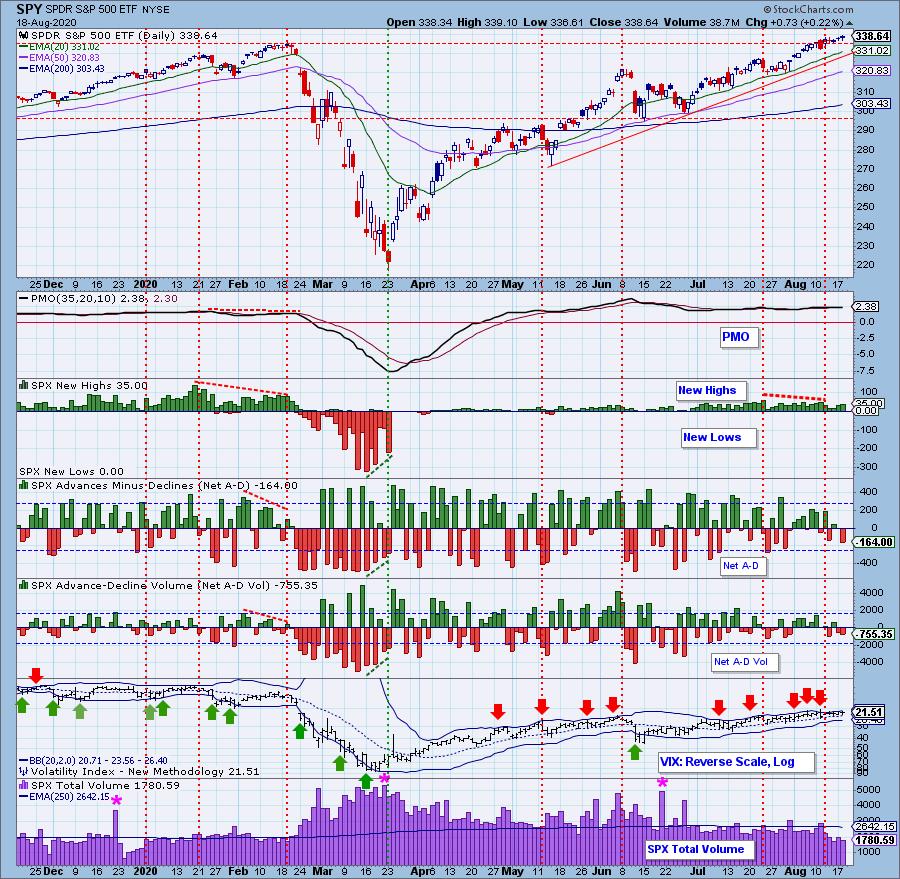
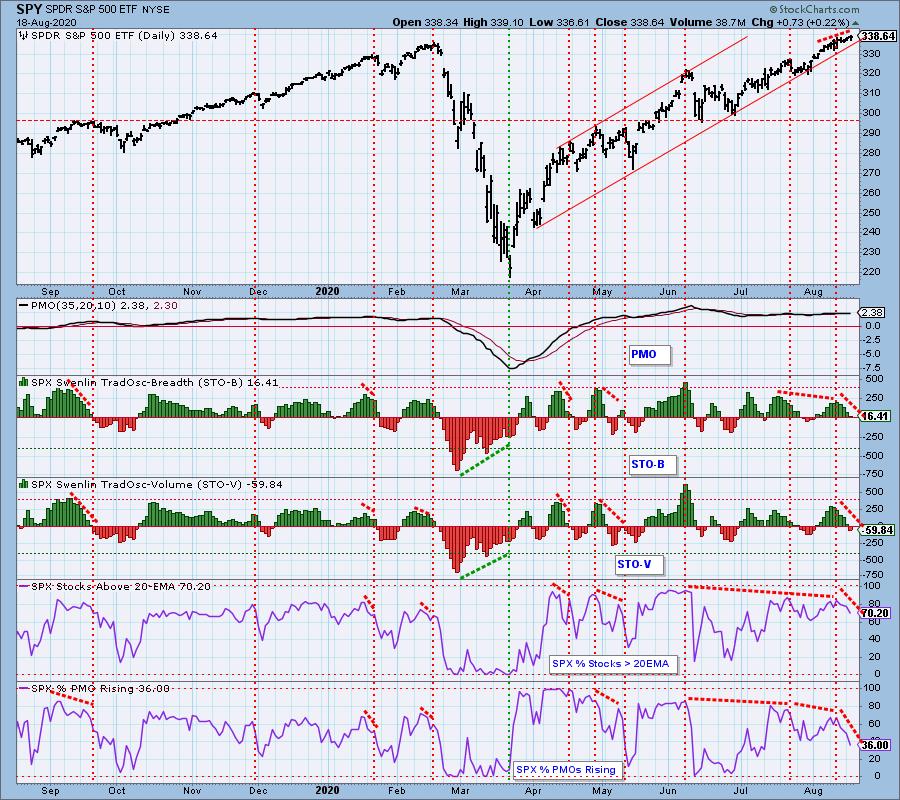
Climactic Market Indicators: Here's where the indicator problems begin. Seeing the negative somewhat climactic numbers on Net A-D and Net A-D (Volume) on a day where we hit a new all-time high is not good. It smells of a buying exhaustion or selling initiation climax. It was positive to see more New Highs and the VIX remains comfortable above its moving average and beneath the upper Bollinger Band on the inverted scale.
Short-Term Market Indicators: The short-term market trend is UP and the condition is NEUTRAL. Based upon the STO ranges, market bias is NEUTRAL. Yesterday these indicators declined on the rally. They are continuing that descent right alongside the %Stocks indicators. The negative divergences here are stark.
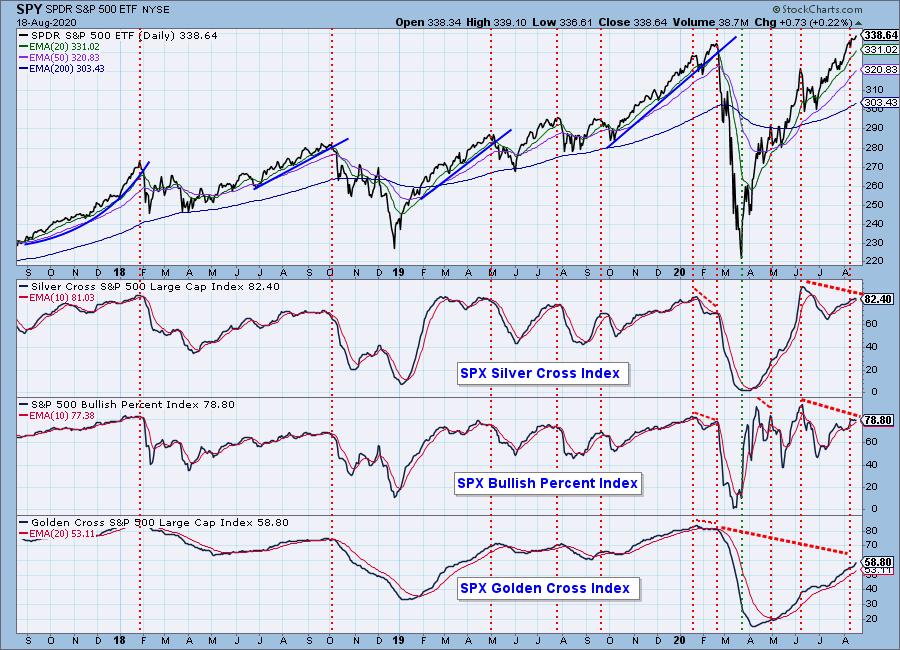
Intermediate-Term Market Indicators: The following chart uses different methodologies for objectively showing the depth and trend of participation for intermediate- and long-term time frames.
- The Silver Cross Index (SCI) shows the percentage of SPX stocks on IT Trend Model BUY signals (20-EMA > 50-EMA).
- The Golden Cross Index (GCI) shows the percentage of SPX stocks on LT Trend Model BUY signals (50-EMA > 200-EMA).
- The Bullish Percent Index (BPI shows the percentage of SPX stocks on Point & Figure BUY signals.
Negative divergences persist on the intermediate-term indicators as well with both the SCI and BPI topping. Technically the GCI is still rising and could erase the negative divergence, but given the activity of the other two, I don't see that as a possibility.
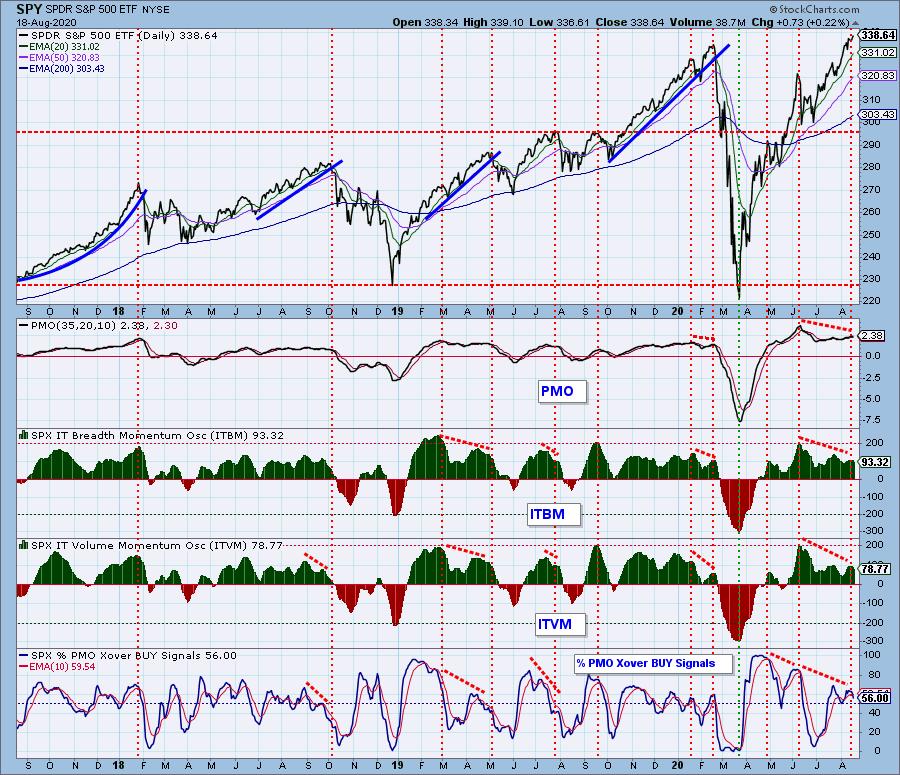
The intermediate-term market trend is UP and the condition is OVERBOUGHT. With most of the ITBM/ITVM readings since the end of April being above the zero lines, the market bias is BULLISH.
These indicators continue to fall and are just more in a long line of negative divergences.
CONCLUSION: New all-time highs for the SPX was the big news, but under the surface there are numerous negative divergences. Seeing somewhat climactic negative breadth on a rally to new highs is also suspicious. I remain bearish on the market. My stops are trailing or tighter since despite all of the signs that a pullback or correction is near, the market continues higher. I want to eke out as much profit as I can.
DOLLAR (UUP)
IT Trend Model: NEUTRAL as of 5/28/2020
LT Trend Model: SELL as of 7/10/2020
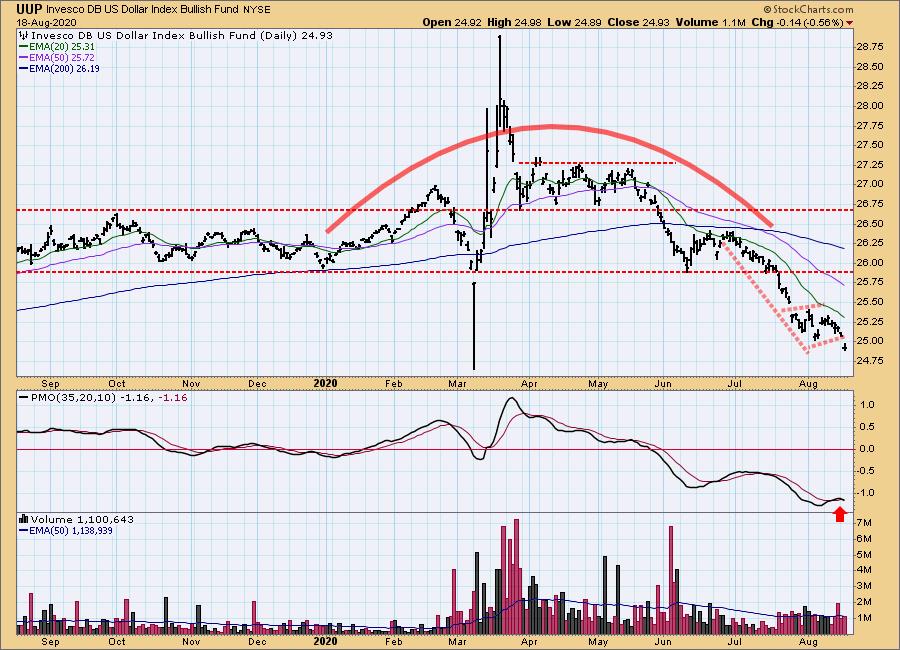
UUP Daily Chart: The table couldn't have been set any better for the Dollar to rally with a reverse head and shoulders, reverse island and PMO BUY signal. I mentioned yesterday:
Instead of a reverse island, we could be looking at a bearish reverse flag.
Well here we are with a giant gap down and out of what could be considered a bearish flag. The PMO triggered a SELL signal today. The low from the March spike would be the next level of support.
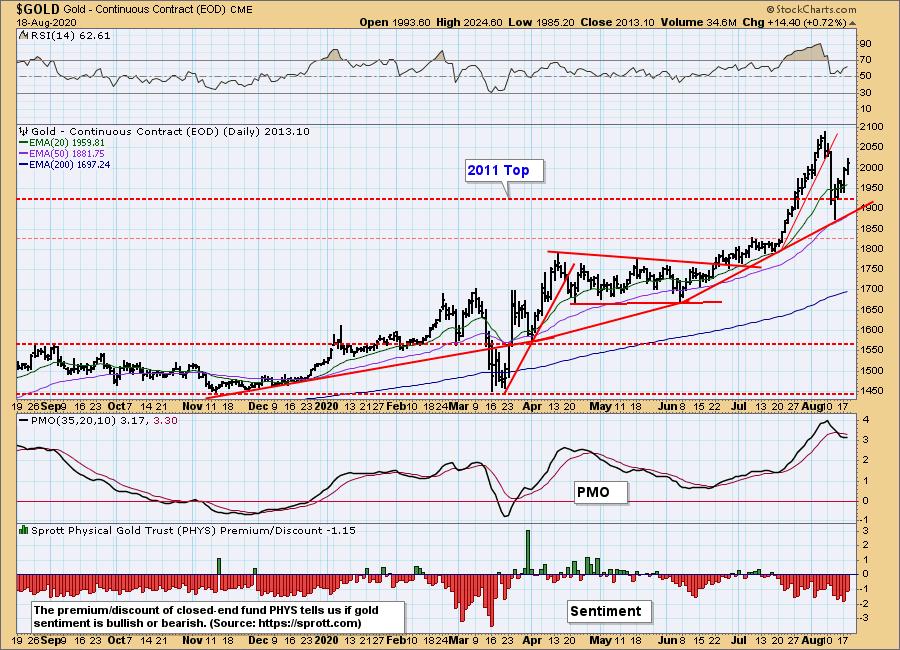
GOLD
IT Trend Model: BUY as of 3/24/2020
LT Trend Model: BUY as of 1/8/2019
GOLD Daily Chart: I like Gold off this pullback that took price to the 50-EMA and rising bottoms trendline. Since then it has rallied strongly. The RSI is positive and not overbought anymore. The discounts on PHYS have lowered somewhat but overall seeing discounts is bullish for Gold.
Full Disclosure: I own GLD.
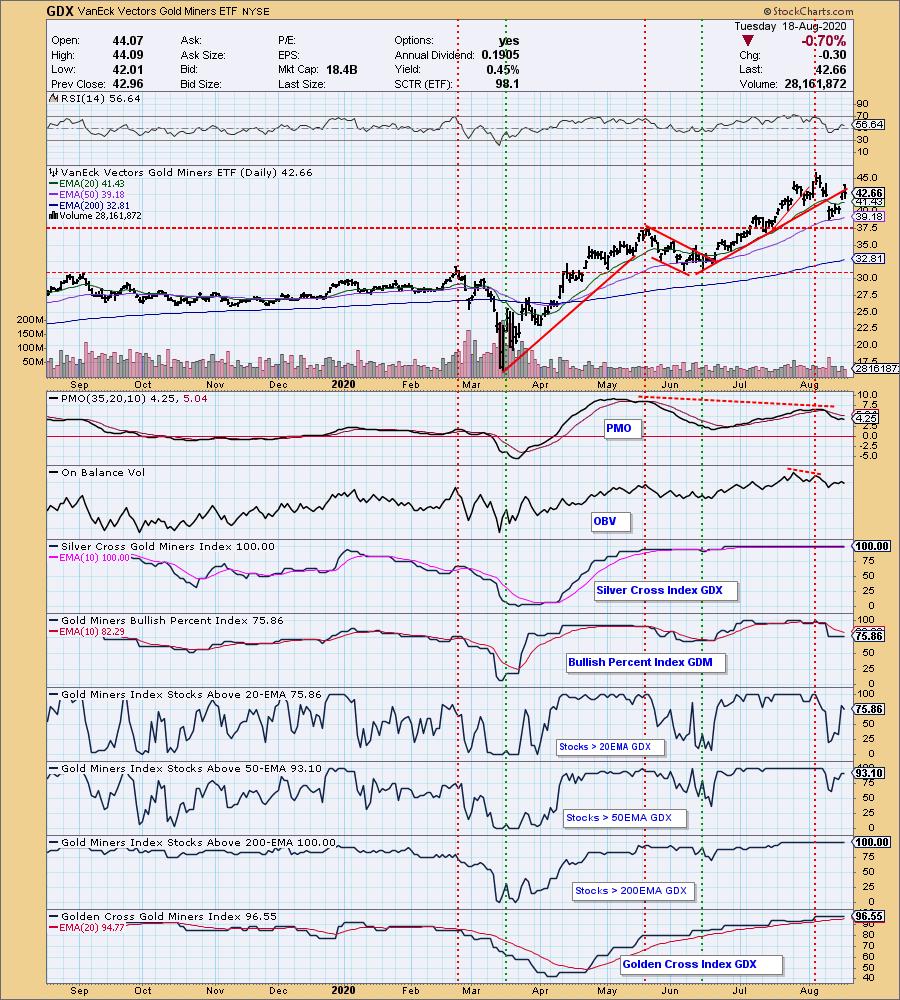
GOLD MINERS Golden and Silver Cross Indexes: I recently purchased Yamana Gold (AUY) and the DP "Diamond of the Week" was Wheaten Precious Metals (WPM). This area of the market is getting hot again. The RSI just reached positive territory and the PMO is trying to turn back up. The previous rising trend hasn't been captured yet, but I expect it to. Notice the improvement on the indicators even on a down day (far different from the SPX/SPY right now).
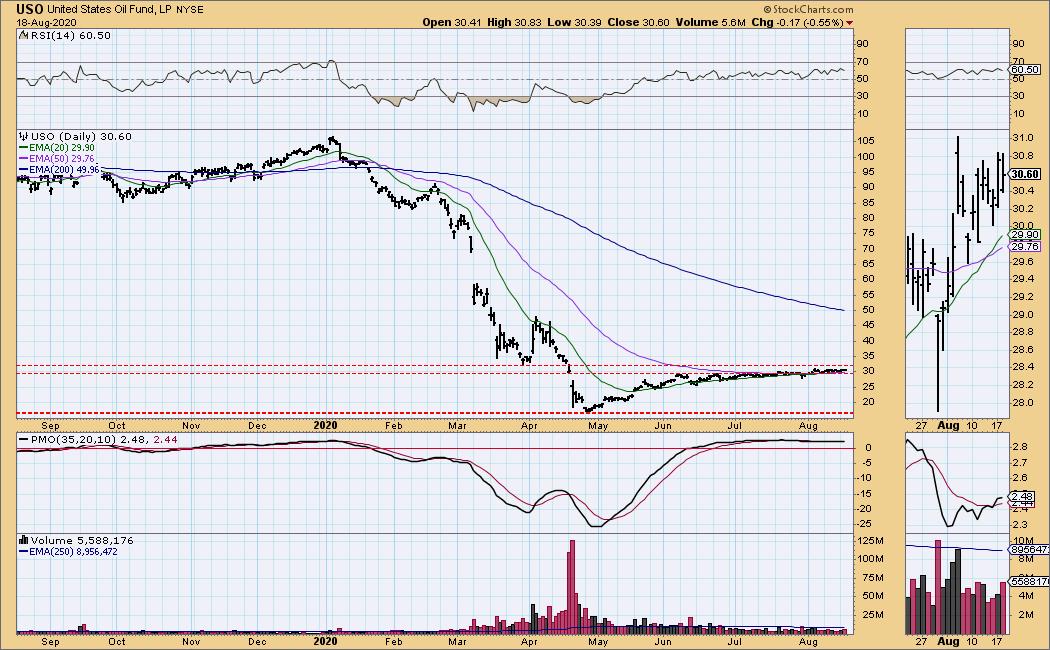
CRUDE OIL (USO)
IT Trend Model: BUY as of 8/13/2020
LT Trend Model: SELL as of 2/3/2020
USO Daily Chart: It's rather hard to see much on this USO chart. Mainly I want to note the possible bull flag in the thumbnail and the squeeze between the 20/50-EMAs and the March low. I don't see it breaking out of here just yet, but I have to say the RSI and PMO look pretty good.
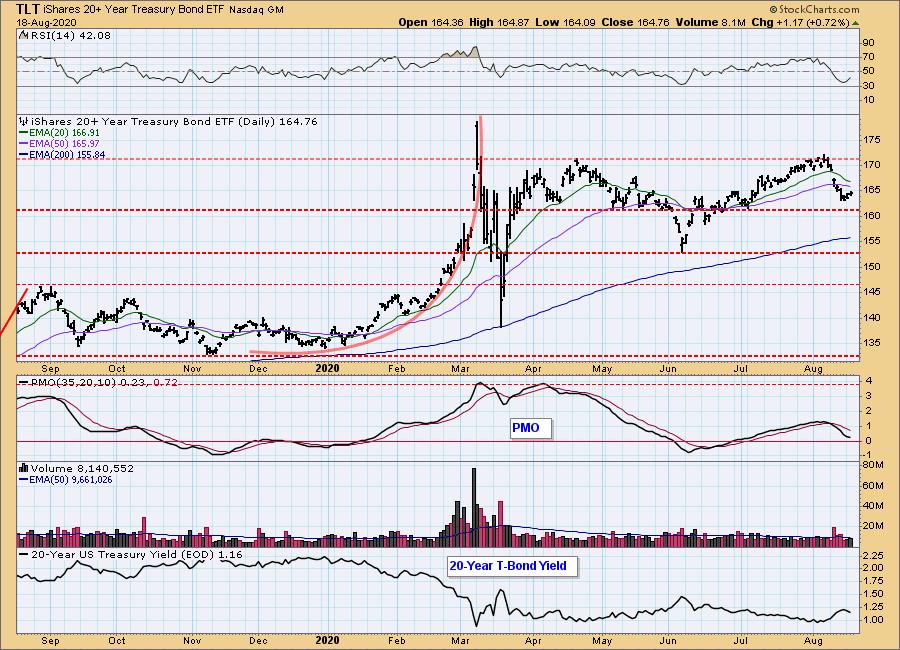
BONDS (TLT)
IT Trend Model: BUY as of 6/26/2020
LT Trend Model: BUY as of 1/2/2019
TLT Daily Chart: Yesterday's comments still apply:
"Bonds finished on the positive side today and the PMO is already attempting to decelerate and possibly bottom above the zero line. The RSI is negative, but turning back up. I like this area as an upside reversal point for TLT, but I'm also keeping watch for a possible reverse flag formation here."
Full disclosure: I own TLT.
Have you subscribed the DecisionPoint Diamonds yet? DP does the work for you by providing handpicked stocks/ETFs from exclusive DP scans! Get in on the new "DecisionPoint Diamond Mine" trading room as part of that subscription! Contact support@decisionpoint.com for more information!
Technical Analysis is a windsock, not a crystal ball.
Happy Charting! - Erin
Email: erin@decisionpoint.com
My MoneyShow Presentation is TOMORROW!
I present on August 19th at 1:20p EST!
Click here for information on how to register to see me!

NOTE: The signal status reported herein is based upon mechanical trading model signals, specifically, the DecisionPoint Trend Model. They define the implied bias of the price index based upon moving average relationships, but they do not necessarily call for a specific action. They are information flags that should prompt chart review. Further, they do not call for continuous buying or selling during the life of the signal. For example, a BUY signal will probably (but not necessarily) return the best results if action is taken soon after the signal is generated. Additional opportunities for buying may be found as price zigzags higher, but the trader must look for optimum entry points. Conversely, exit points to preserve gains (or minimize losses) may be evident before the model mechanically closes the signal.
Helpful DecisionPoint Links (Can Be Found on DecisionPoint.com Links Page):
DecisionPoint Shared ChartList and DecisionPoint Chart Gallery
Price Momentum Oscillator (PMO)