
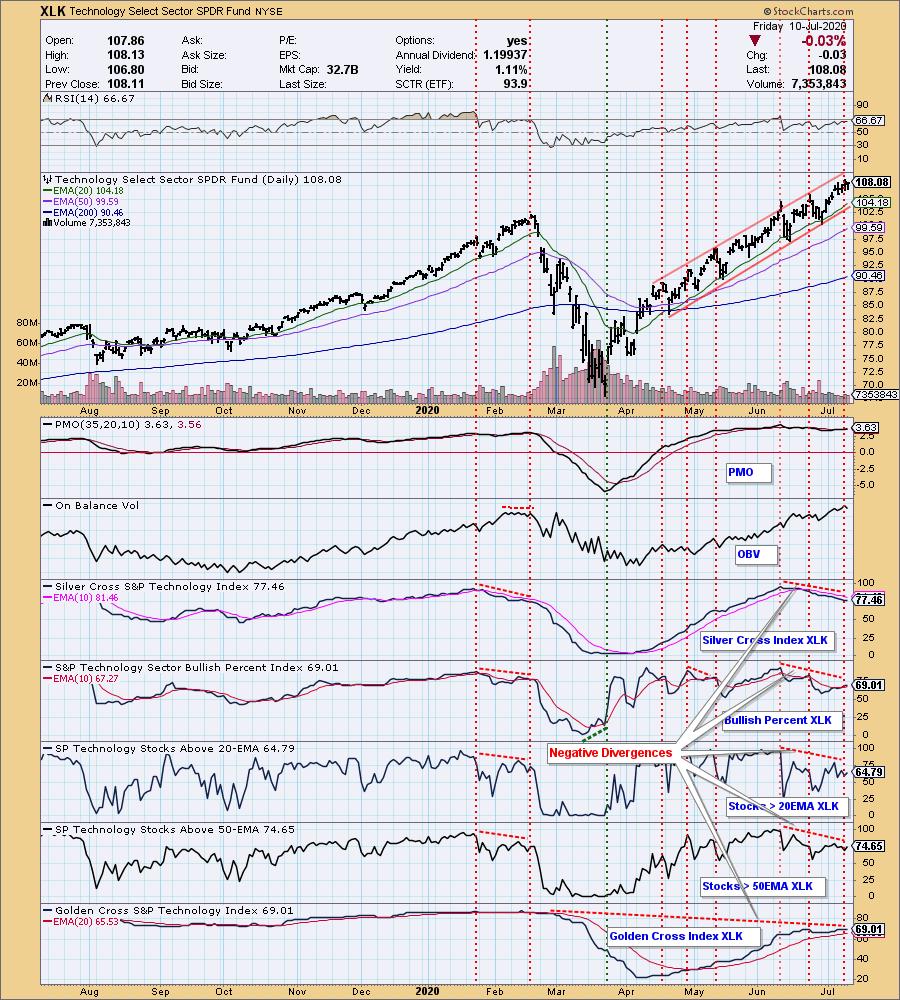
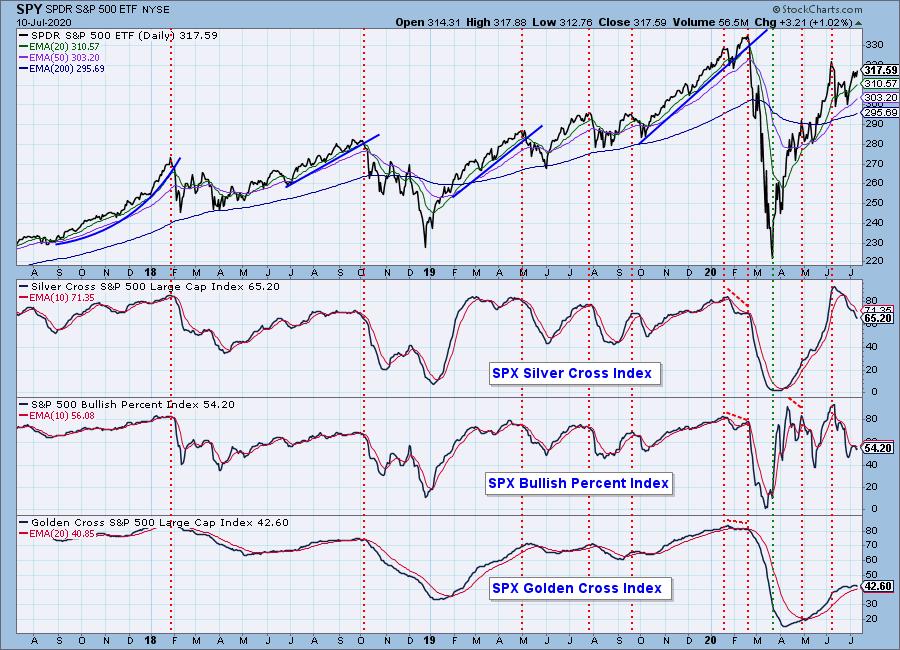
The Technology Sector is still leading the market, but participation within that sector is beginning to fade considerably from the levels measured at the market top on June 10:
- The Silver Cross Index, which shows the percent of stocks with the 20EMA above the 50EMA, is down -20%.
- The Bullish Percent Index, (percent of stocks with P&F BUY signals), is down -26%.
- The Percent Stocks Above 20EMA is down -42%!
- The Percent Stocks Above 50EMA is down -30%.
- The Golden Cross Index (percent of stocks with 50EMA above 200EMA) is down -21%.
On the chart you can see that these divergences materialized between the June 10 top and the June 23 top, and at that point you'll notice that a short pullback took place. The divergences have only become deeper since then, so another pullback is likely. There were similar negative divergences ahead to the February top, although they were not as severe as what we have now, so corrective action could be considerably more severe than what we saw after the June 23 top.
The DecisionPoint Alert Weekly Wrap presents an end-of-week assessment of the trend and condition of the Stock Market, the U.S. Dollar, Gold, Crude Oil, and Bonds. The DecisionPoint Alert daily report (Monday through Thursday) is abbreviated and gives updates on the Weekly Wrap assessments.
Watch the latest episode of DecisionPoint on StockCharts TV's YouTube channel here!
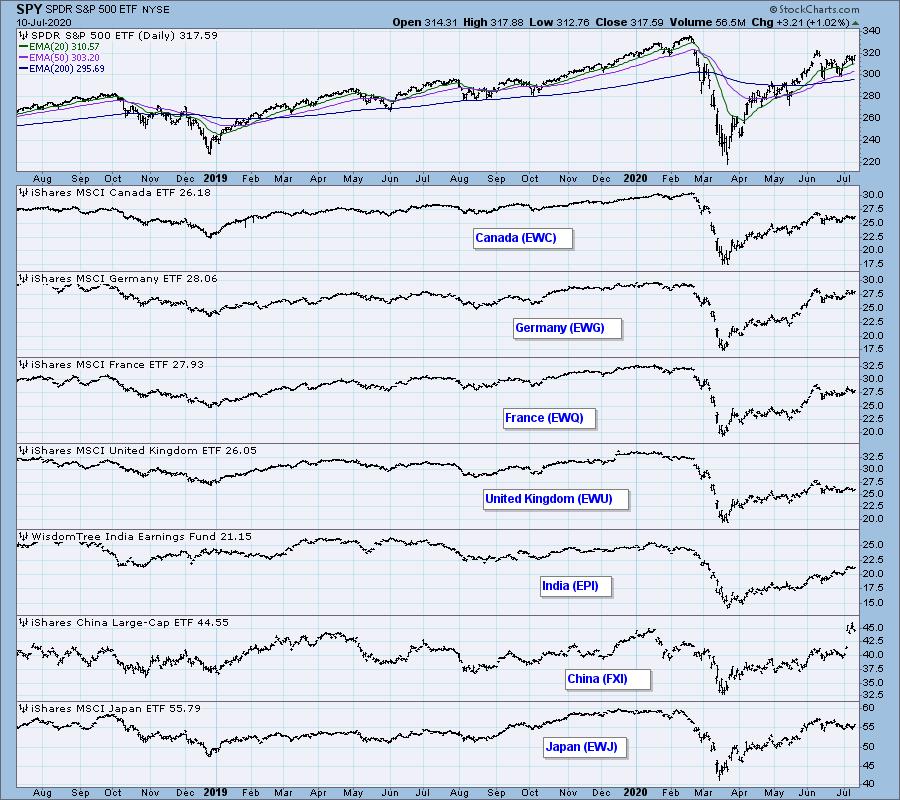
GLOBAL MARKETS
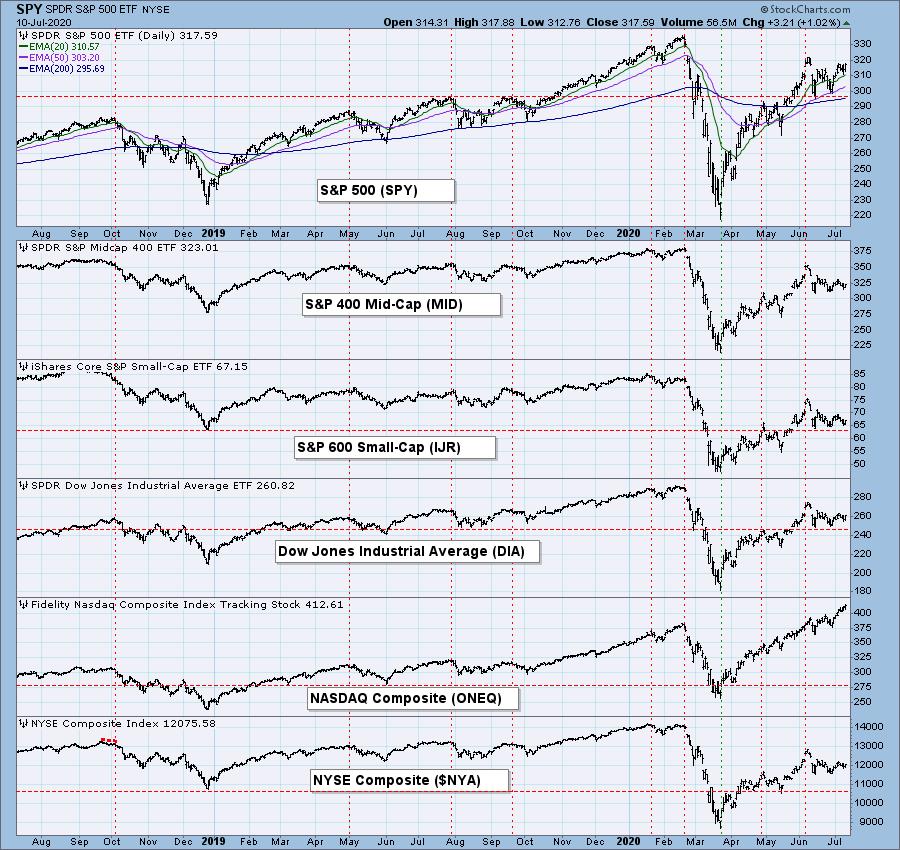
BROAD MARKET INDEXES
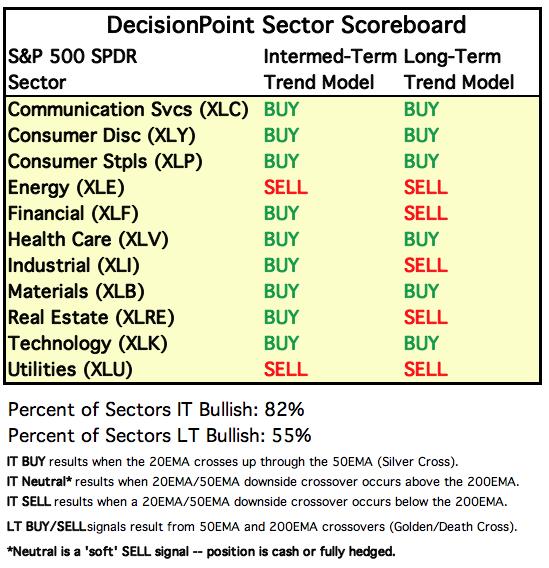
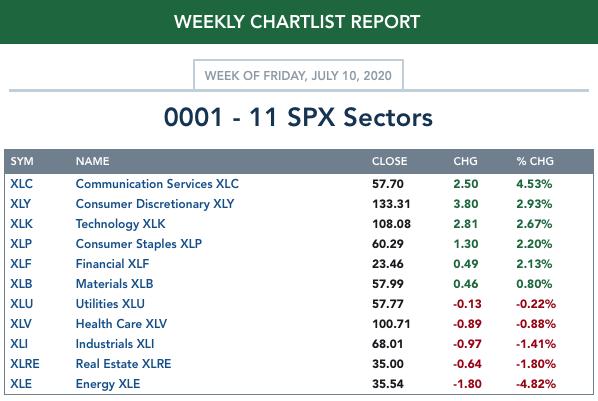
SECTORS
Each S&P 500 Index component stock is assigned to one, and only one, of 11 major sectors. This is a snapshot of the Intermediate-Term (Silver Cross) and Long-Term (Golden Cross) Trend Model signal status for those sectors.
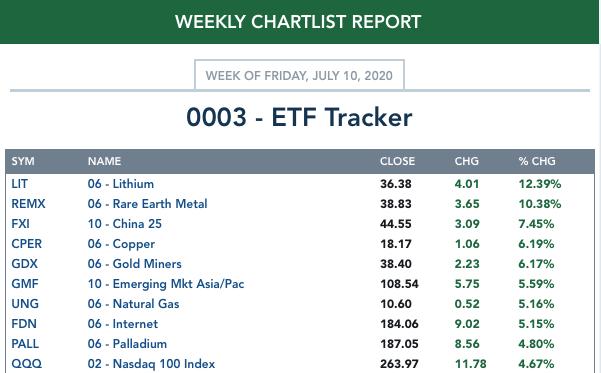
ETF TRACKER: This is a list of about 100 ETFs intended to track a wide range of U.S. market indexes, sectors, global indexes, interest rates, currencies, and commodities. StockCharts.com subscribers can acquire it in the DecisionPoint Trend and Condition ChartPack.
Top 10 . . .
. . . and bottom 10: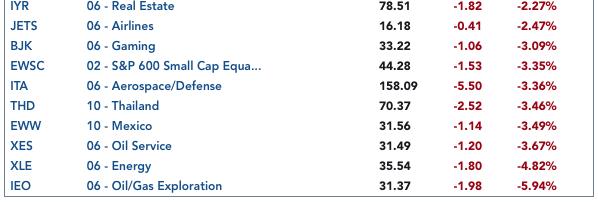
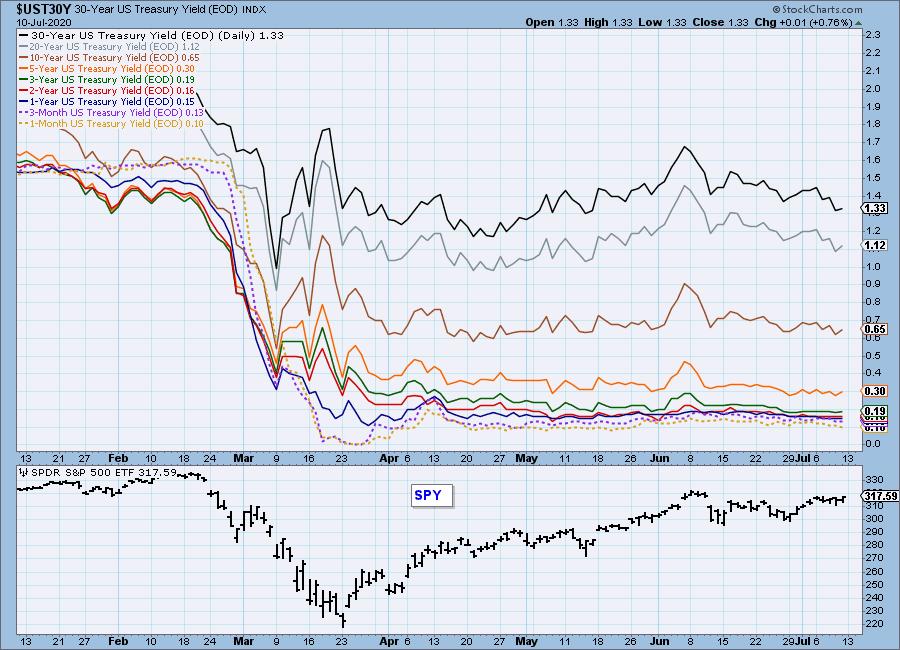
INTEREST RATES
This chart is included so we can monitor rate inversions. In normal circumstances the longer money is borrowed the higher the interest rate that must be paid. When rates are inverted, the reverse is true.
STOCKS
IT Trend Model: BUY as of 5/8/2020
LT Trend Model: BUY as of 6/8/2020
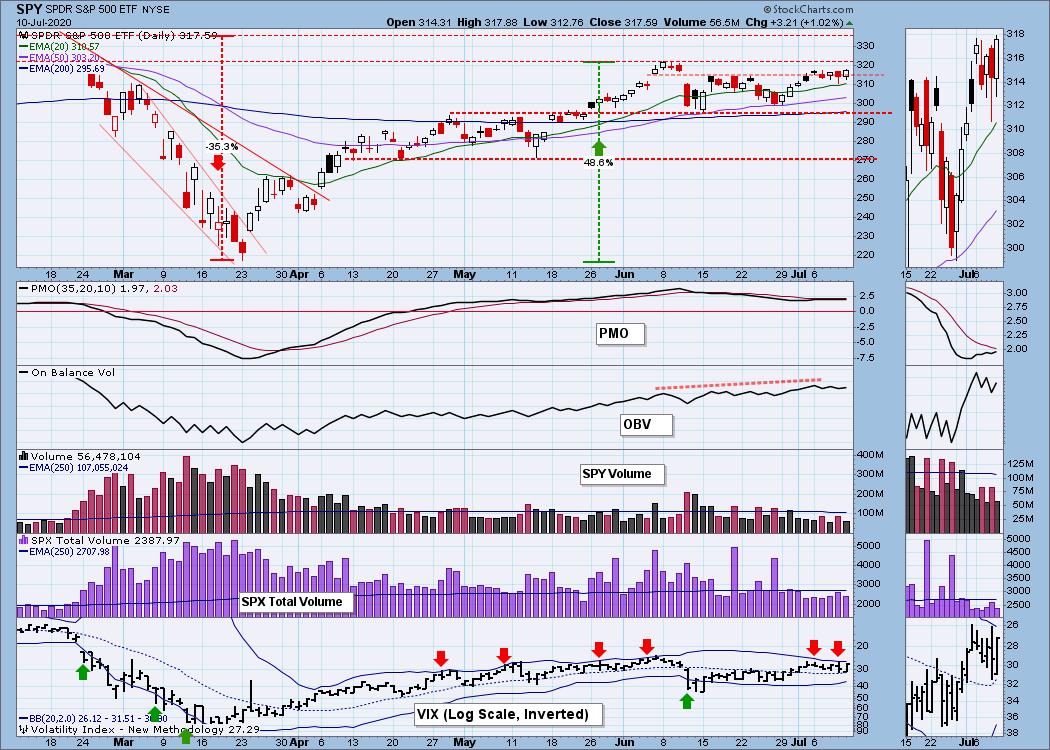
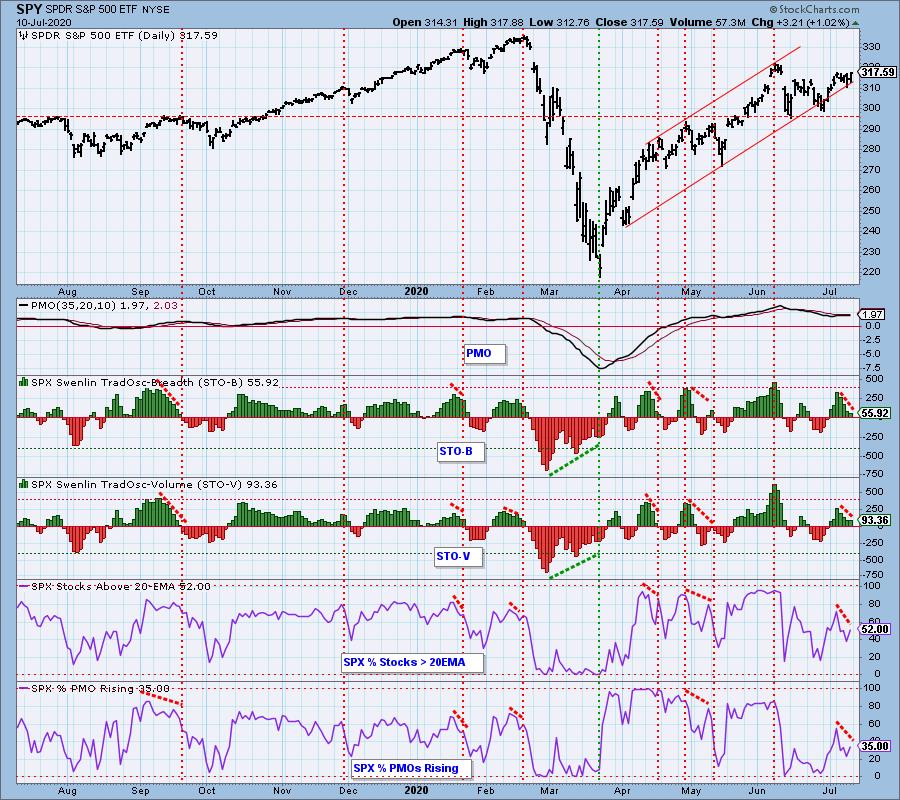
SPY Daily Chart: The market has been in a trading range for seven weeks. The daily PMO has been relatively flat since May, but we can see it is topping below the signal line, a negative configuration. There is an OBV reverse divergence between the June top and the most recent top. The VIX has been crowding the top Bollinger Band for a week (overbought).
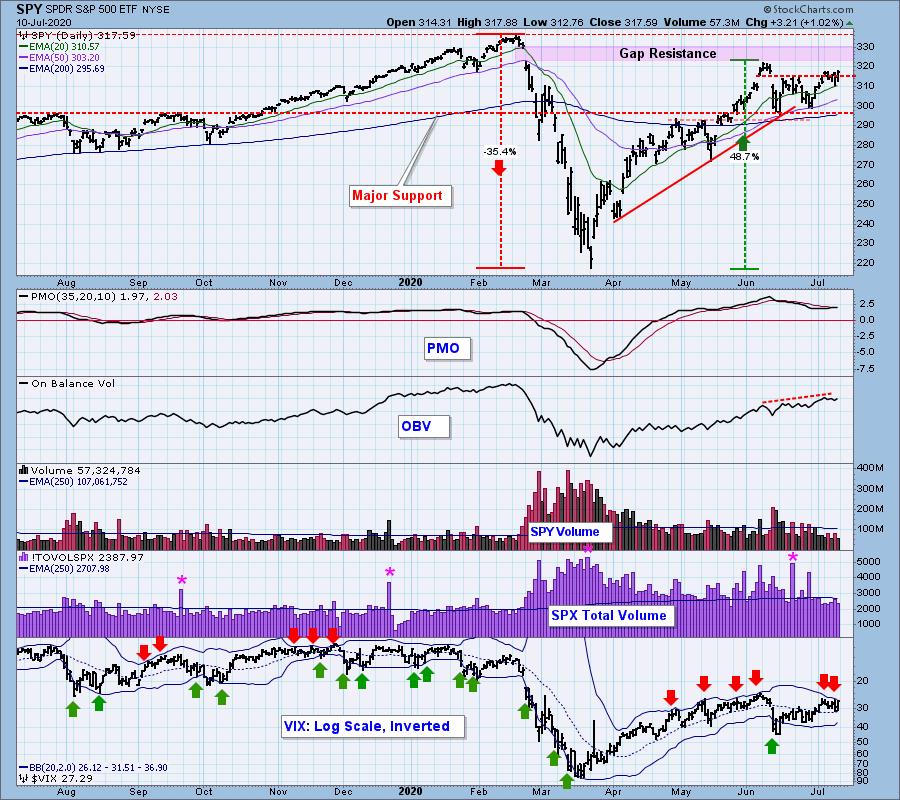
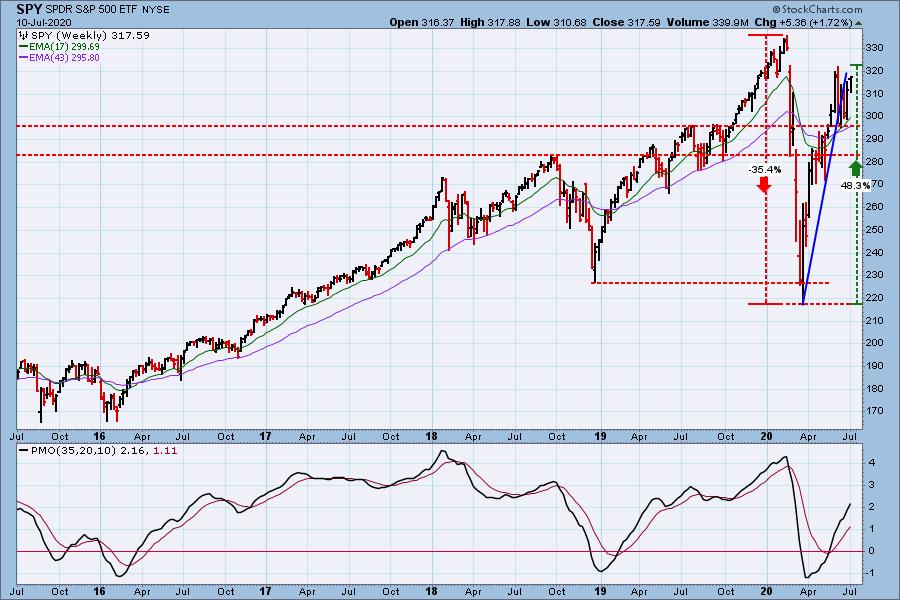
SPY Weekly Chart: Price is consolidating above important support after moving sideways through the very steep rising trend line.
Climactic Market Indicators: There was an upside exhaustion climax on Monday, but climactic activity for the rest of the week was of the one-day exhaustion type, not helpful.
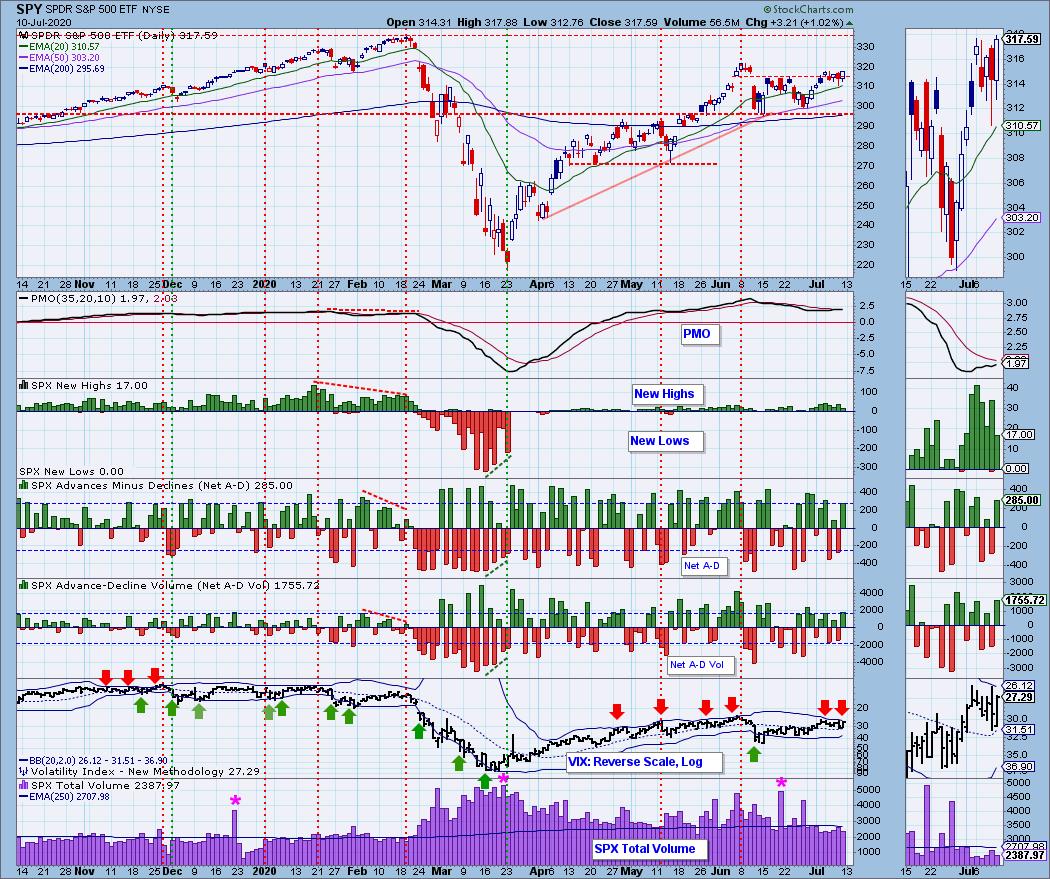
Short-Term Market Indicators: The short-term market trend is NEUTRAL and the condition is NEUTRAL. The bias is slightly bullish. Participation is much worst than the Technology Sector: The percent of stocks above 20EMA is -60% lower than at the June top.
Intermediate-Term Market Indicators: The Silver Cross Index hit an historical high in June, but it has dropped -30% since then. The Bullish Percent Index has dropped -40% since the June top, and the Golden Cross Index has dropped -50% since the February top. These indicators emphasize that participation is fading throughout the broad market.
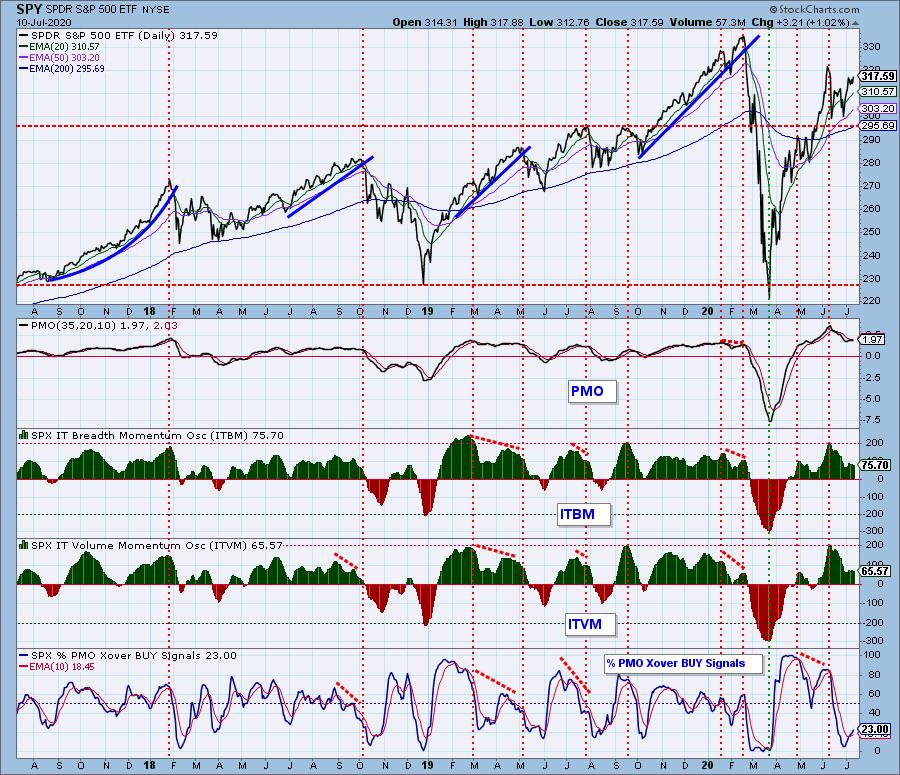
The intermediate-term market trend is UP and the condition based upon the ITBM and ITVM is modestly OVERBOUGHT. The market bias is BULLISH. The Percent of PMO Crossover BUY Signals crashed after the June top, and is still languishing at the low end of the range. Low readings tend to coincide with price lows, but not always.
CONCLUSION: I led with the piece about the Technology Sector losing participation, which means that fewer and fewer stocks in the sector are taking part in the rally. The large-cap stocks are carrying the load. This is the case for most of the major indexes, and the divergences are worse than at the February market top. From this evidence I can only conclude that a decline should be coming soon, and it should be longer than just a short three-day recess. None of that is guaranteed, of course, but that is what ought to happen.
Note: Next week is an options expiration week, so we should expect low volatility toward the end of the week.
Have you subscribed the DecisionPoint Diamonds yet? DP does the work for you by providing handpicked stocks/ETFs from exclusive DP scans! Add it with a discount! Contact support@decisionpoint.com for more information!
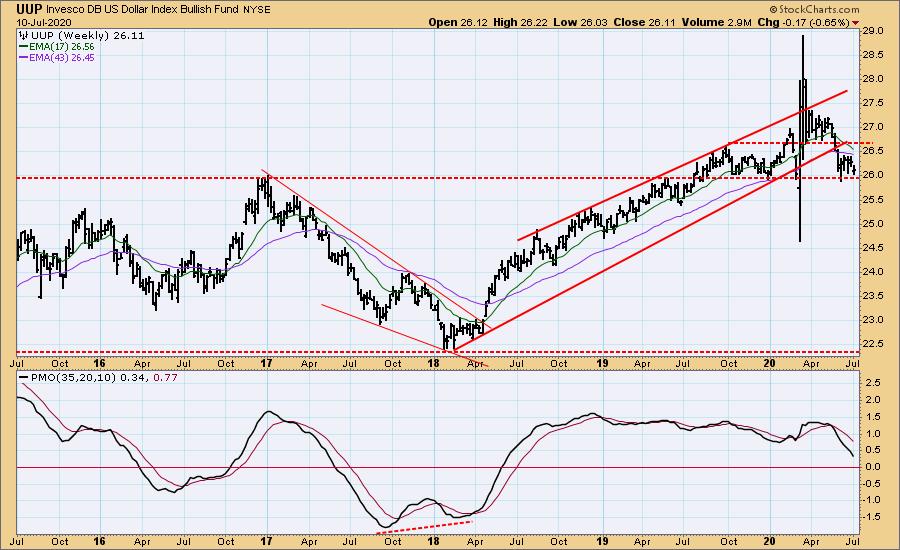
DOLLAR (UUP)
IT Trend Model: NEUTRAL as of 5/28/2020
LT Trend Model: SELL as of 7/10/2020
UUP Daily Chart: Today the UUP 50EMA crossed down through the 200EMA generating an LT Trend Model SELL Signal, so we should prepare for further weakness in the dollar.
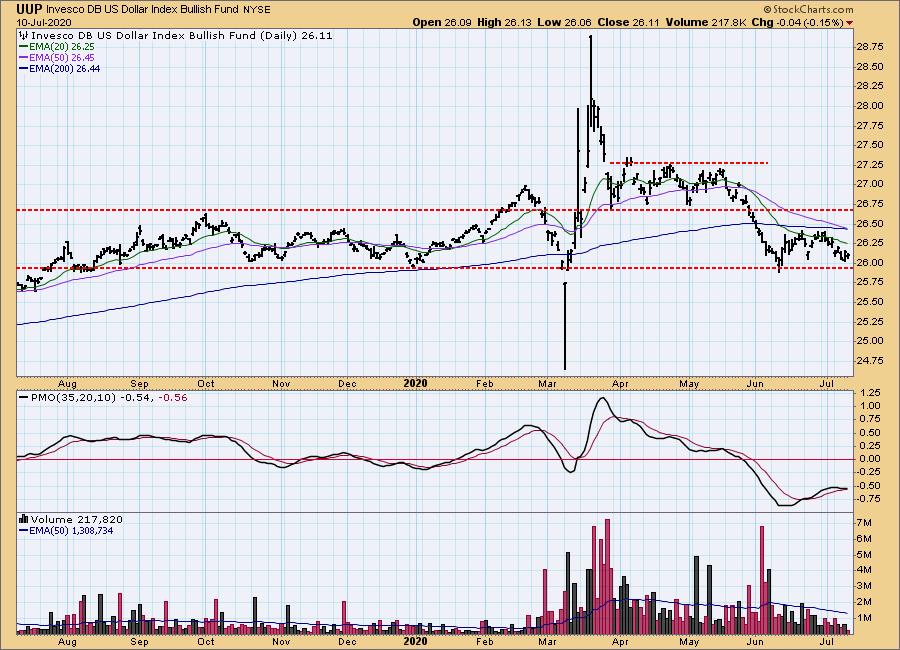
UUP Weekly Chart: There is strong support at 25.00, but the weekly PMO has clearly shifted from a relatively flat range to a down trend. Support is likely to be tested soon.
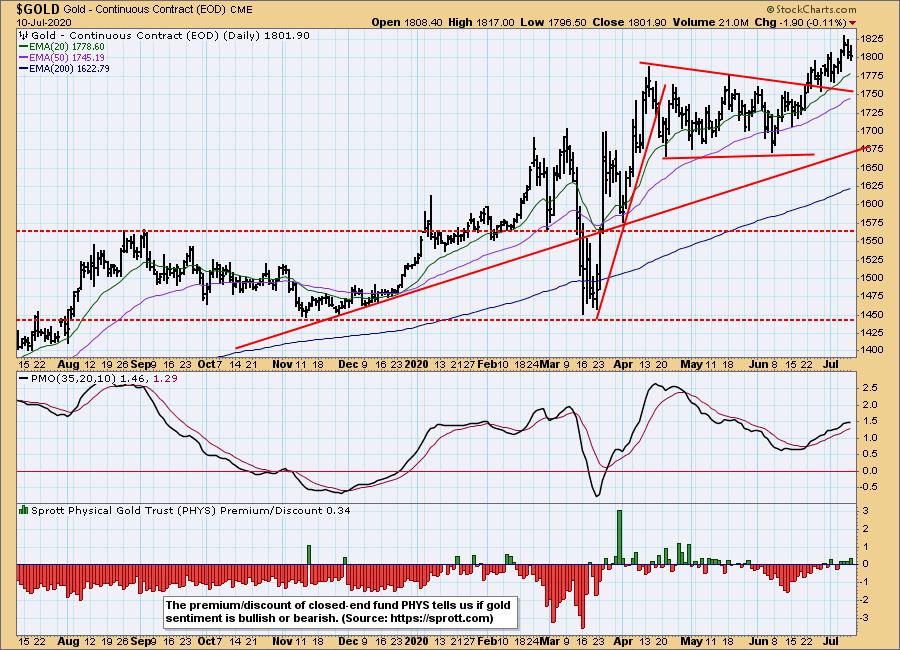
GOLD
IT Trend Model: BUY as of 3/24/2020
LT Trend Model: BUY as of 1/8/2019
GOLD Daily Chart: Gold broke out of a flag formation about two weeks ago, and it has been moving steadily higher since. The daily PMO is rising, and it has plenty of room before it becomes overbought. Sentiment is neutral.
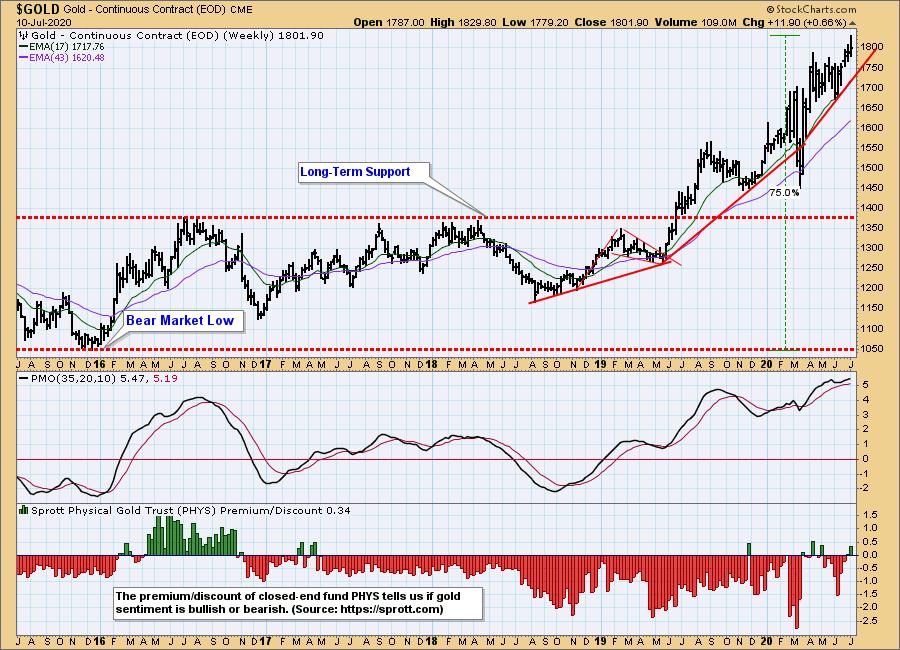
GOLD Weekly Chart: Bullish. The rising trend line I have drawn ignores the down spike earlier this year, considerinhg it an outlier. The weekly PMO is overbought, but the top of the PMO range is 7.5, set at the 2011 all-time high for gold.
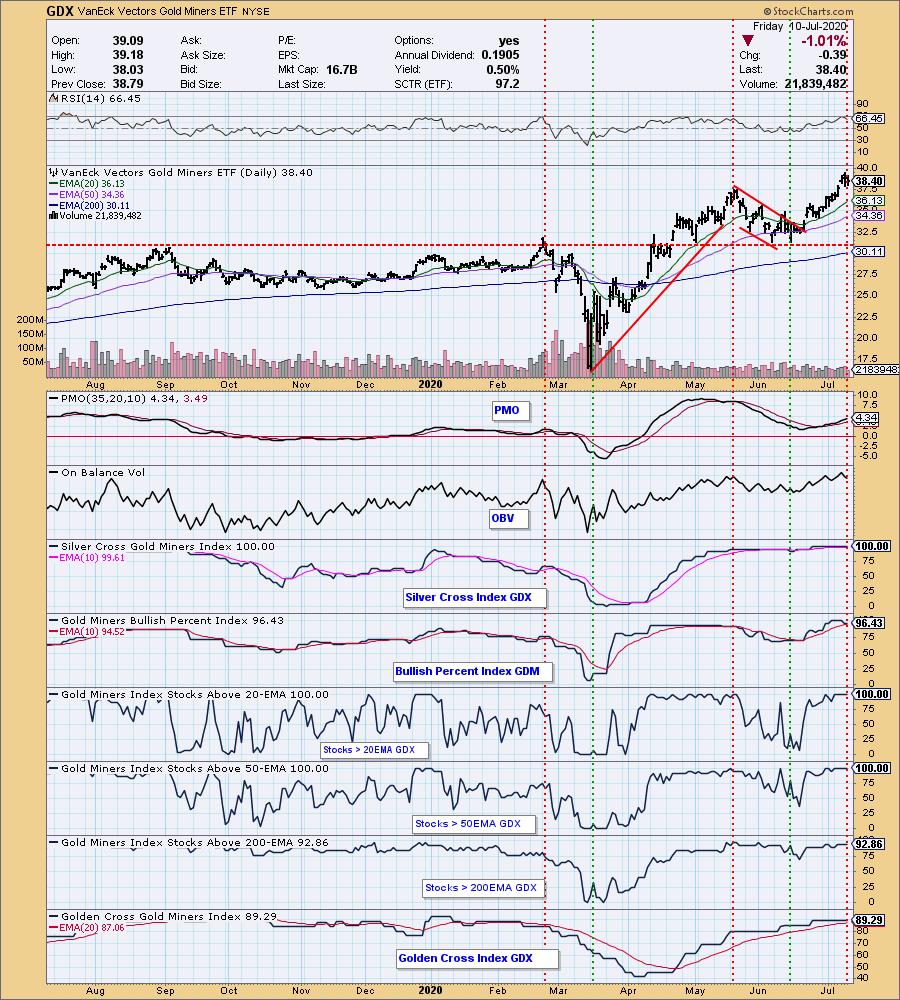
GOLD MINERS Golden and Silver Cross Indexes: Most indicators are overbought, but if gold stays positive, conditions will stay overbought without resulting in a correction.
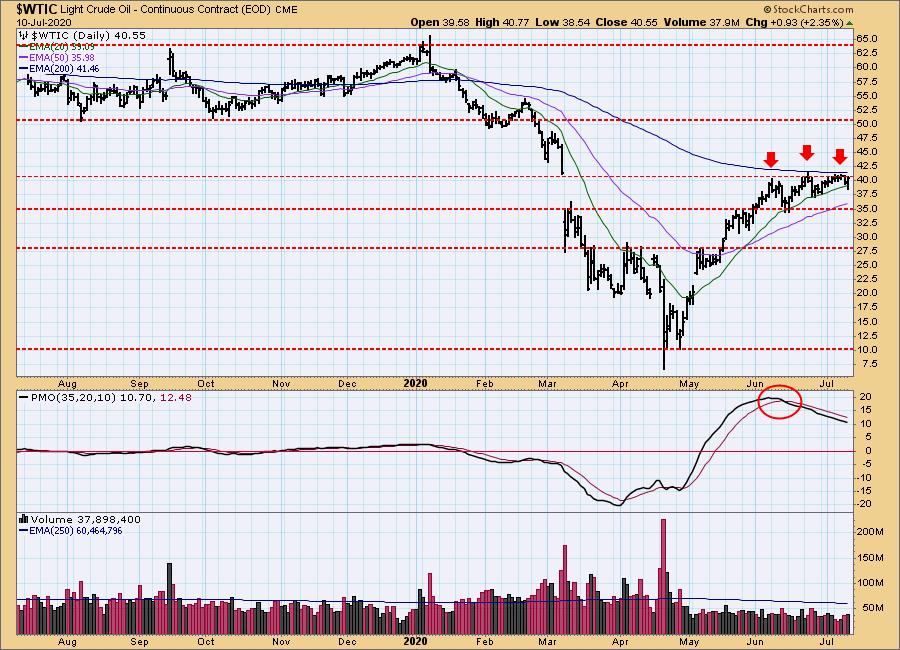
CRUDE OIL ($WTIC)
Until further notice we will use $WTIC to track the oil market. Since this is a continuous contract dataset, it doesn't "play well" with our Trend Models, and we will not report Trend Model signals for oil.
$WTIC Daily Chart: Crude appears to be settling into a range of 35 to 40.
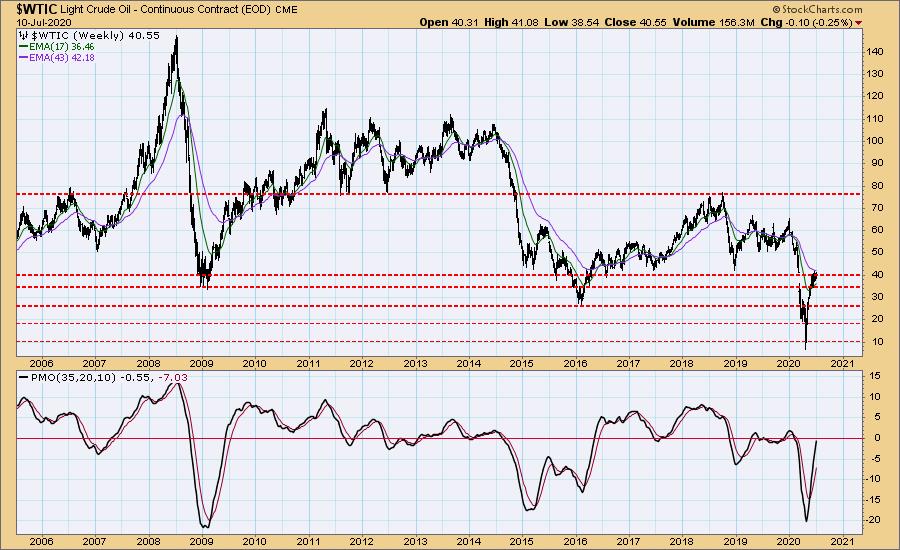
$WTIC Weekly Chart: Should the support at 35 fail, 27.50 seems like the next logical support level.
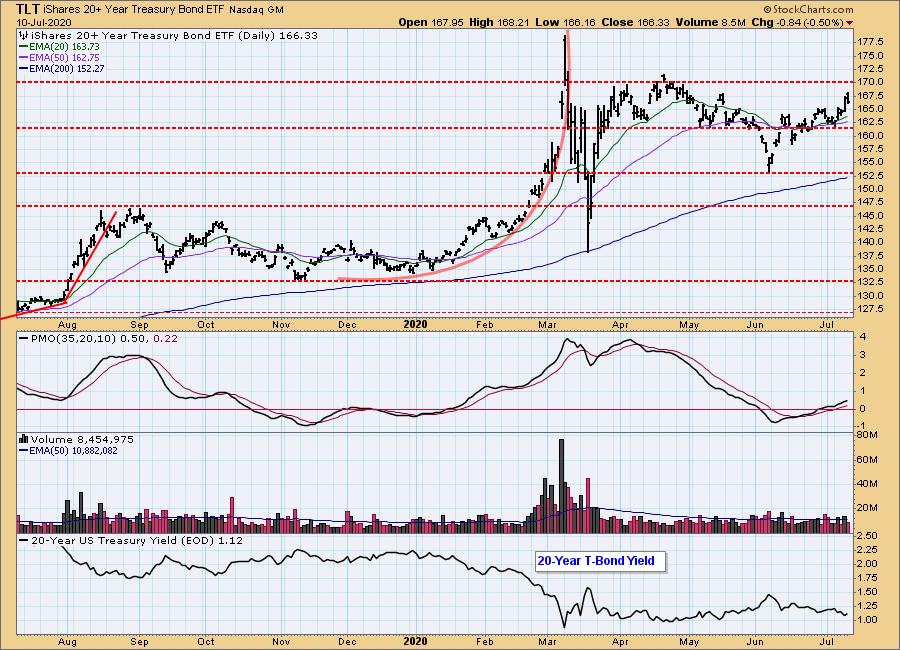
BONDS (TLT)
IT Trend Model: BUY as of 6/26/2020
LT Trend Model: BUY as of 1/2/2019
TLT Daily Chart: Currently, 170 looks like a credible level of resistance. If stocks falter again, expect to see the March top challenged.
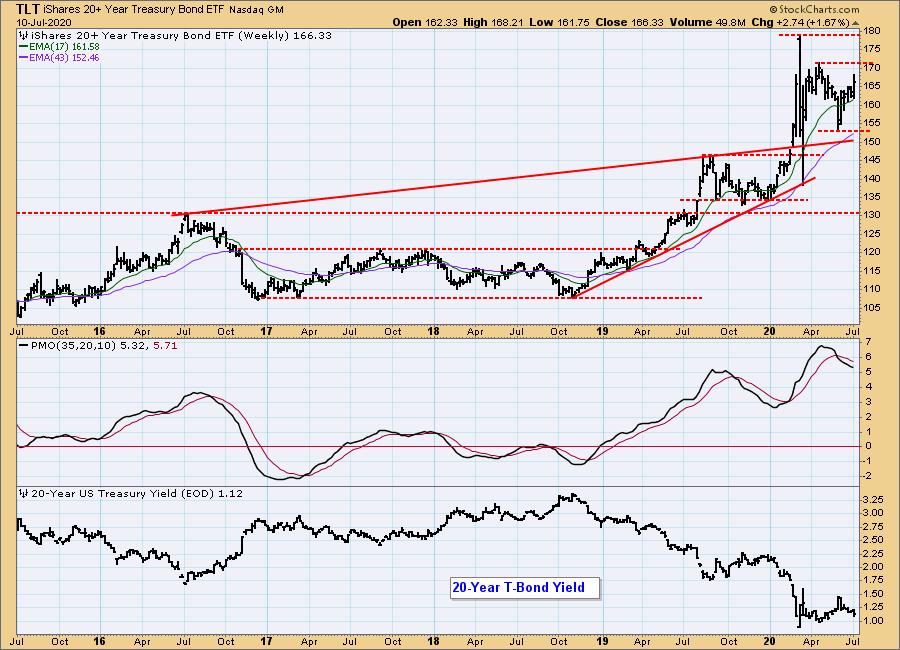
TLT Weekly Chart: There is the potential for bonds to go much higher, if interest rates head toward zero. Unfortunately, as repugnant as that is to me, I can't rule it out. It is just the next stop on the Fed road to ruin.
Technical Analysis is a windsock, not a crystal ball.
Happy Charting! - Carl
Disclaimer: This blog is for educational purposes only and should not be construed as financial advice. The ideas and strategies should never be used without first assessing your own personal and financial situation, or without consulting a financial professional. Any opinions expressed herein are solely those of the author, and do not in any way represent the views or opinions of any other person or entity.
NOTE: The signal status reported herein is based upon mechanical trading model signals, specifically, the DecisionPoint Trend Model. They define the implied bias of the price index based upon moving average relationships, but they do not necessarily call for a specific action. They are information flags that should prompt chart review. Further, they do not call for continuous buying or selling during the life of the signal. For example, a BUY signal will probably (but not necessarily) return the best results if action is taken soon after the signal is generated. Additional opportunities for buying may be found as price zigzags higher, but the trader must look for optimum entry points. Conversely, exit points to preserve gains (or minimize losses) may be evident before the model mechanically closes the signal.
Helpful DecisionPoint Links:
DecisionPoint Alert Chart List
DecisionPoint Golden Cross/Silver Cross Index Chart List
DecisionPoint Sector Chart List
Price Momentum Oscillator (PMO)
Swenlin Trading Oscillators (STO-B and STO-V)