
QUESTION: Concerning the P/E chart [below] showing overvalue of 20, fair value of 15, and undervalue of 10, instead of these absolute values, have there been interest rate adjusted values? Obviously, normal P/Es can be adjusted by Treasury Rates, for example. Since interest rates are at historic lows, higher P/Es are more tolerable.
ANSWER: No, that's not a thing. Keep in mind that P/E ratios ultimately point back to profit. A P/E of 20 means that the company makes an annual profit of 5%. I don't think that lower interest rates could justify a company making a smaller profit of, say, 2.5%, for example. How about when interest rates are negative, would that justify a company running at a loss? Of course not. An investor may rationalize accepting a smaller yield (dividend) based upon interest rate levels, but a company needs to be comfortably profitable regardless of interest rates. (IMHO) There are plenty of legitimate rationalizations for some companies falling outside this normal range, but low interest rates isn't one of them.
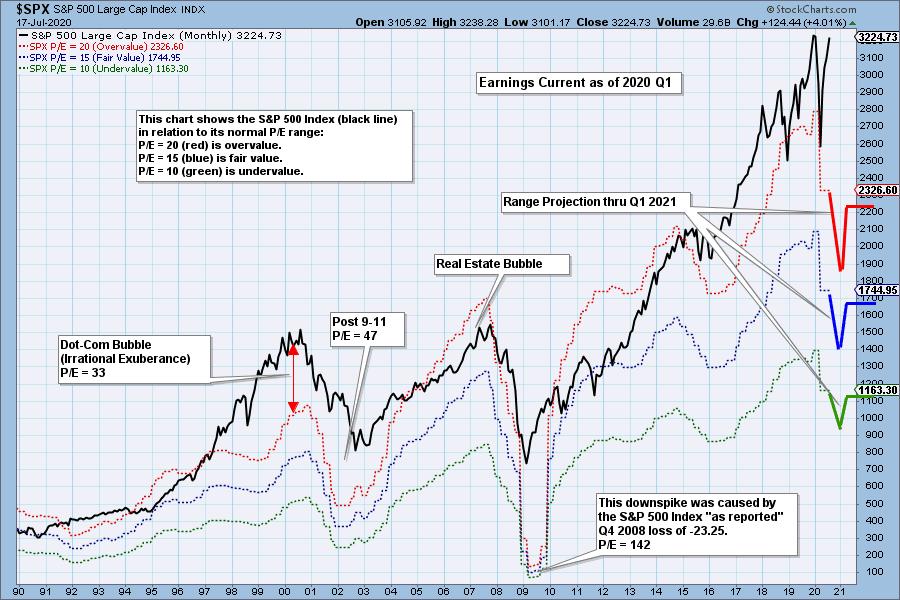
Most FAANG stocks currently have P/Es in the 30s, but those high P/Es make those companies more vulnerable to "reversion to rationality." For example, AAPL's P/E, currently 30, was about 16 in February at the bottom of the bear market. But that kind of vulnerability is the price paid for participating in the growth of those companies. Most would assert that it is a reasonable trade-off.
The DecisionPoint Alert Weekly Wrap presents an end-of-week assessment of the trend and condition of the Stock Market, the U.S. Dollar, Gold, Crude Oil, and Bonds. The DecisionPoint Alert daily report (Monday through Thursday) is abbreviated and gives updates on the Weekly Wrap assessments.
Watch the latest episode of DecisionPoint on StockCharts TV's YouTube channel here!
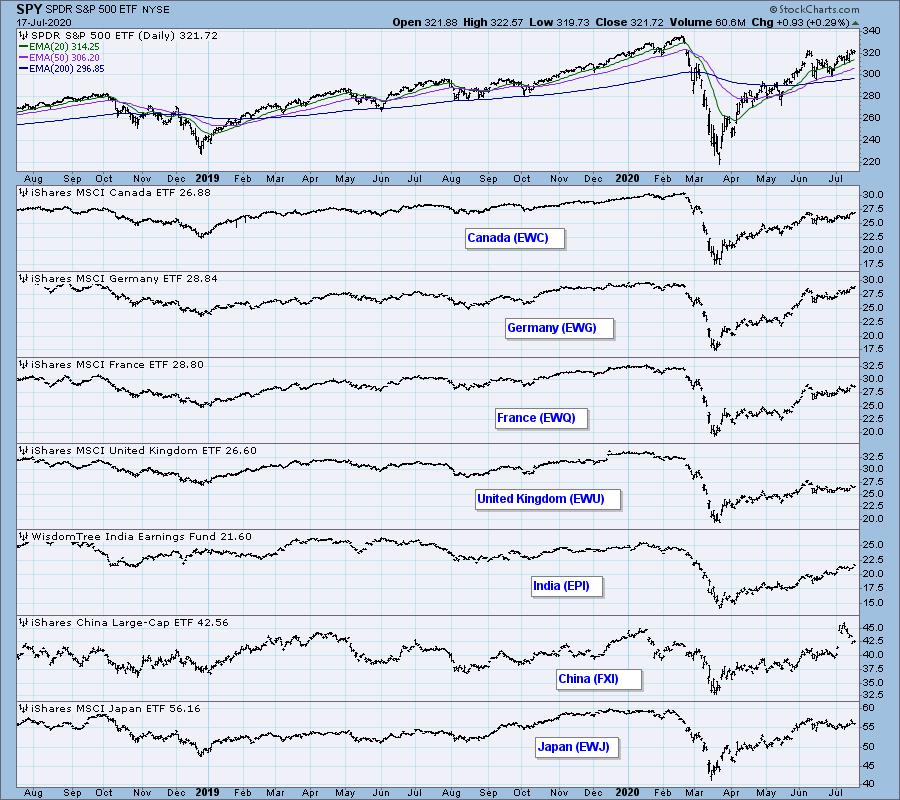
GLOBAL MARKETS
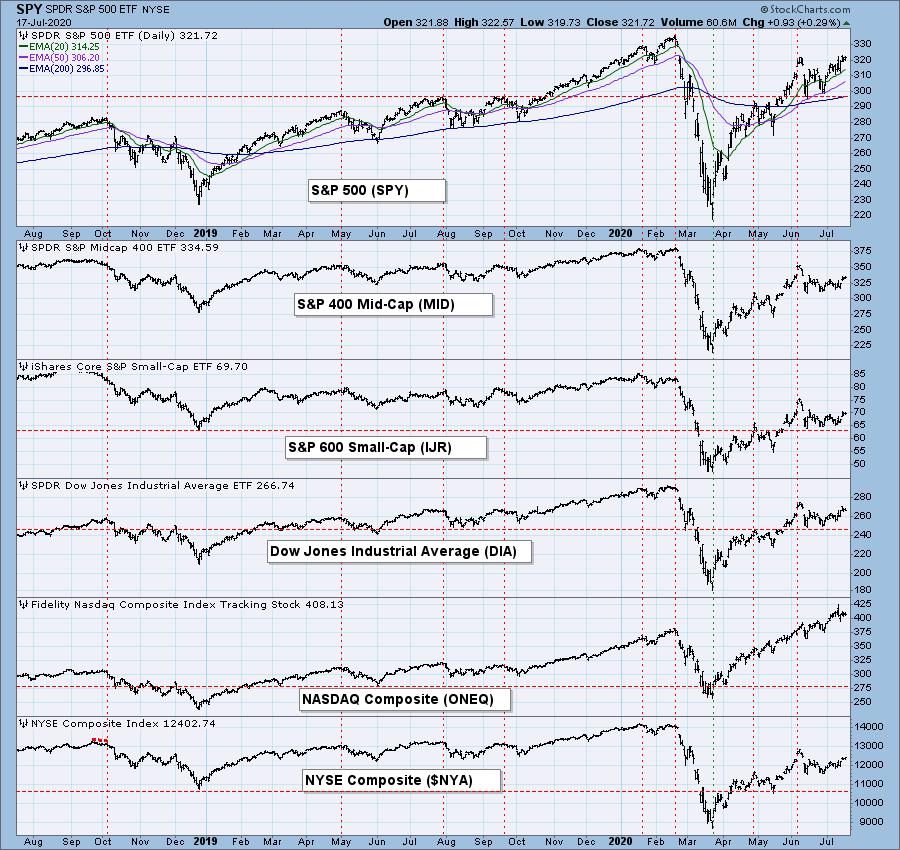
BROAD MARKET INDEXES
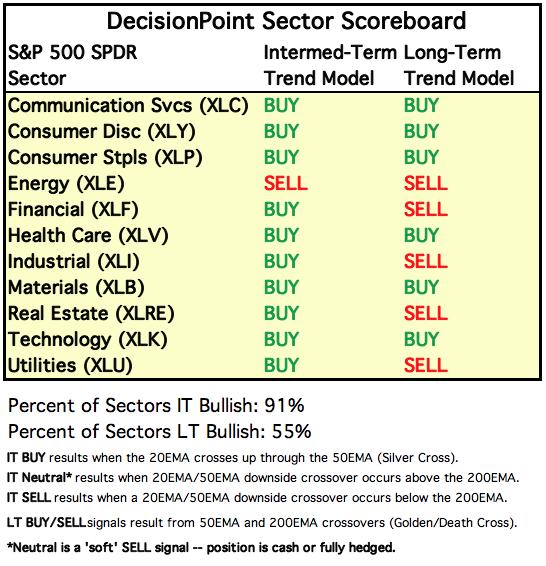
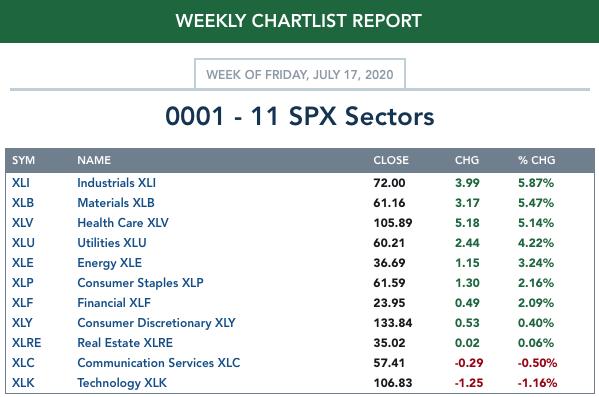
SECTORS
Each S&P 500 Index component stock is assigned to one, and only one, of 11 major sectors. This is a snapshot of the Intermediate-Term (Silver Cross) and Long-Term (Golden Cross) Trend Model signal status for those sectors.
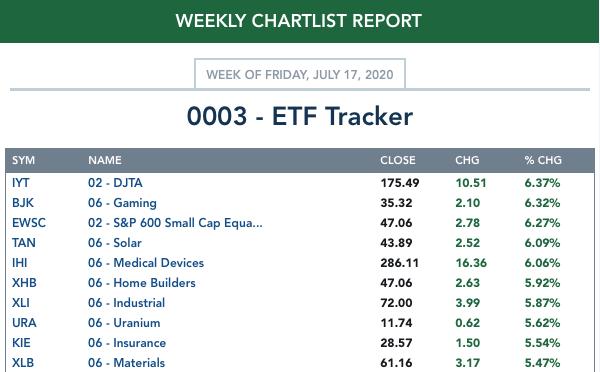
ETF TRACKER: This is a list of about 100 ETFs intended to track a wide range of U.S. market indexes, sectors, global indexes, interest rates, currencies, and commodities. StockCharts.com subscribers can acquire it in the DecisionPoint Trend and Condition ChartPack.
Top 10 . . .
. . . and bottom 10: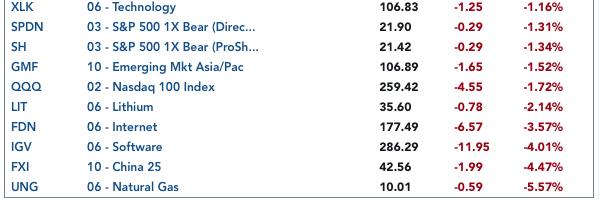
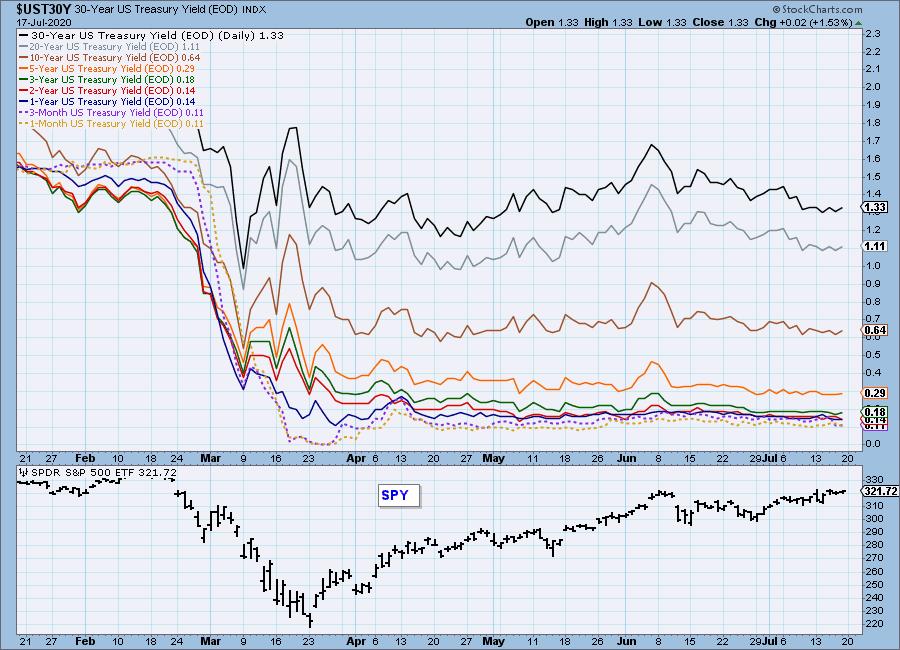
INTEREST RATES
This chart is included so we can monitor rate inversions. In normal circumstances the longer money is borrowed the higher the interest rate that must be paid. When rates are inverted, the reverse is true.
STOCKS
IT Trend Model: BUY as of 5/8/2020
LT Trend Model: BUY as of 6/8/2020
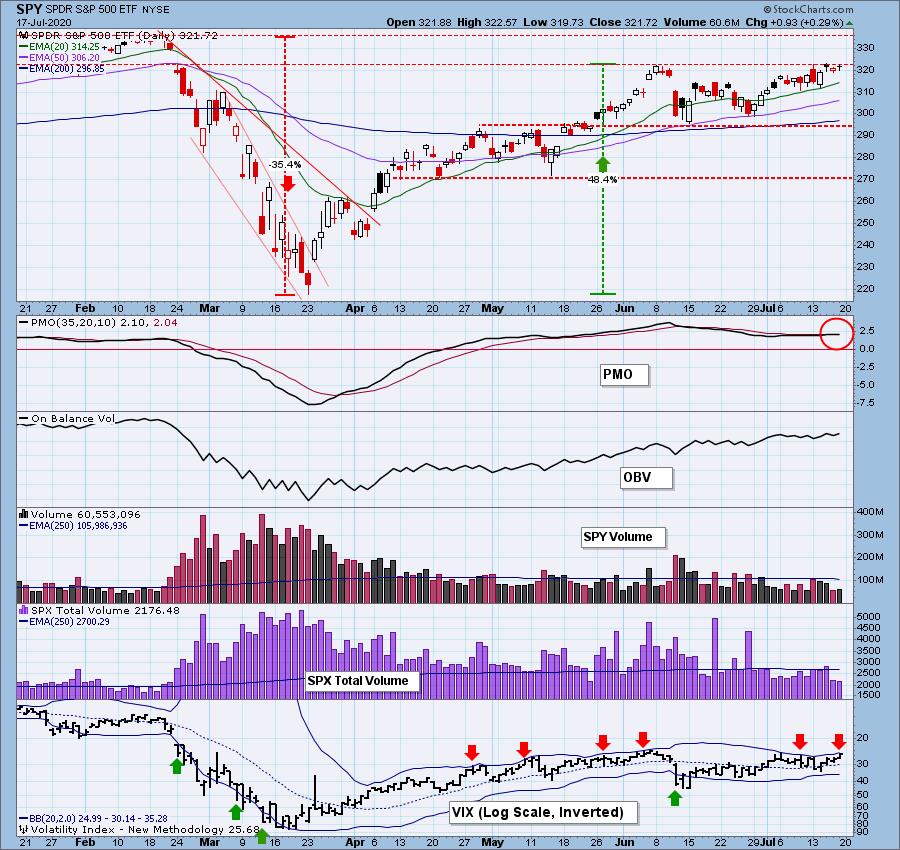
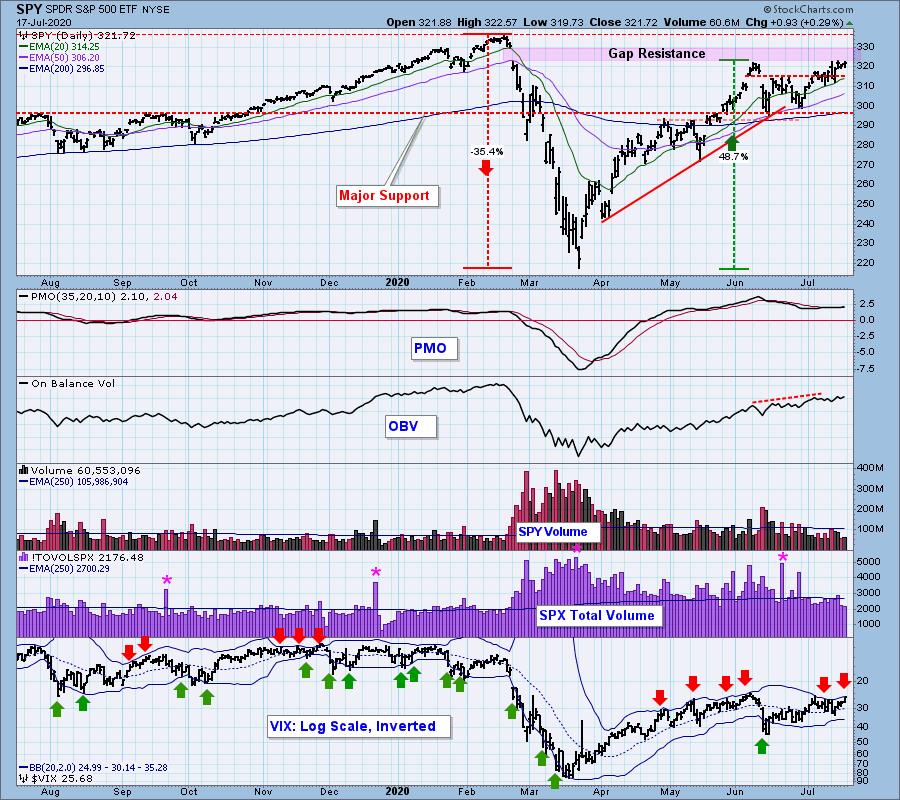
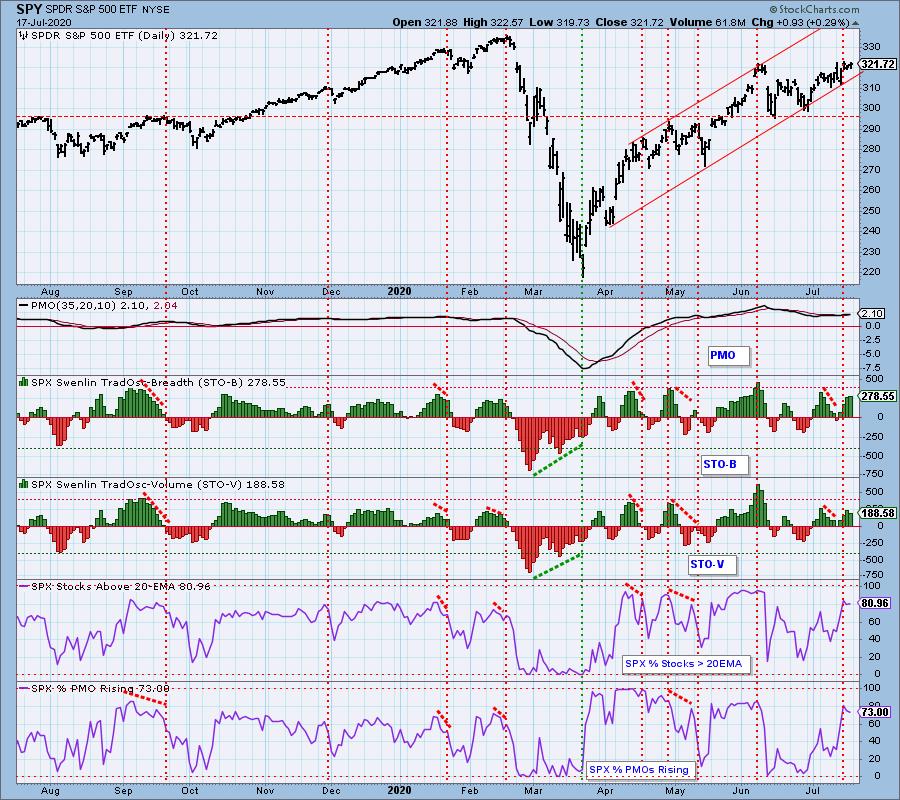
SPY Daily Chart: In the last three days this week SPY stayed in a one percent range, which pretty well nails our expectation of low volatility at the end of an options expiration week. Volume was pretty thin as people waited for the market to pick a direction. The VIX touched the top Bollinger Band, showing SPY is overbought in the short term. The daily PMO is also overbought, but has generated a crossover BUY signal, nevertheless.
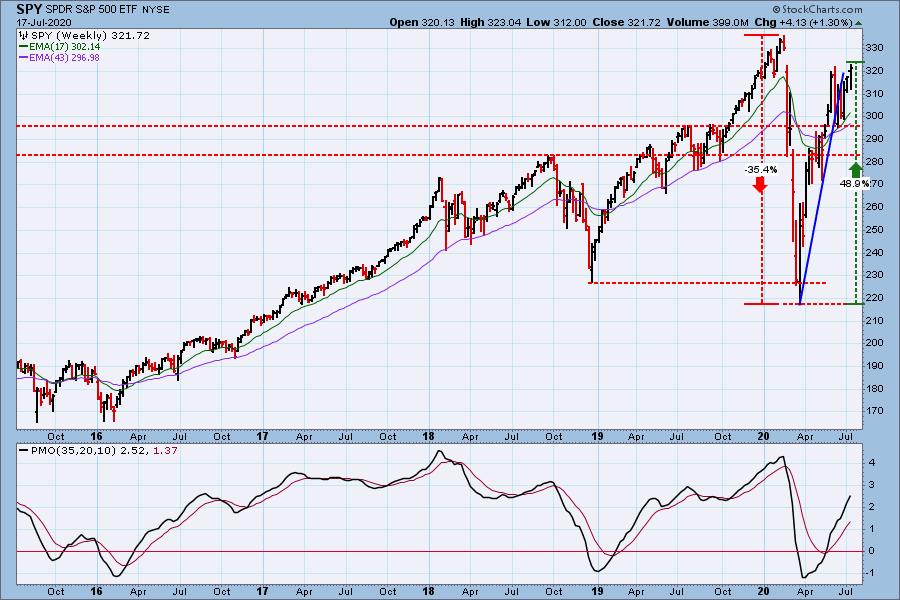
SPY Weekly Chart: Marginal new rally highs were made this week, but the weekly PMO is overbought.
Climactic Market Indicators: There was an upside exhaustion climax on Wednesday, but there was no price decline the next two days. It could be that prices were supported pending options expiration, so there could be some pullback next week.
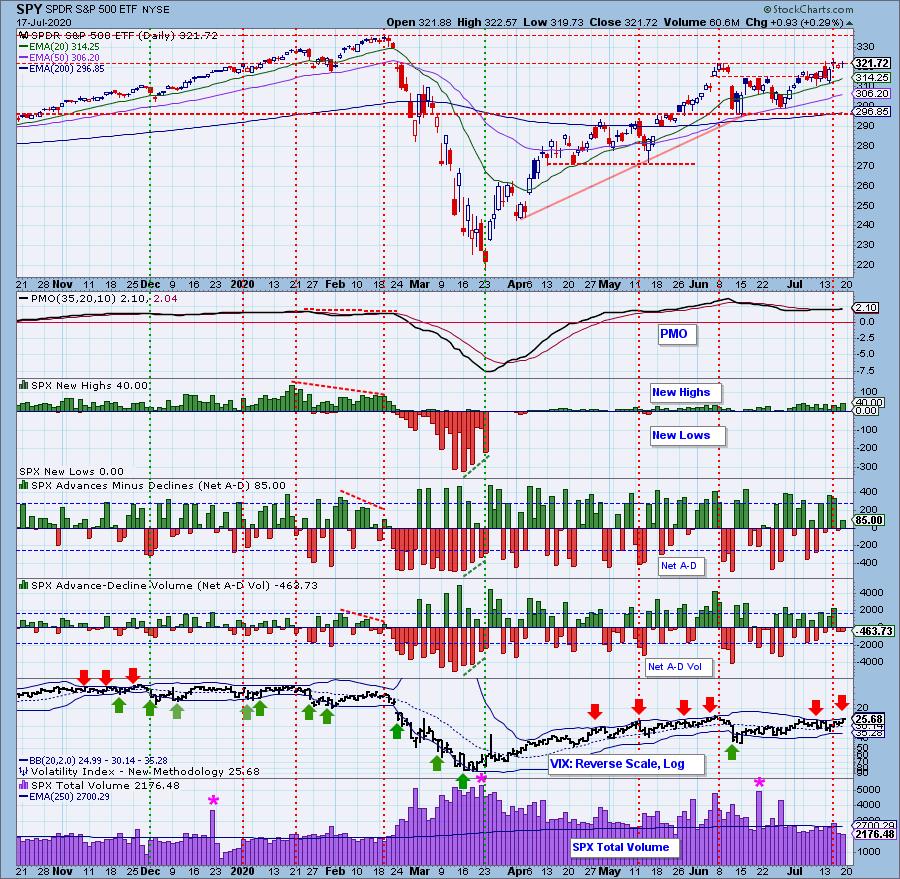
Short-Term Market Indicators: The short-term market trend is UP and the condition is OVERBOUGHT. Market bias in this time frame is BULLISH.
Intermediate-Term Market Indicators: Both the Silver Cross Index and Bullish Percent Index still carry sharp negative divergences.
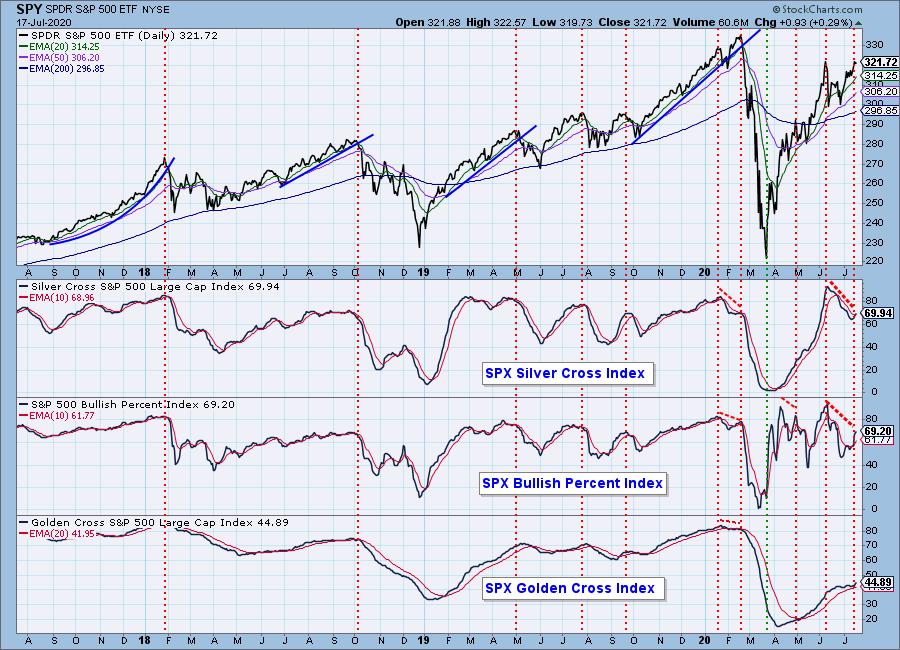
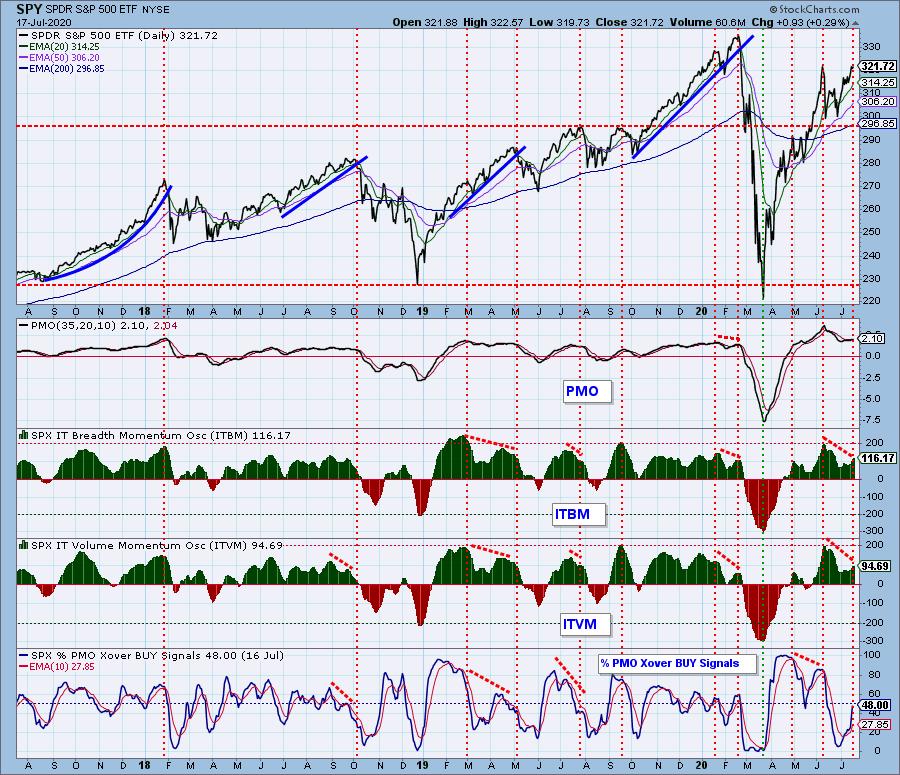
The intermediate-term market trend is UP and the condition is HIGH NEUTRAL. The bias is BULLISH. The ITBM and ITVM negative divergences are bearish.
CONCLUSION: There is a general belief, which I do not dispute, that the COVID-19 relief efforts were responsible for the astonishing rally off the March lows. Now, looking at six weeks of sideways movement, we have to wonder if the rocket is out of fuel, and if another relief package will be required to force prices higher again. From a strictly technical assessment, the sideways trading range first and foremost looks like a continuation pattern, meaning it should eventually resolve to the upside. In opposition to that potential outcome are quite a number of negative divergences on the short- and intermediate-term charts. Also, last week I pointed out some serious negative divergences on the Technology Sector chart. They are still there, so the sector that led the market up, could lead it back down.
It is my opinion that we are in another bubble, but people immersed in the bubble, profiting from it, usually can't perceive the context. "I'm making money. That's all I need to know." My response is, go ahead and make the money, but be aware that it is going to end abruptly. Be ready to exit.
Have you subscribed the DecisionPoint Diamonds yet? DP does the work for you by providing handpicked stocks/ETFs from exclusive DP scans! Add it with a discount! Contact support@decisionpoint.com for more information!
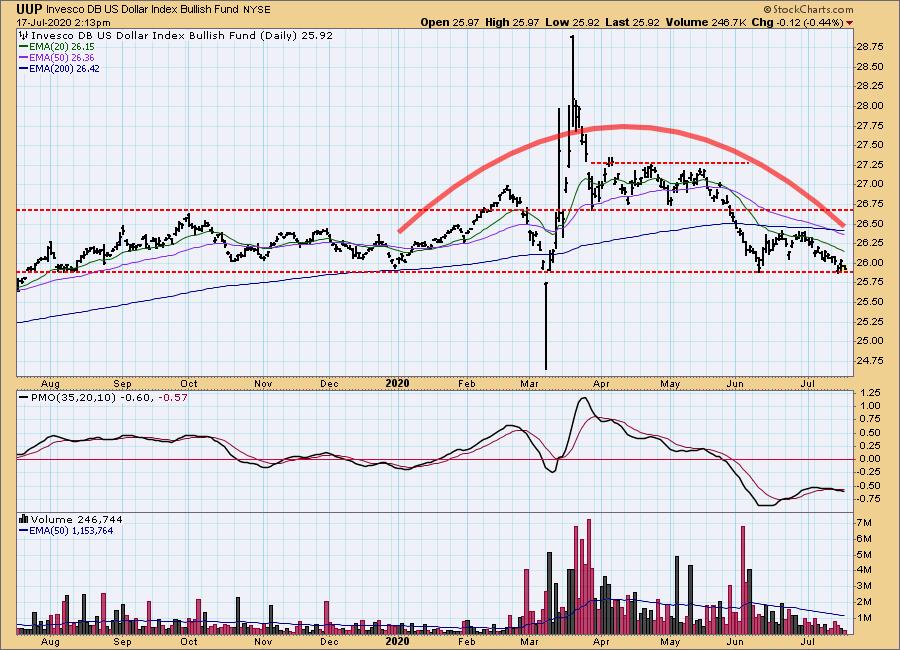
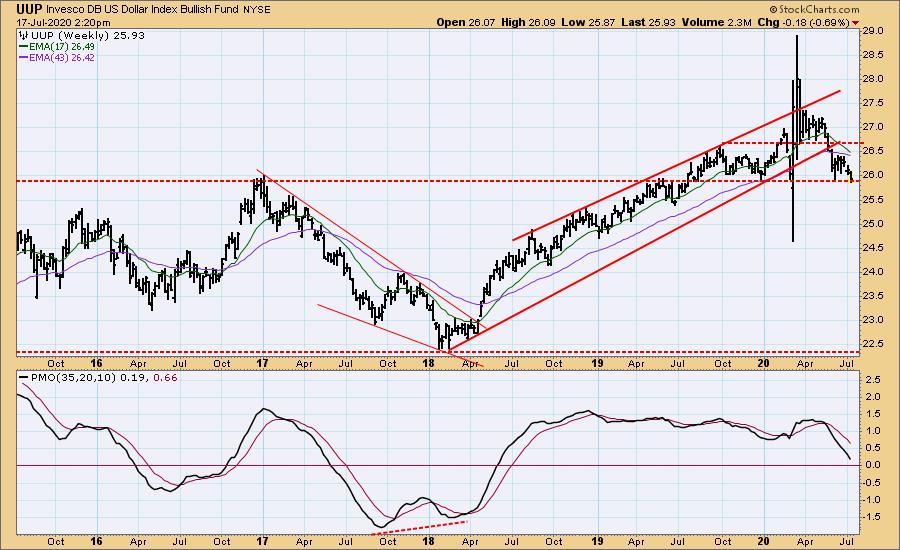
DOLLAR (UUP)
IT Trend Model: NEUTRAL as of 5/28/2020
LT Trend Model: SELL as of 7/10/2020
UUP Daily Chart: Price is once again testing the one-year support line. If we ignore the extremes of March, we can also see a rounded top, which also contains a head and shoulders pattern. This makes me think that support may fail this time. The daily PMO is below the zero line and has crossed down through the signal line. Very bearish.
UUP Weekly Chart: The weekly PMO is dropping toward the zero line, and will drop below it unless there is a price reversal.
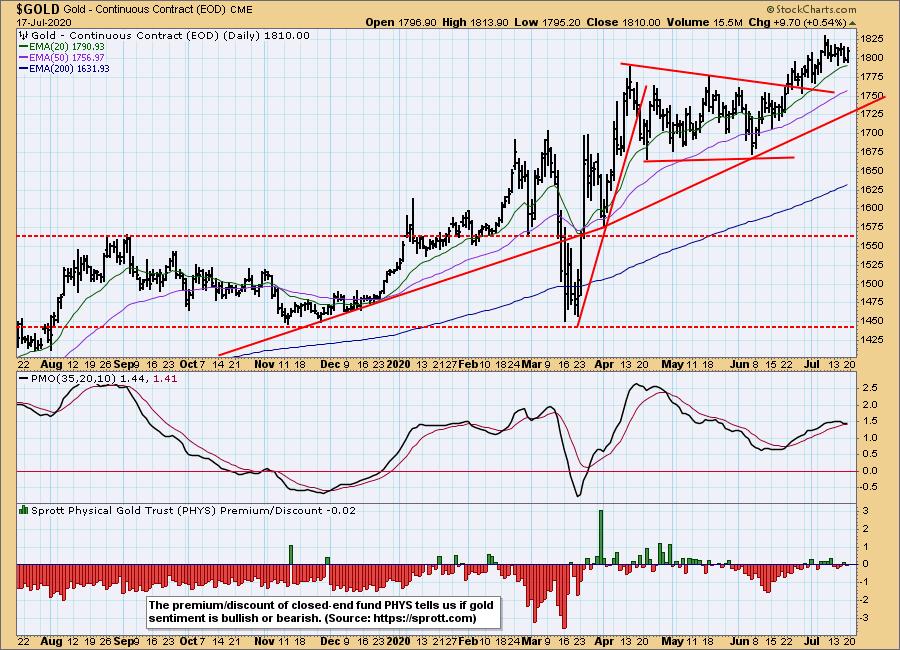
GOLD
IT Trend Model: BUY as of 3/24/2020
LT Trend Model: BUY as of 1/8/2019
GOLD Daily Chart: Last month gold broke out of an extended trading range that looked like a flag to me. The daily PMO has topped, so gold may have to move back toward the point of breakout.
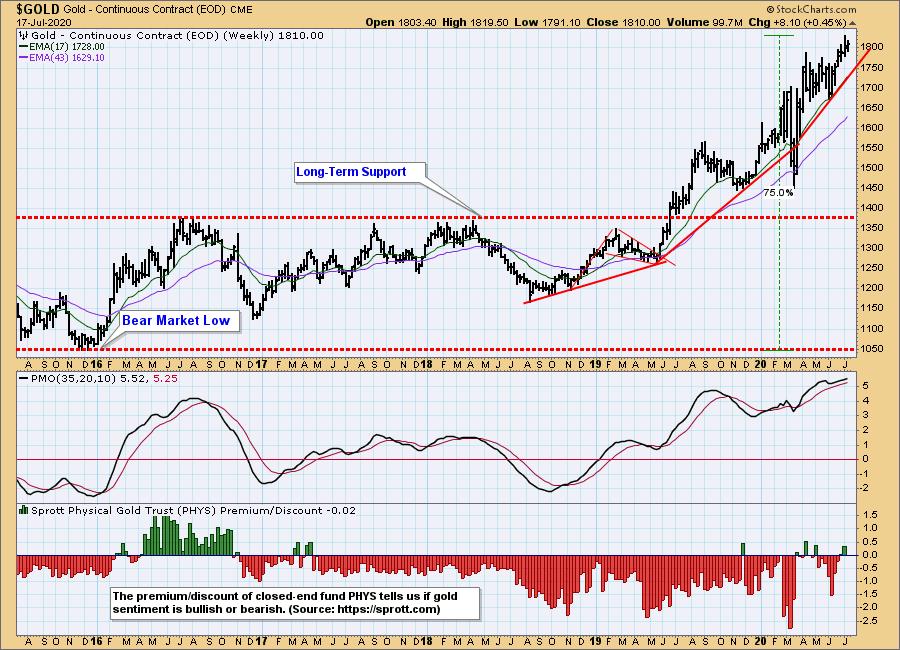
GOLD Weekly Chart: The weekly PMO is very overbought. Historically, we only find higher PMO readings during the rally to all-time highs in 2011 and years prior.
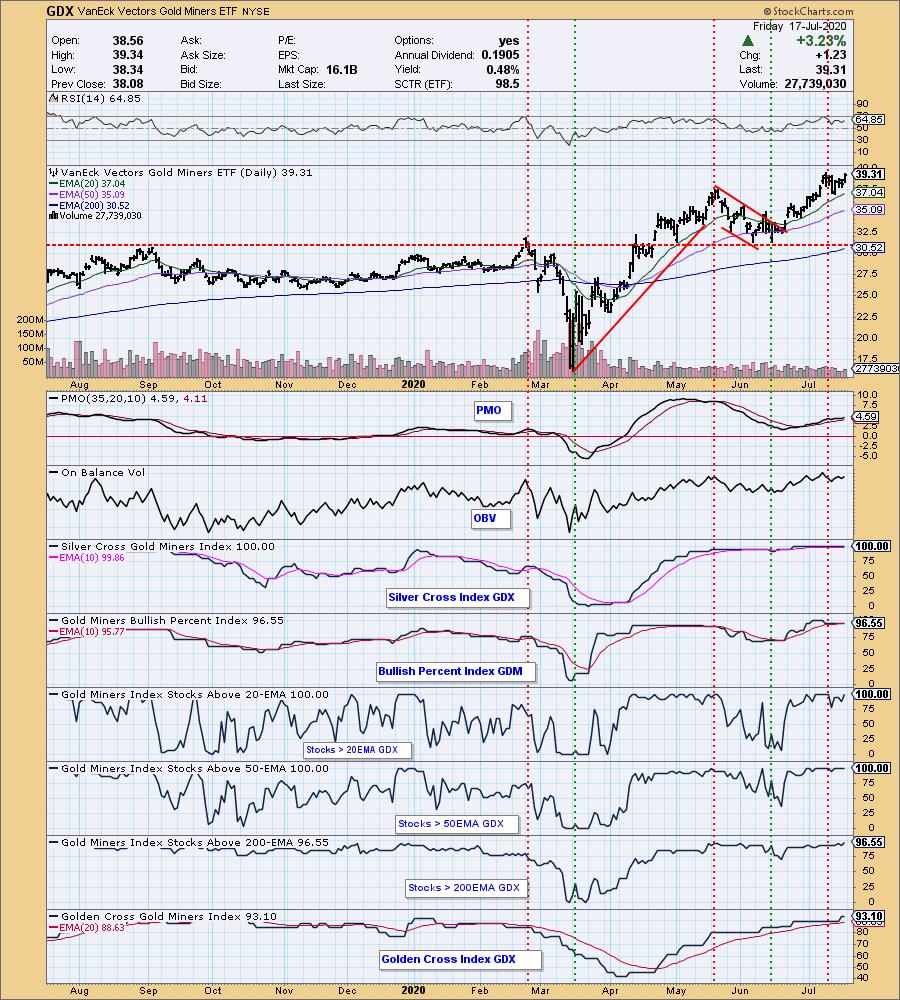
GOLD MINERS Daily Chart: Most of the indicators are overbought, but GDX is breaking out again, so overbought conditions could last for weeks or months.
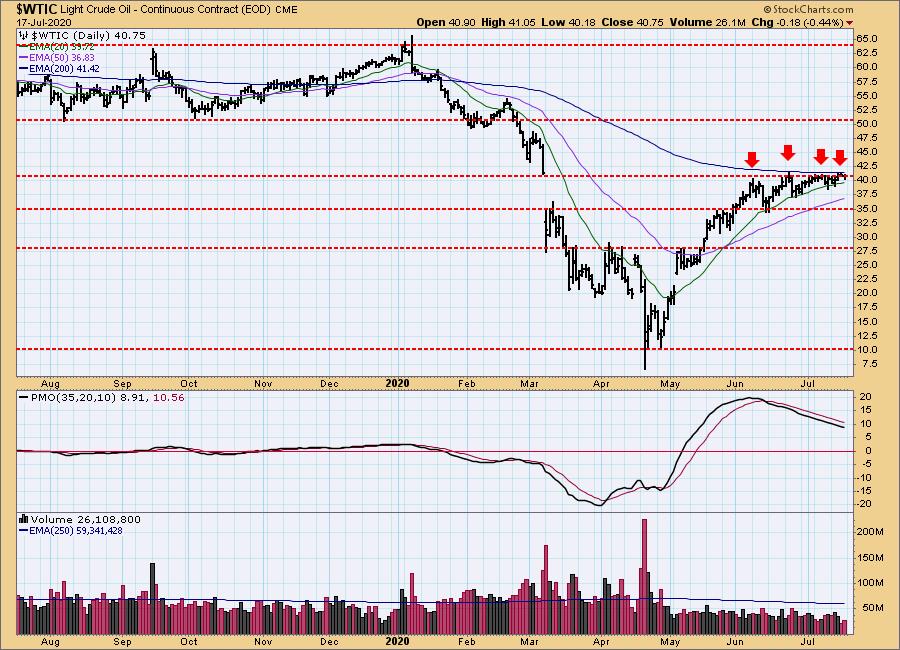
CRUDE OIL ($WTIC)
Until further notice we will use $WTIC to track the oil market. Since this is a continuous contract dataset, it doesn't "play well" with our Trend Models, and we will not report Trend Model signals for oil.
$WTIC Daily Chart: Crude keeps trying to break above the resistance at around 40.80. I think it will take some good news to accomplish that.
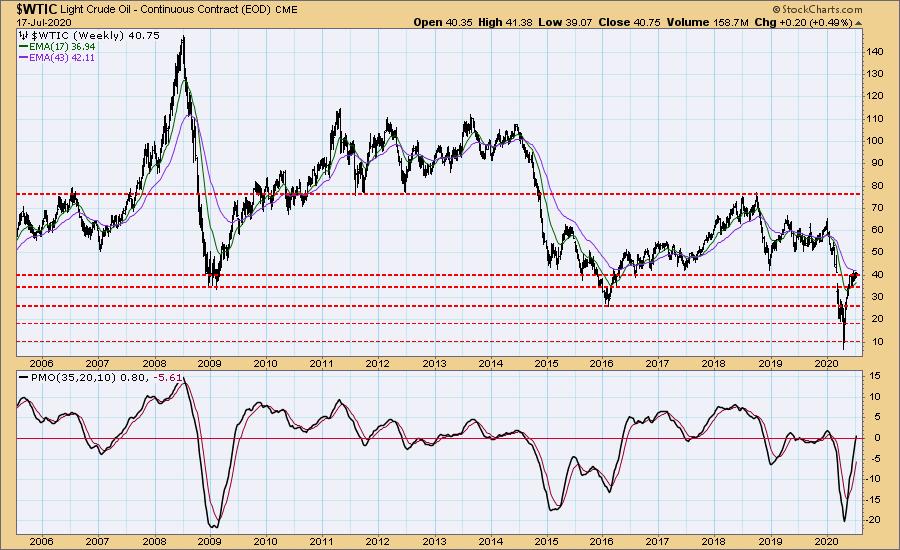
$WTIC Weekly Chart: Crude has rebounded from the washout earlier this year, but I think that 40 to 45 is the maximum upside until something changes.
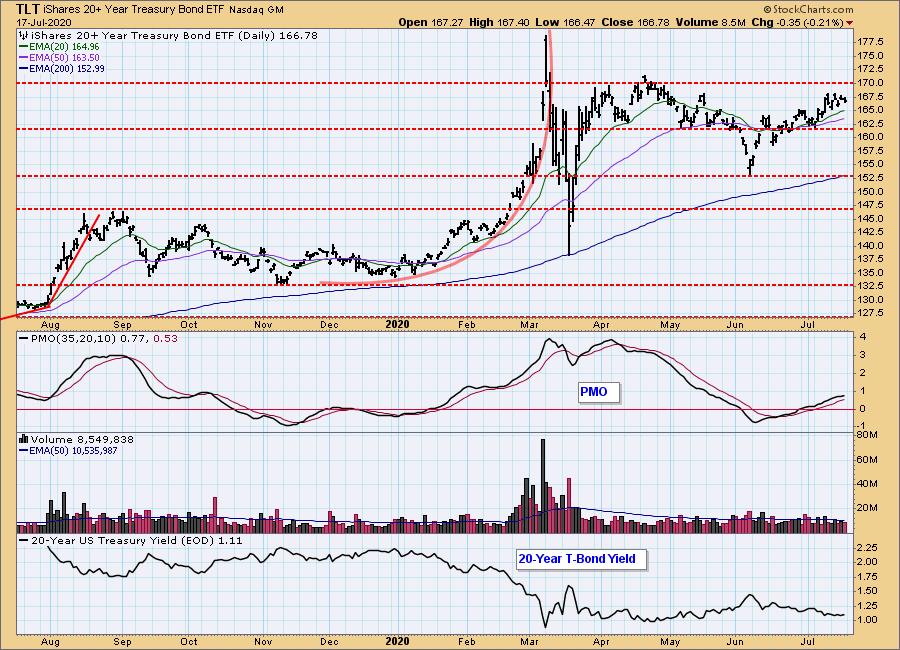
BONDS (TLT)
IT Trend Model: BUY as of 6/26/2020
LT Trend Model: BUY as of 1/2/2019
TLT Daily Chart: Since interest rates could still go to zero, there is still a chance that bonds could challenge the 177 level; however, there is no indication that the Fed is headed that way at the present.
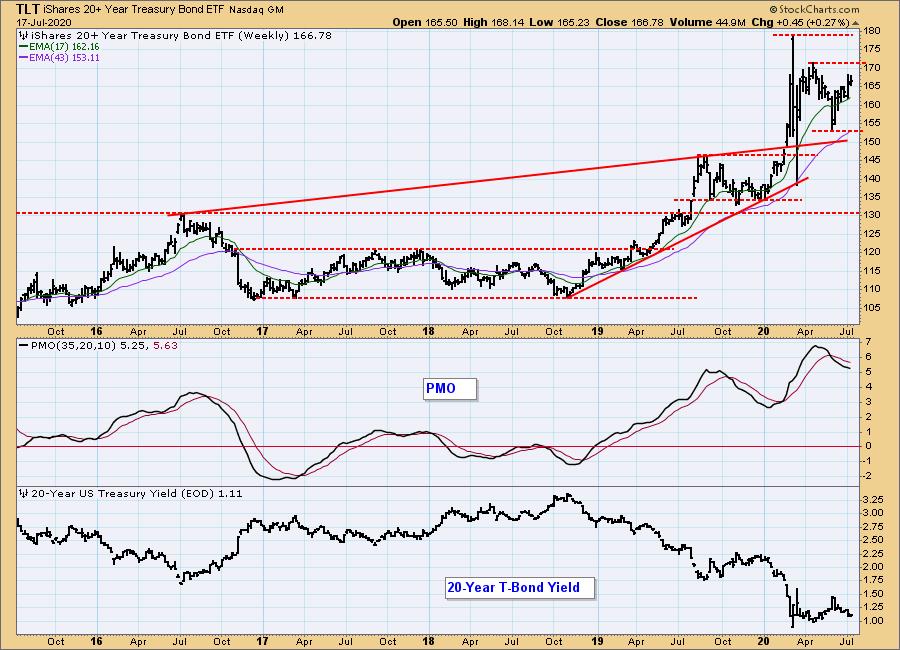
TLT Weekly Chart: Price seems to be settling into a range -- 153 to 171.
Technical Analysis is a windsock, not a crystal ball.
Happy Charting! - Carl
Disclaimer: This blog is for educational purposes only and should not be construed as financial advice. The ideas and strategies should never be used without first assessing your own personal and financial situation, or without consulting a financial professional. Any opinions expressed herein are solely those of the author, and do not in any way represent the views or opinions of any other person or entity.
NOTE: The signal status reported herein is based upon mechanical trading model signals, specifically, the DecisionPoint Trend Model. They define the implied bias of the price index based upon moving average relationships, but they do not necessarily call for a specific action. They are information flags that should prompt chart review. Further, they do not call for continuous buying or selling during the life of the signal. For example, a BUY signal will probably (but not necessarily) return the best results if action is taken soon after the signal is generated. Additional opportunities for buying may be found as price zigzags higher, but the trader must look for optimum entry points. Conversely, exit points to preserve gains (or minimize losses) may be evident before the model mechanically closes the signal.
Helpful DecisionPoint Links:
DecisionPoint Alert Chart List
DecisionPoint Golden Cross/Silver Cross Index Chart List
DecisionPoint Sector Chart List
Price Momentum Oscillator (PMO)
Swenlin Trading Oscillators (STO-B and STO-V)