
On our StockCharts TV show I featured this chart. The Technology Sector recently made all-time highs, but, at the same time, a large number of negative signs threw a lot of shade on the picture. There were three significant negative divergences, as well as a PMO crossover SELL signal, and a downside crossover on the Silver Cross Index. There is, in fact, a lot of similarity between this week's top and the February top, except that most of the divergences are steeper. Also, the Golden Cross Index is far below its February top, which shows that the longer-term damage has not been repaired.
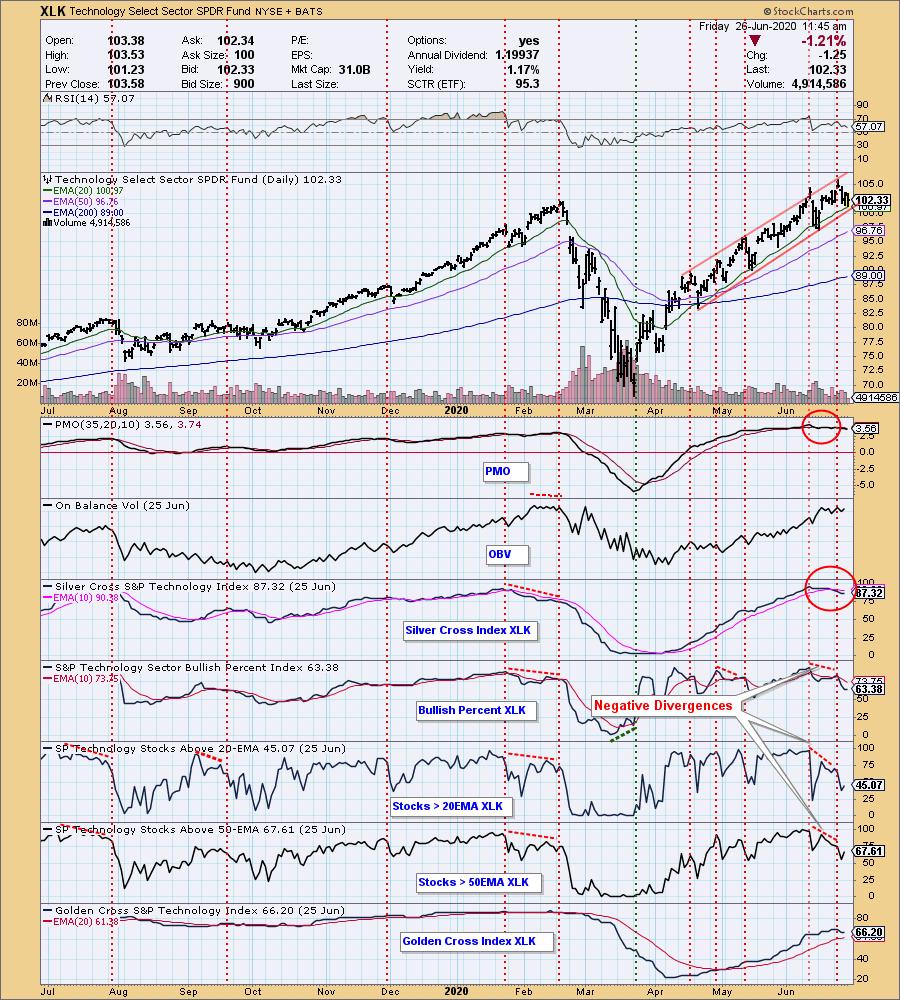
We can see that the Technology Sector is showing significant technical weakness, but what about the other ten sectors? Well, Technology was the only sector to make all-time highs this week, or even to exceed the early-June top, so we can say that the other sectors are failing to confirm. All the other sectors have overbought PMOs and crossover SELL signals, and they all have Silver Cross Index SELL signals, so there is technical weakness across the board. I could probably stop here and draw my conclusions, but let's continue on for the big picture.
Just a reminder, we have a list of sector charts, which I curate (annotate), available for our DecisionPoint.com subscribers.
The DecisionPoint Alert Weekly Wrap presents an end-of-week assessment of the trend and condition of the Stock Market, the U.S. Dollar, Gold, Crude Oil, and Bonds. The DecisionPoint Alert daily report (Monday through Thursday) is abbreviated and gives updates on the Weekly Wrap assessments.
Watch the latest episode of DecisionPoint on StockCharts TV's YouTube channel here!
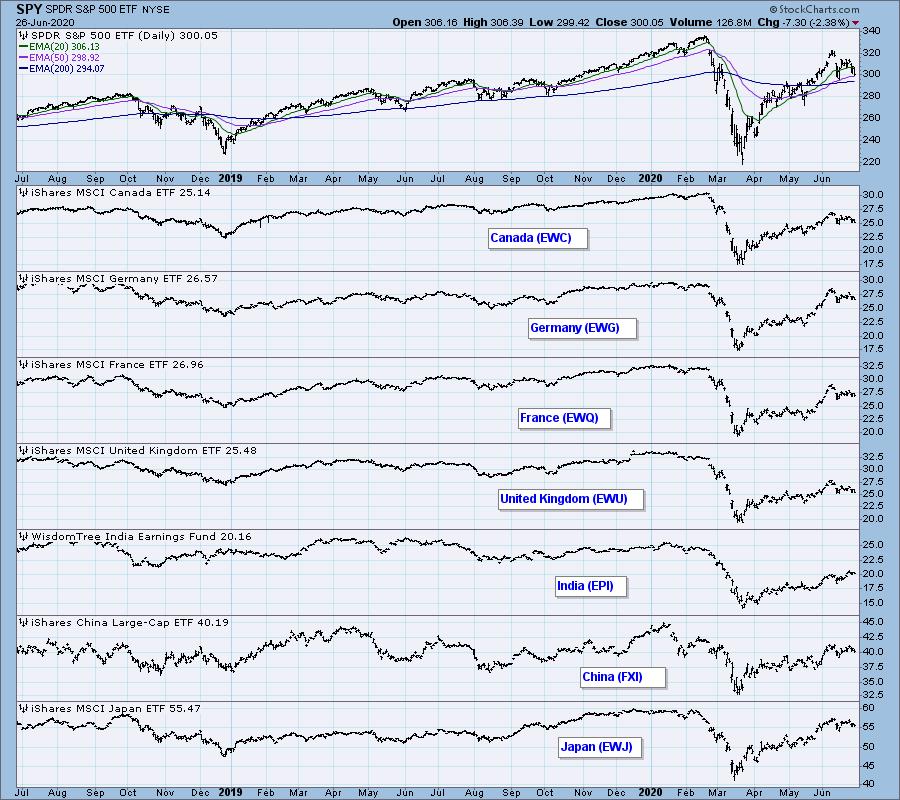
GLOBAL MARKETS
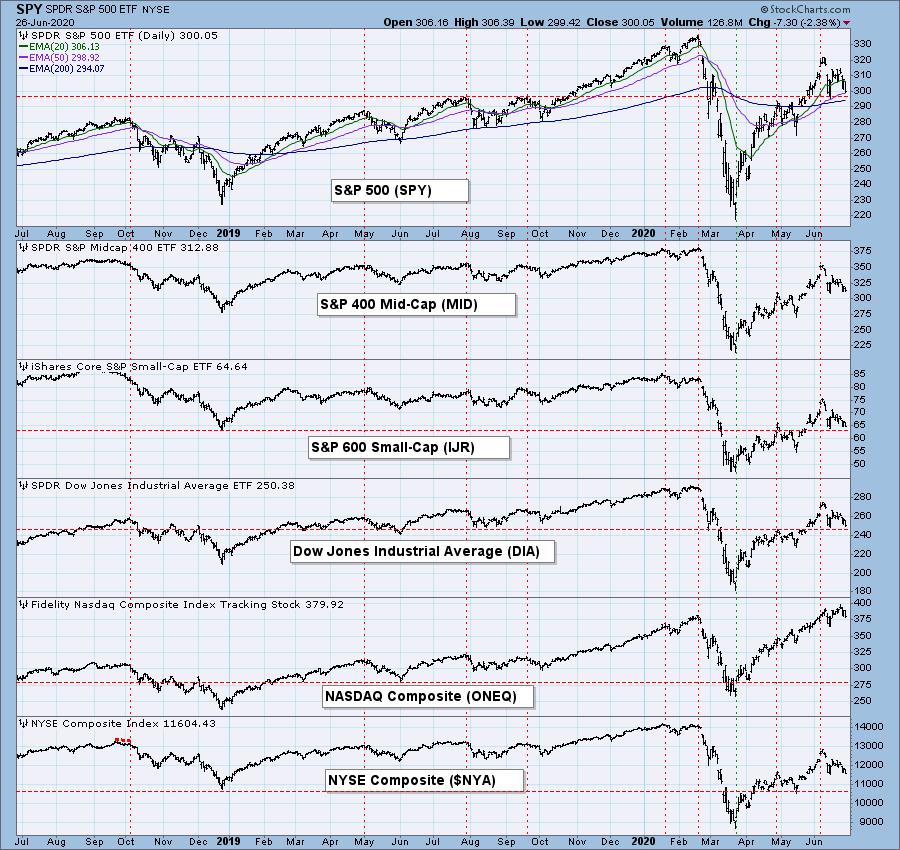
BROAD MARKET INDEXES
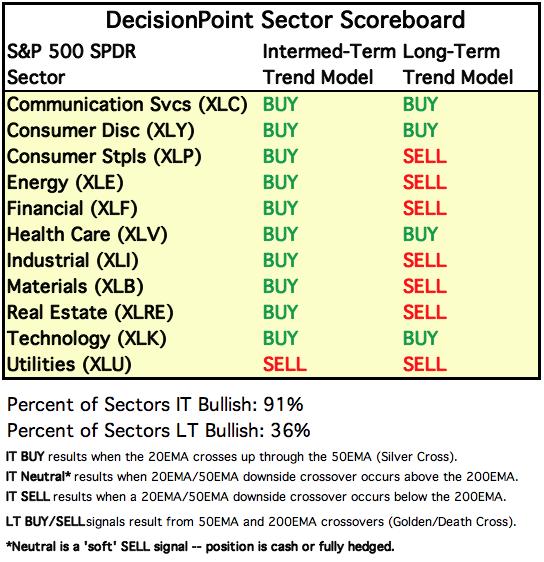
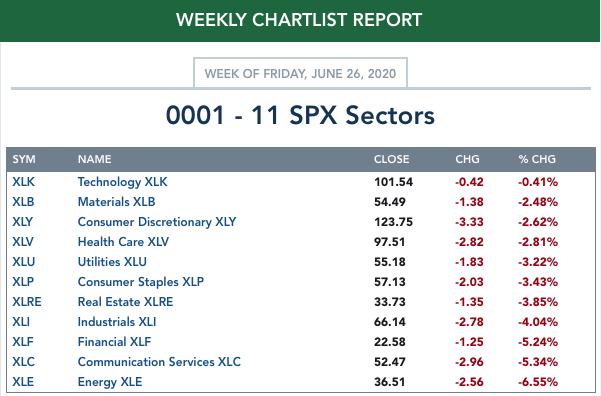
SECTORS
Each S&P 500 Index component stock is assigned to one, and only one, of 11 major sectors. This is a snapshot of the Intermediate-Term (Silver Cross) and Long-Term (Golden Cross) Trend Model signal status for those sectors.
ETF TRACKER: This is a list of about 100 ETFs intended to track a wide range of U.S. market indexes, sectors, global indexes, interest rates, currencies, and commodities. StockCharts.com subscribers can acquire it in the DecisionPoint Trend and Condition ChartPack.
Top 10 . . .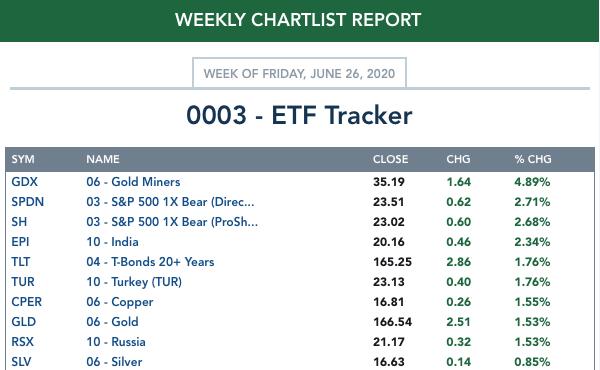
. . . and bottom 10: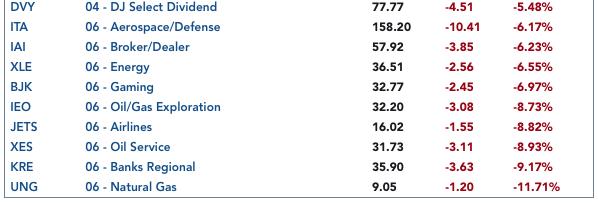
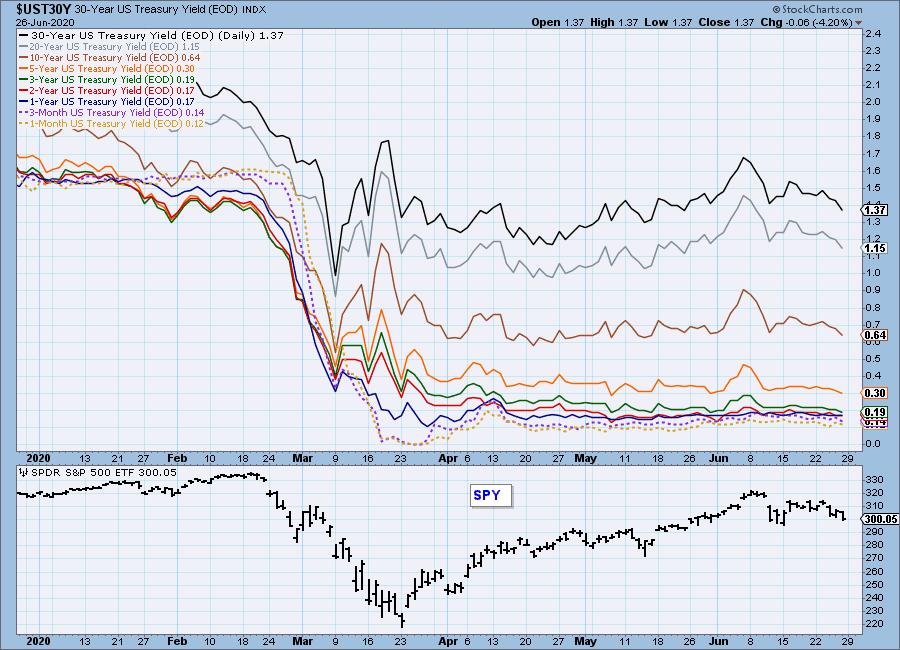
INTEREST RATES
This chart is included so we can monitor rate inversions. In normal circumstances the longer money is borrowed the higher the interest rate that must be paid. When rates are inverted, the reverse is true.
STOCKS
IT Trend Model: BUY as of 5/8/2020
LT Trend Model: BUY as of 6/8/2020
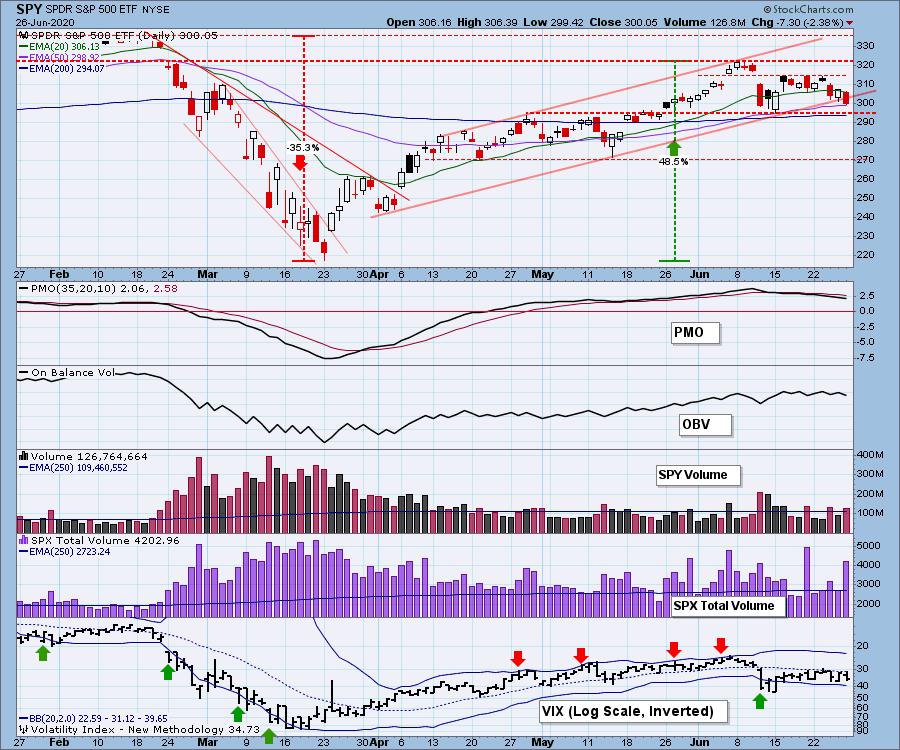
SPY Daily Chart: SPY broke down through the rising trend line on Friday, but the more significant support is the horizontal line just below the 200EMA. If that is taken out, I think it will be a serious problem.
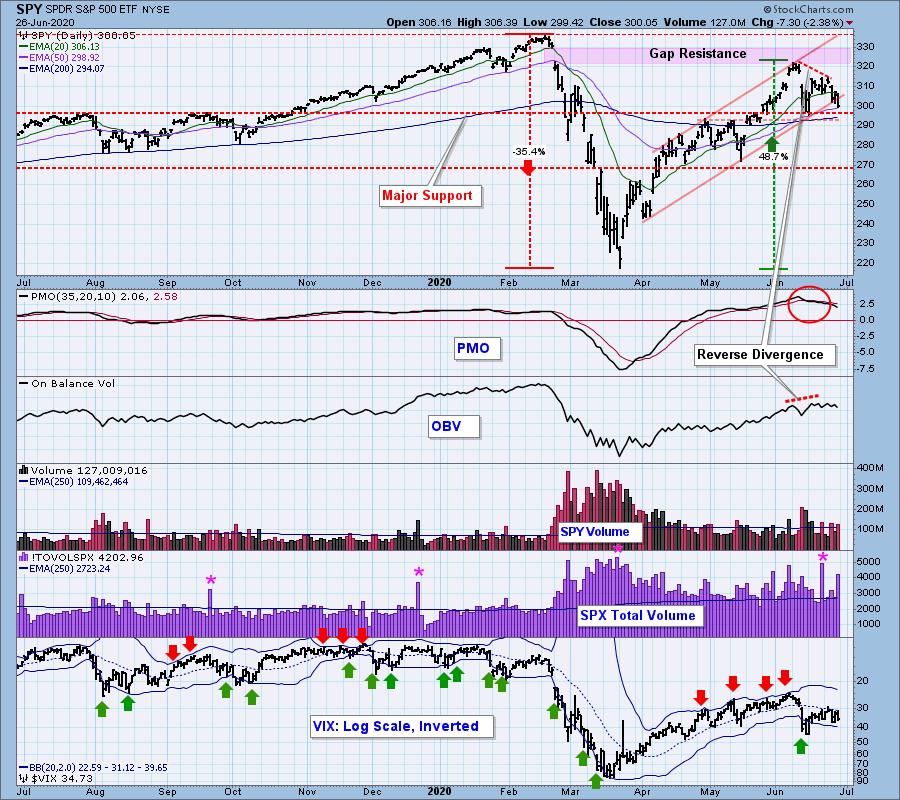
This one-year chart shows just how far back that horizontal support goes.
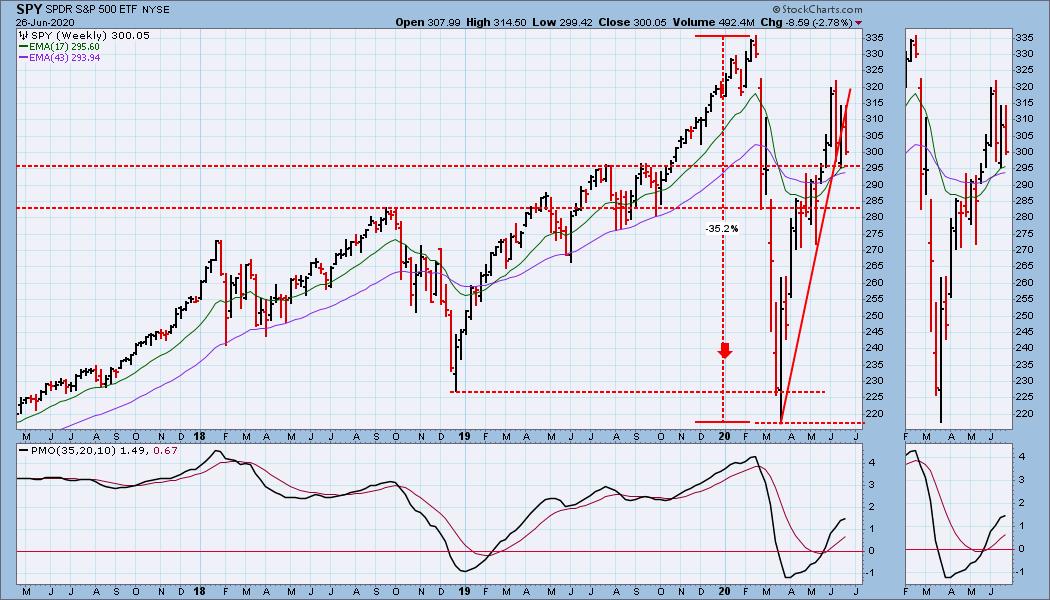
SPY Weekly Chart: The steep rising trend line drawn from the March low was broken last week, but price closed just above the line. This week, the breakdown looks decisive. The weekly PMO is trying to top.
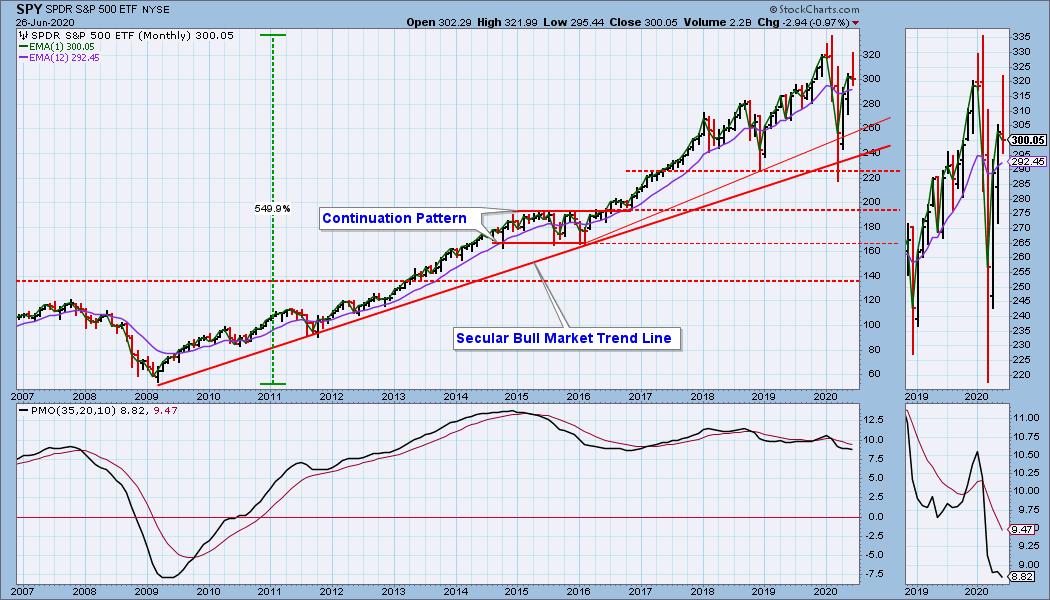
S&P 500 Monthly Chart: The monthly charts won't be final until Tuesday, but it's always best if we can cover them at week end. Currently, SPY is closing down for the month, and the weekly PMO is falling below the signal line. Definitely looks like an important top.
Climactic Market Indicators: The SPX Total Volume on Friday was 154% of the one-year daily average, and because of that and the fact that price has been trending down for two weeks, I'm going to speculate that it was a downside exhaustion climax. That may mean that the short down trend is over, or it might just mean we'll get a one-day bounce on Monday.
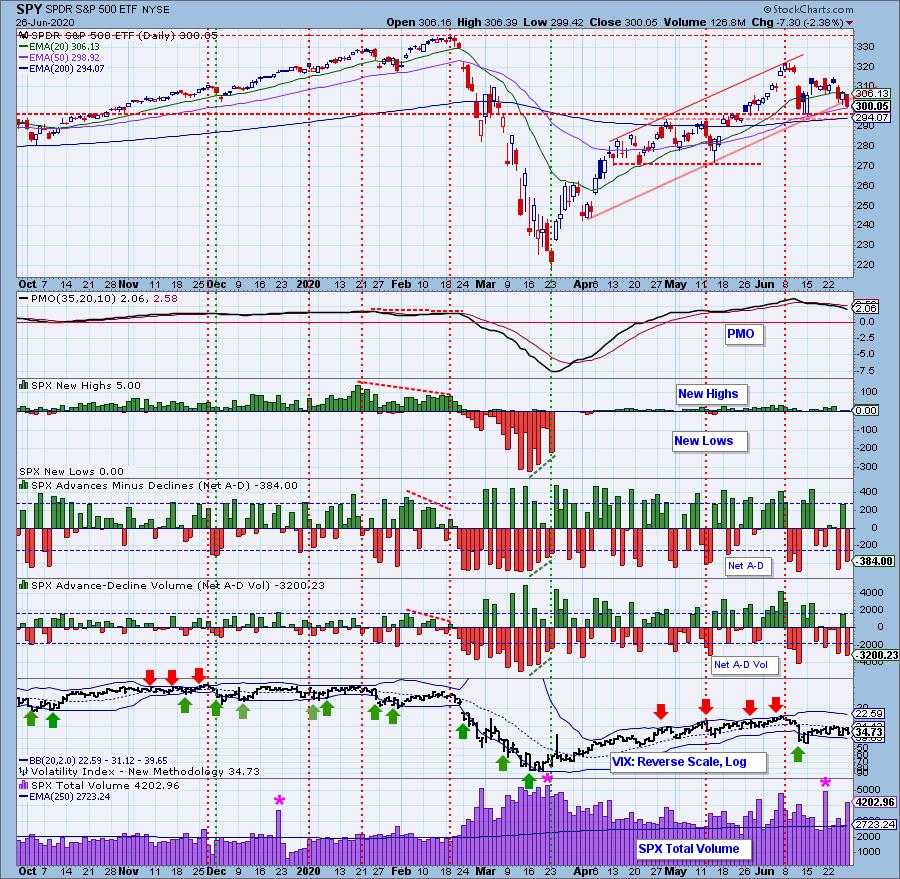
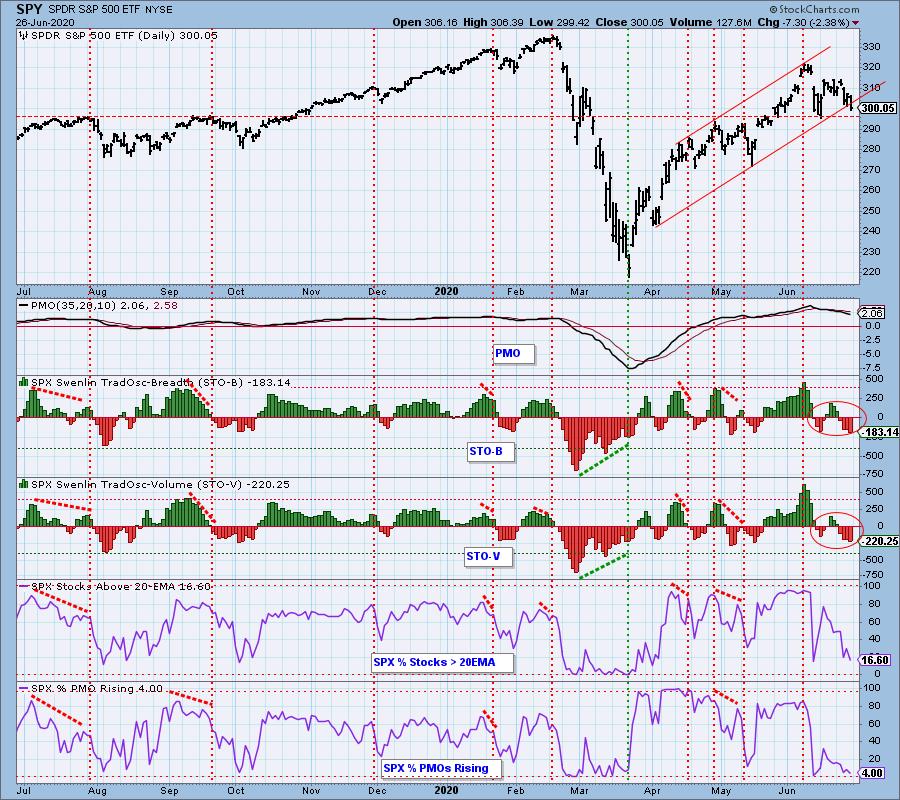
Short-Term Market Indicators: The short-term market trend is DOWN and the condition is OVERSOLD. The market bias in this time frame, based upon the last two weeks of STO movement, is NEUTRAL.
Intermediate-Term Market Indicators: The Silver Cross Index is dropping from very overbought levels. The Golden Cross Index shows that most stocks have not recovered in the longer time frame.
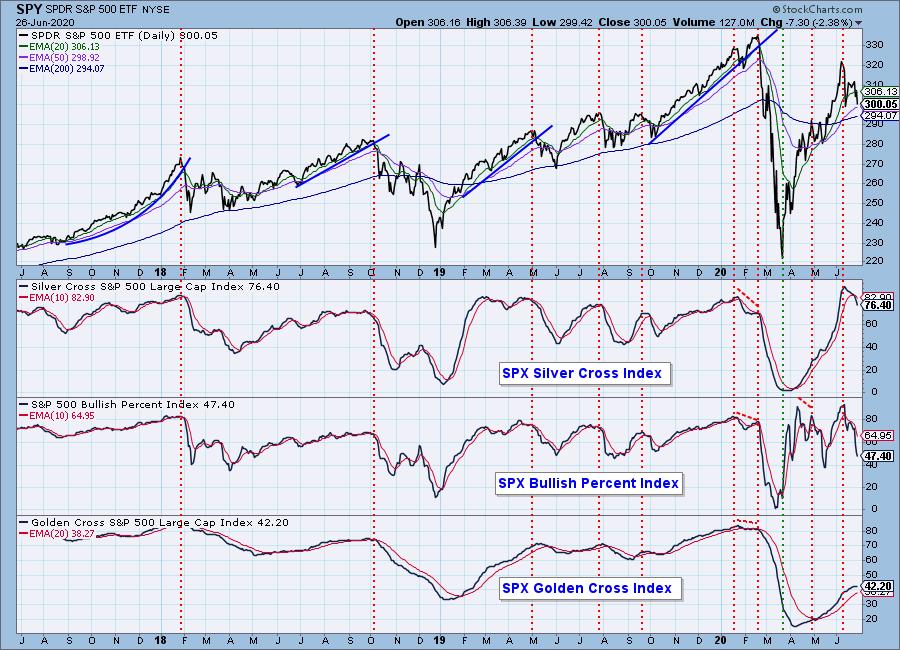
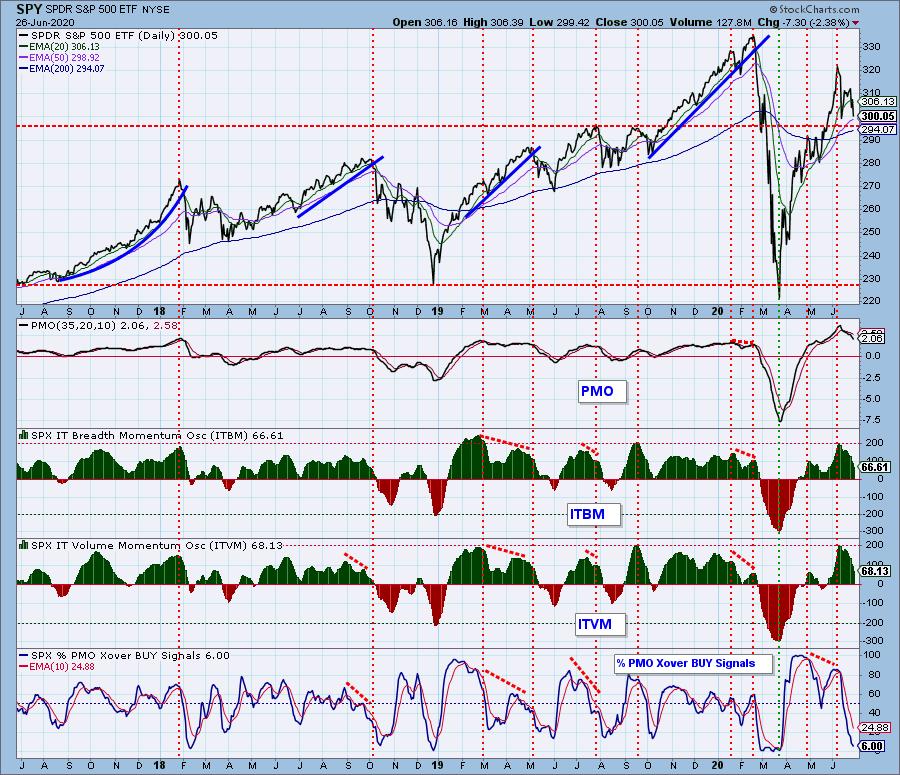
The intermediate-term market trend is UP but rolling over, and the condition is NEUTRAL. The Percent of Crossover BUY Signals is oversold, but in March it stayed oversold for abut a month.
CONCLUSION: As I stated in my lead item, the Technology Sector is looking especially vulnerable, certainly as vulnerable as it was in February, and the other ten S&P sectors are not preforming as well as Technology. Yet, in spite of SPY weakness this week, the market just didn't seem to want to let go and collapse. The reason for that, I think, is the support line at 295 (SPX 2950) just below the close. If that support goes, the current down leg could be extended by a lot.
An important point I made earlier, the current setup for the stock market resembles the the setup in February, just before the crash. I'm not predicting another crash, but I think that we could see a substantial pullback. In fact, the market is already down about -7% from the top of three weeks ago. Obviously, I can't see the future, but the present is looking about as precarious as it can look.
Have you subscribed the DecisionPoint Diamonds yet? DP does the work for you by providing handpicked stocks/ETFs from exclusive DP scans! Add it with a discount! Contact support@decisionpoint.com for more information!
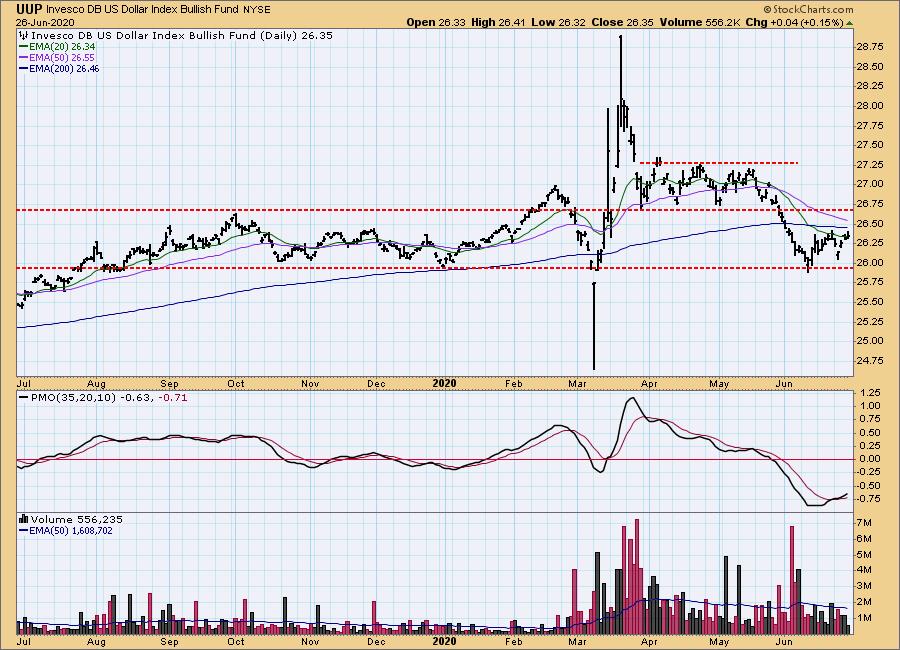
DOLLAR (UUP)
IT Trend Model: NEUTRAL as of 5/28/2020
LT Trend Model: BUY as of 5/25/2018
UUP Daily Chart: UUP is about midway the trading range that seems most predominant in the last year. The PMO is positive and there is a double bottom that looks promising for a rally to the top of the range.
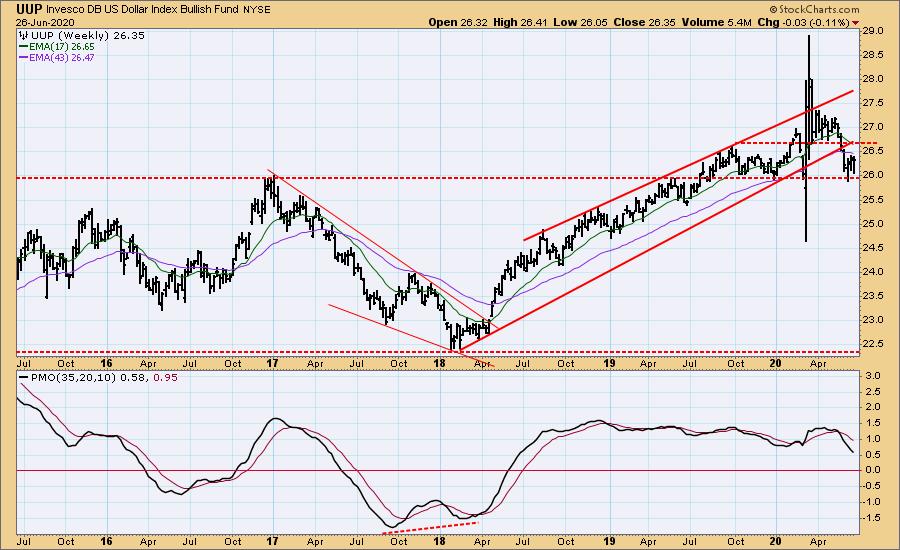
UUP Weekly Chart: The one-year support line looks pretty solid.
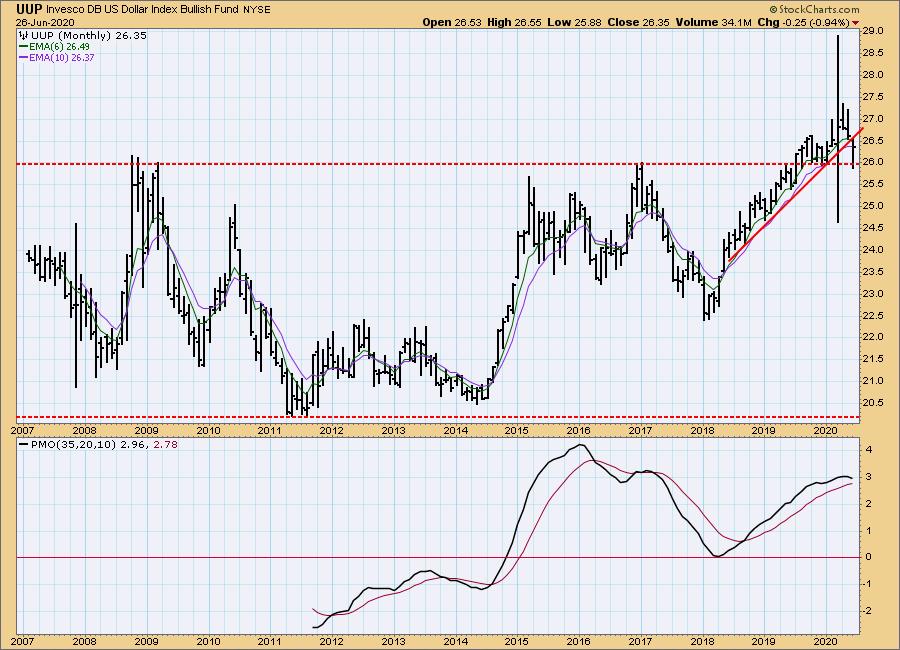
UUP Monthly Chart: And the monthly chart makes the support line even more compelling.
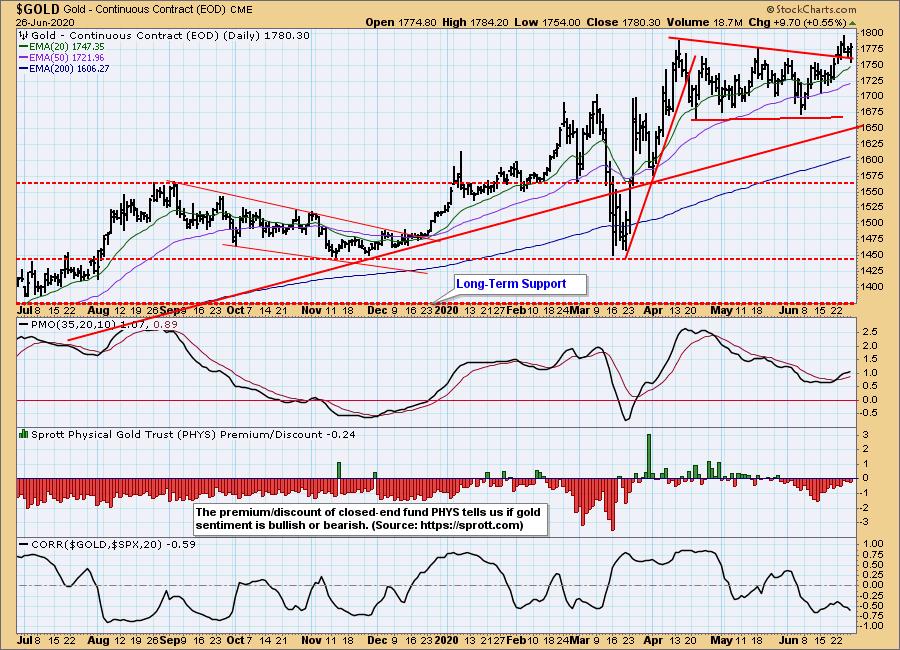
GOLD
IT Trend Model: BUY as of 3/24/2020
LT Trend Model: BUY as of 1/8/2019
GOLD Daily Chart: Gold broke out of a flag formation, has pulled back to the point of breakout, and has bounced off that support today. This is a bullish move that could extend into the next leg of the rally.
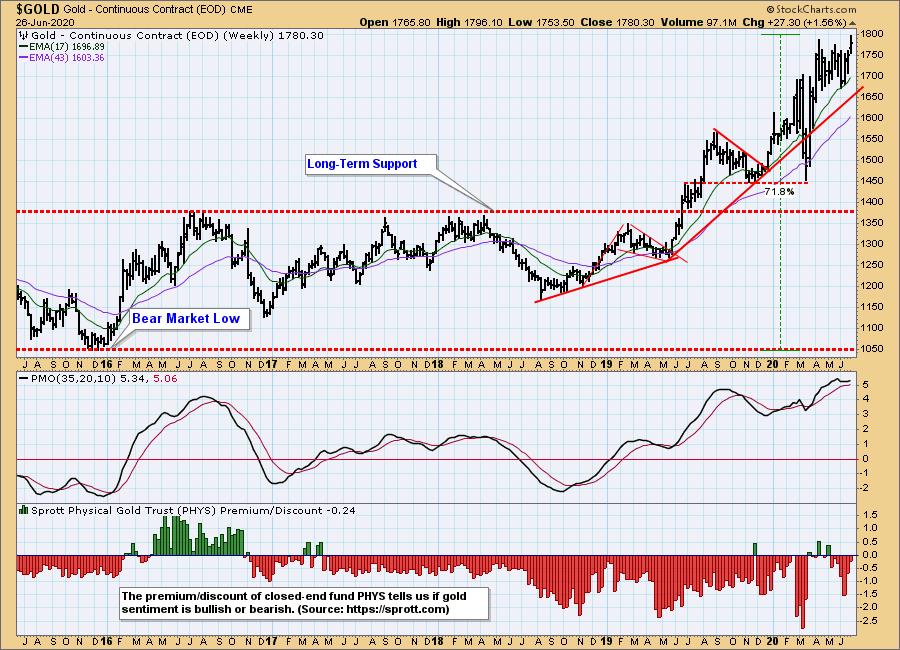
GOLD Weekly Chart: Gold made new highs for the bull market this week. Sentiment is bearish, which is a good thing.
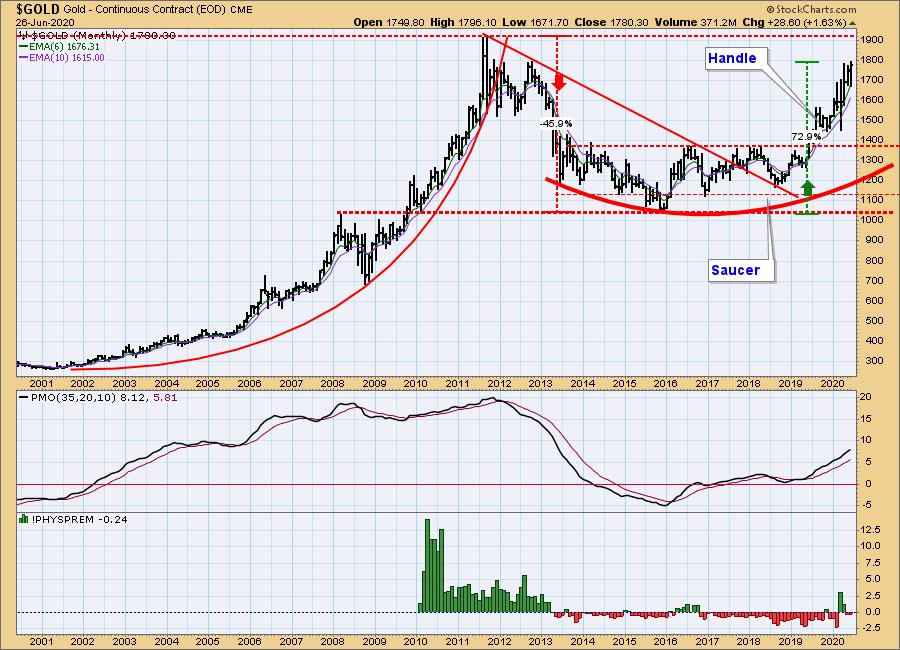
GOLD Monthly Chart: Gold is about -7% below the all-time highs, and it appears to have every chance to reach and exceed them.
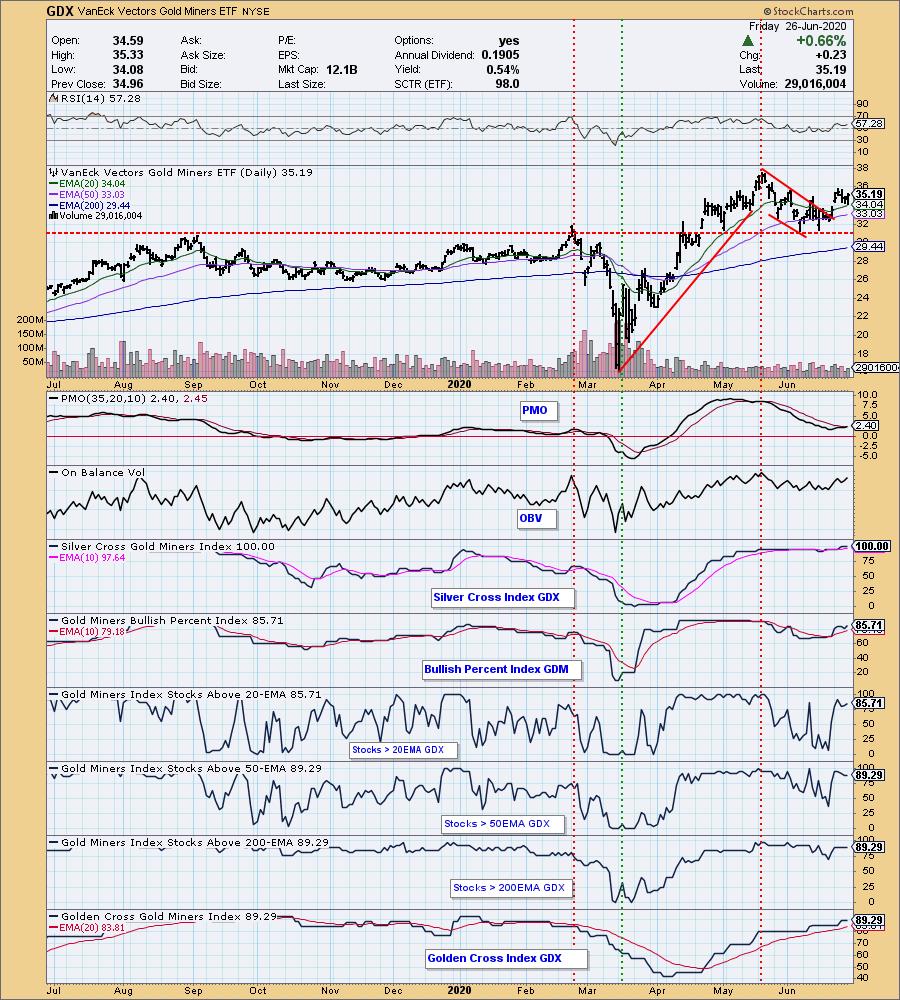
GOLD MINERS Golden and Silver Cross Indexes: Nice breakout from a flag formation. A lot of the indicators are overbought, but I think they are going to stay that way for a while.
CRUDE OIL ($WTIC)
Until further notice we will use $WTIC to track the oil market. Since this is a continuous contract dataset, it doesn't "play well" with our Trend Models, and we will not report Trend Model signals for oil.
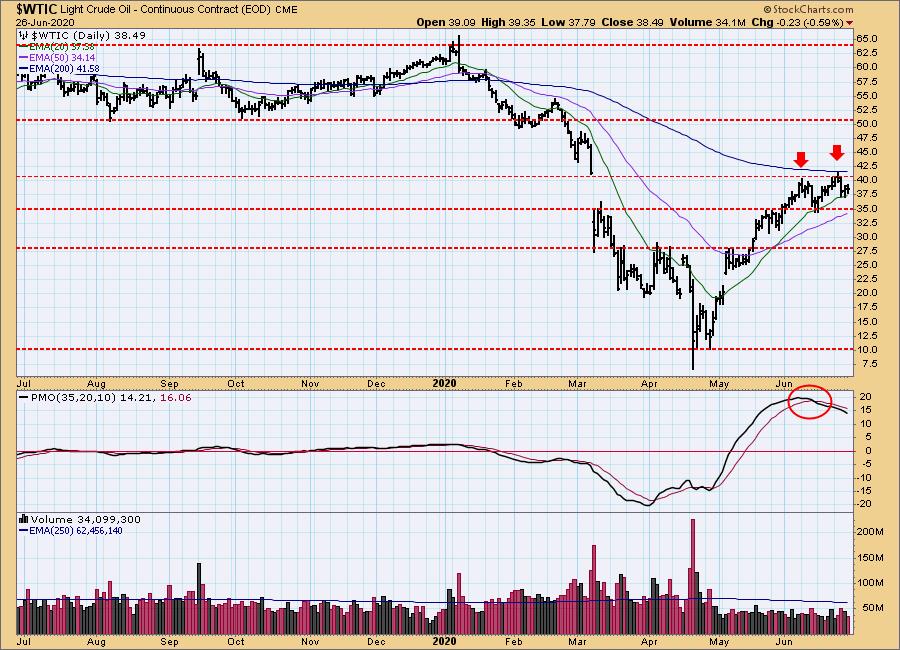
$WTIC Daily Chart: Here we have a double top, plus a PMO downside crossover ahead of the second (and higher) top. The current support at 35 looks pretty firm, but if it fails, 27.50 would be the possible next stop.
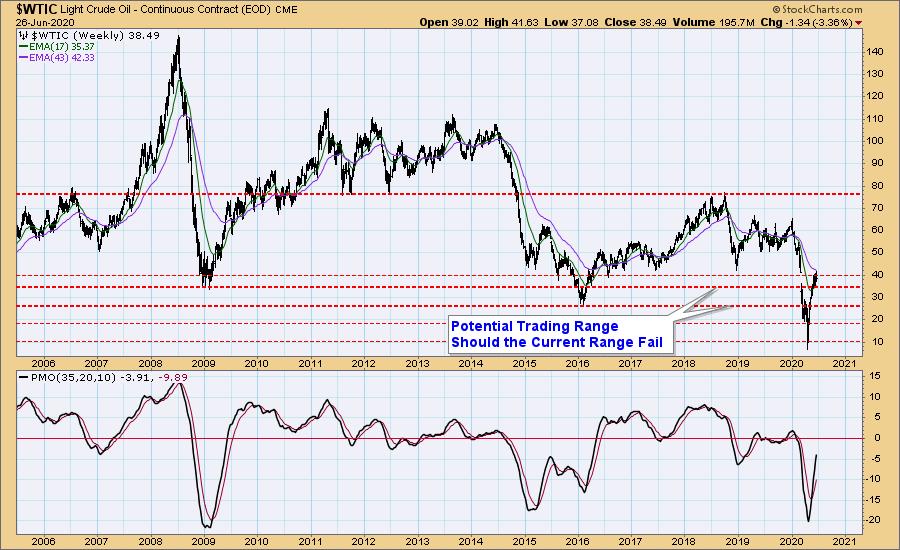
$WTIC Weekly Chart: My assessment on the daily chart is confirmed in this time frame.
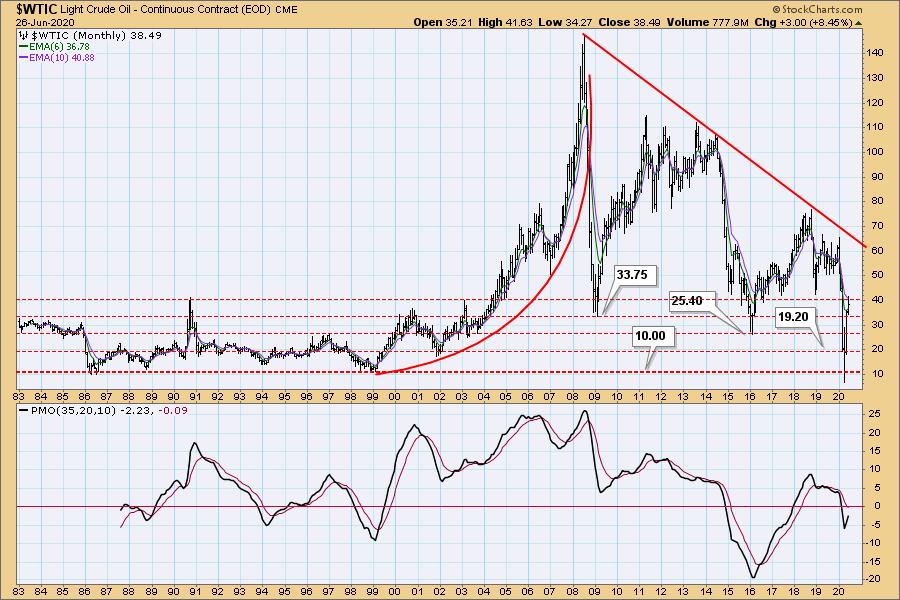
$WTIC Monthly Chart: This chart shows the long-term view, with the decline from the all-time high in 2008 down into a trading range from 10 to 35. My guess is that it will eventually settle into the 20 to 40 range.
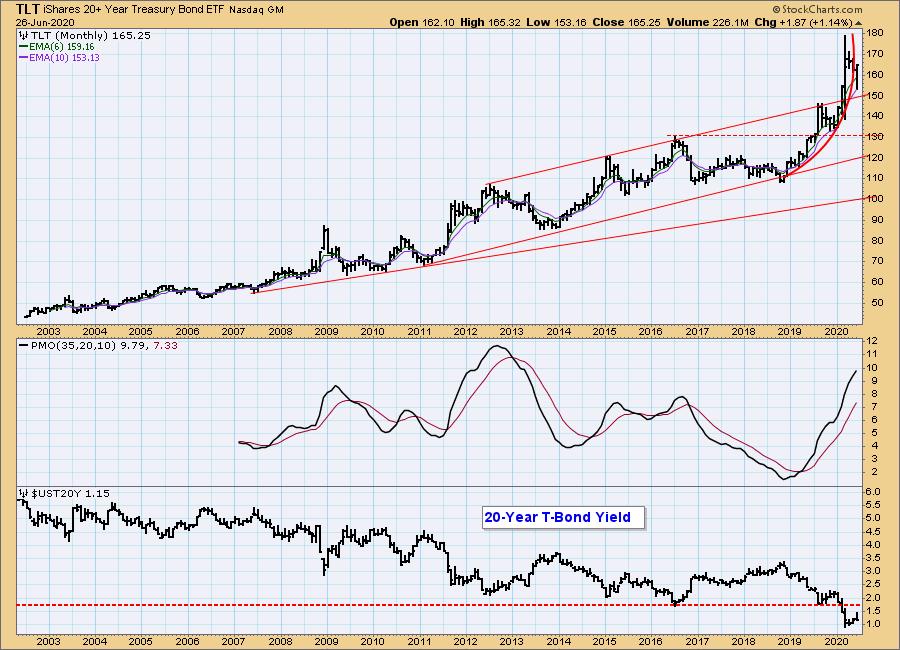
BONDS (TLT)
IT Trend Model: BUY as of 6/26/2020
LT Trend Model: BUY as of 1/2/2019
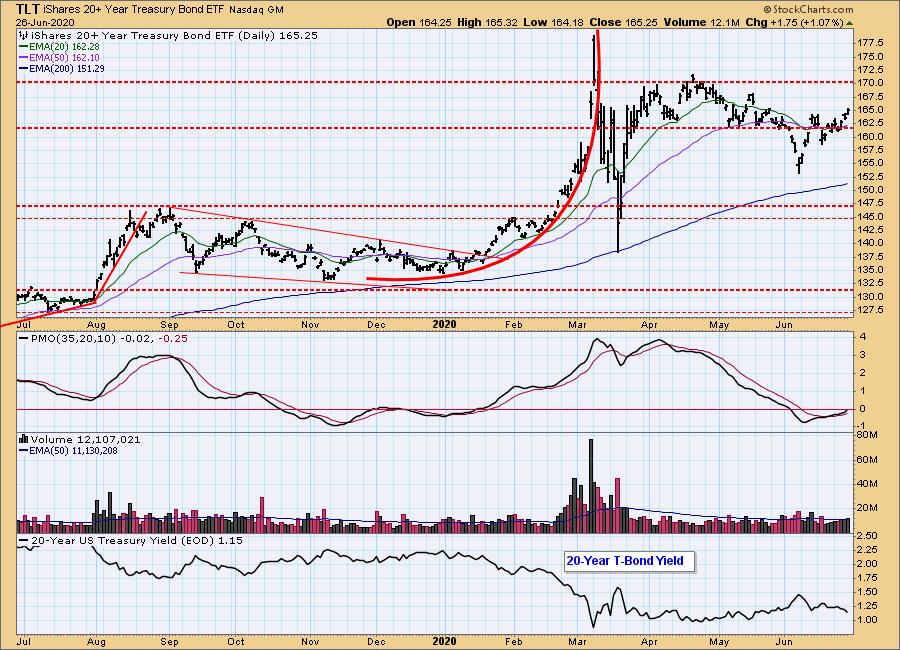
TLT Daily Chart: Today, the TLT 20EMA crossed back up through the 50EMA, generating a new IT Trend Model BUY Signal. It is doubtful that this signals a new, sustained up trend, considering the sideways movement since the end of March.
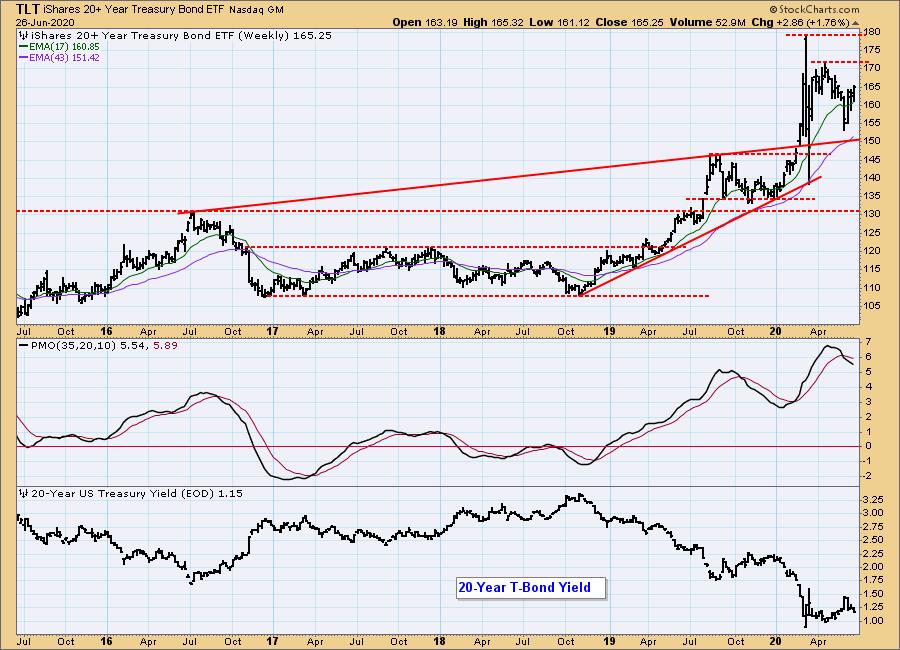
TLT Weekly Chart: Lower interest rates could drive price above recent highs, but the Fed isn't pushing that scenario yet.
TLT Monthly Chart: After the parabolic breakdown, it looks as if prices might be moving sideways for some time (high-level consolidation), but it is a little early to tell in this time frame.
Technical Analysis is a windsock, not a crystal ball.
Happy Charting! - Carl
NOTE: The signal status reported herein is based upon mechanical trading model signals, specifically, the DecisionPoint Trend Model. They define the implied bias of the price index based upon moving average relationships, but they do not necessarily call for a specific action. They are information flags that should prompt chart review. Further, they do not call for continuous buying or selling during the life of the signal. For example, a BUY signal will probably (but not necessarily) return the best results if action is taken soon after the signal is generated. Additional opportunities for buying may be found as price zigzags higher, but the trader must look for optimum entry points. Conversely, exit points to preserve gains (or minimize losses) may be evident before the model mechanically closes the signal.
Helpful DecisionPoint Links:
DecisionPoint Alert Chart List
DecisionPoint Golden Cross/Silver Cross Index Chart List
DecisionPoint Sector Chart List
Price Momentum Oscillator (PMO)
Swenlin Trading Oscillators (STO-B and STO-V)