
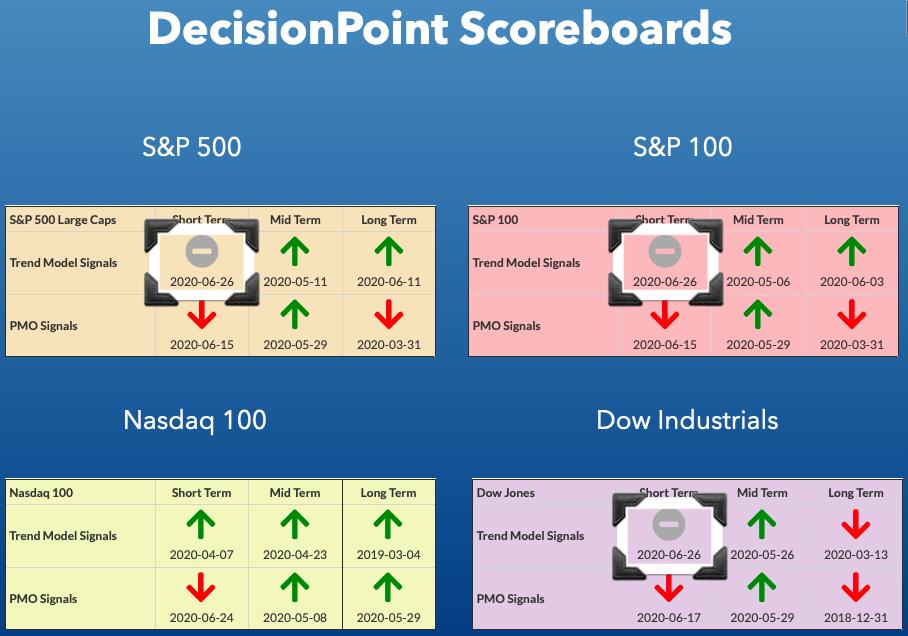
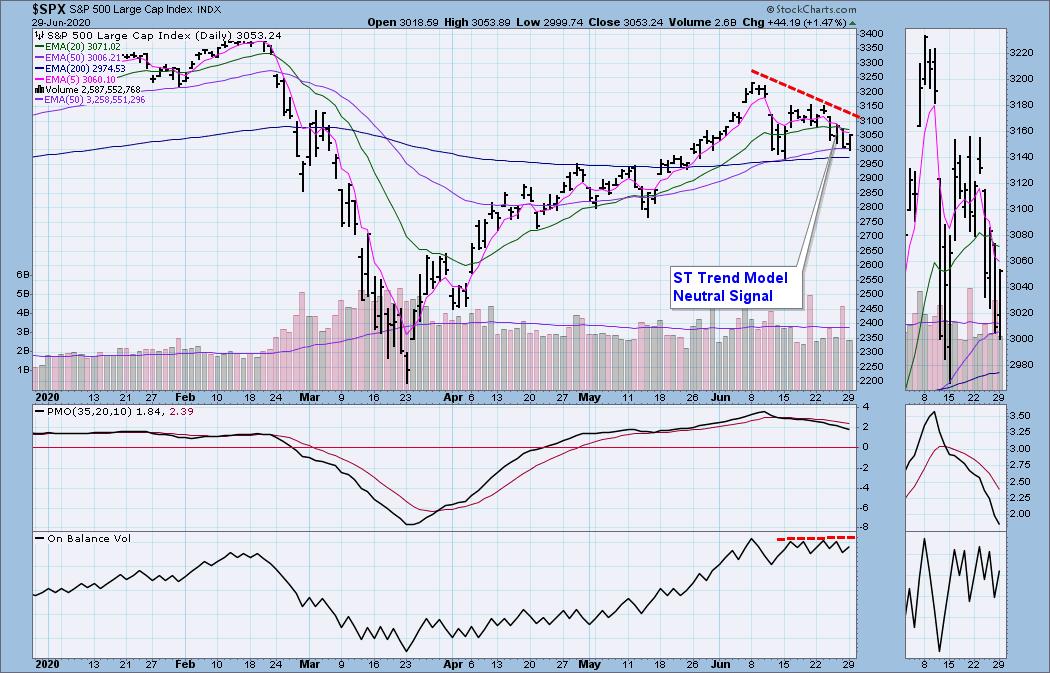
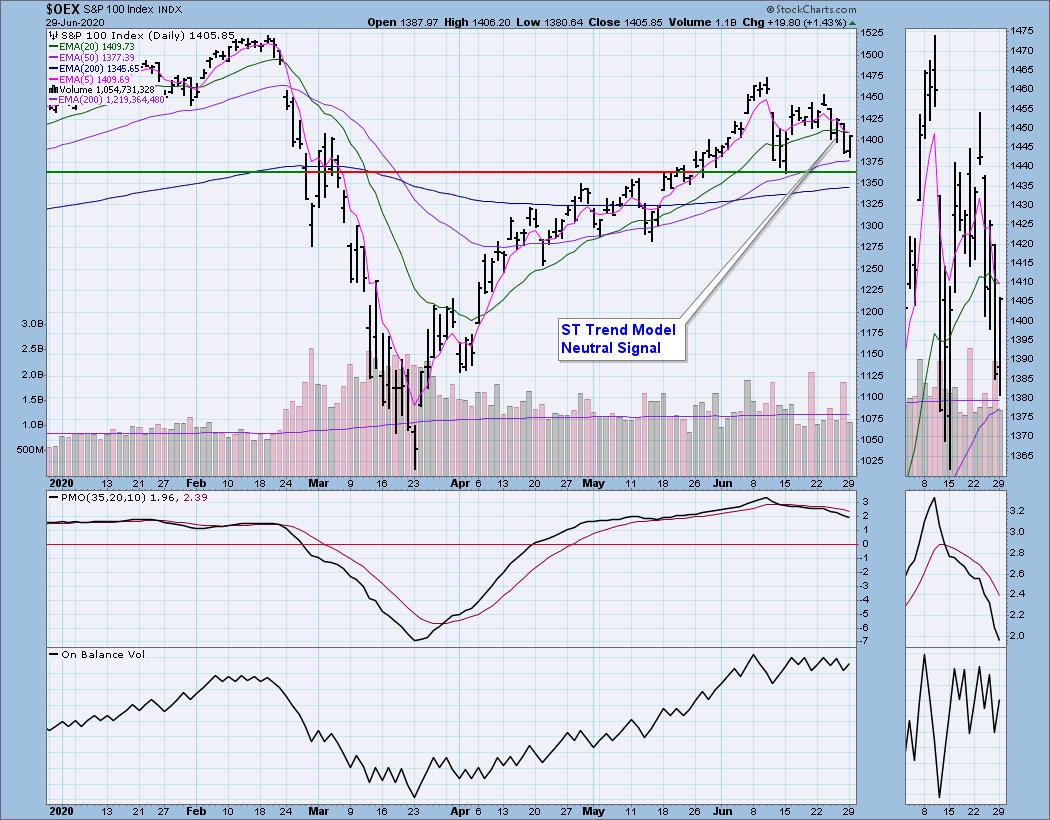
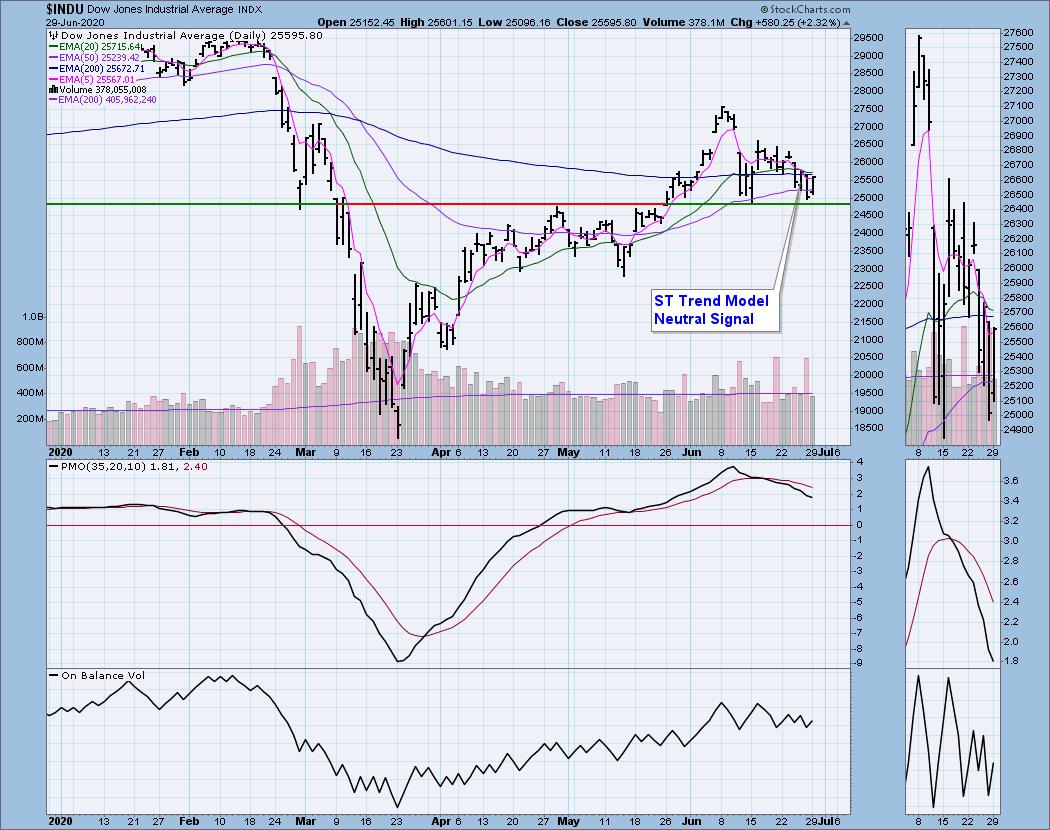
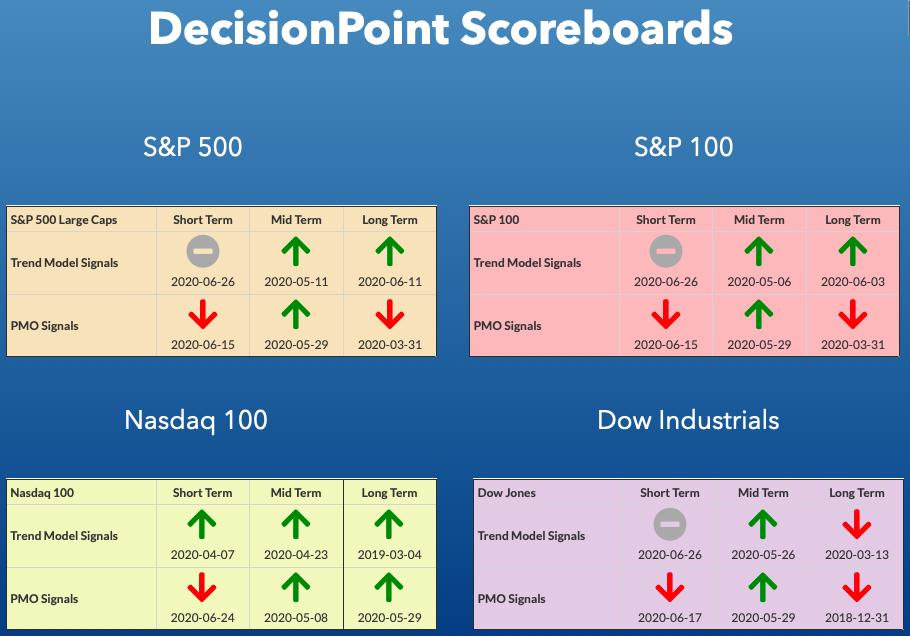
Our Short-Term Trend Model triggered three Neutral signals on the DP Scoreboards today. While that may be counterintuitive, it really tells us that there continues to be weakness under the surface and despite a nearly 1.5% gain for the SPY, it wasn't able to get back above its 5-EMA. Consequently, there was a negative crossover of the 5/20-EMAs. It is a "Neutral" signal because this negative crossover occurred above the 50-EMA. Below the Scoreboards you can see the charts that have those signal changes annotated.
** Announcement **
I will be traveling July 1 - July 15. I will be writing on the road, but broadcasting will likely be suspended during that time. It's going to be an adventurous road trip for me and my husband. We will be taking a train from Los Angeles to New Orleans, visiting family, checking out retirement areas and then renting a car to make our way back to California with various sightseeing stops along the way. I'll be sure to post a picture or two and I'm sure I'll have funny stories to share along the way. It'll be interesting to see the various stages of the reopening of America. A heads up to Bundle subscribers, the LIVE Trading Room is on hiatus as Mary Ellen will also be out of pocket in the upcoming month. We hope to reopen in late-July. Please direct questions to erin@decisionpoint.com.
DP INDEX SCOREBOARDS:
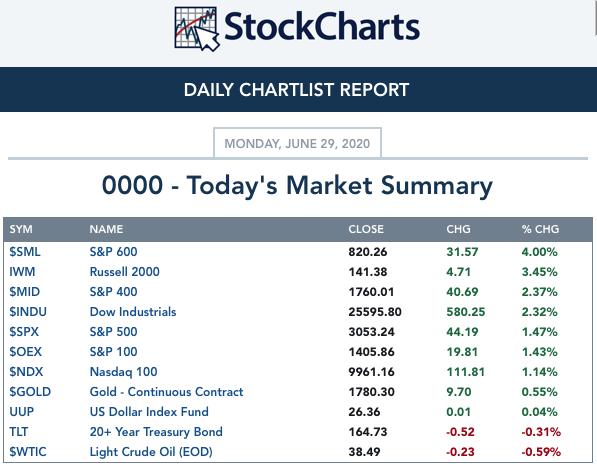
TODAY'S Broad Market Action:
One WEEK Results: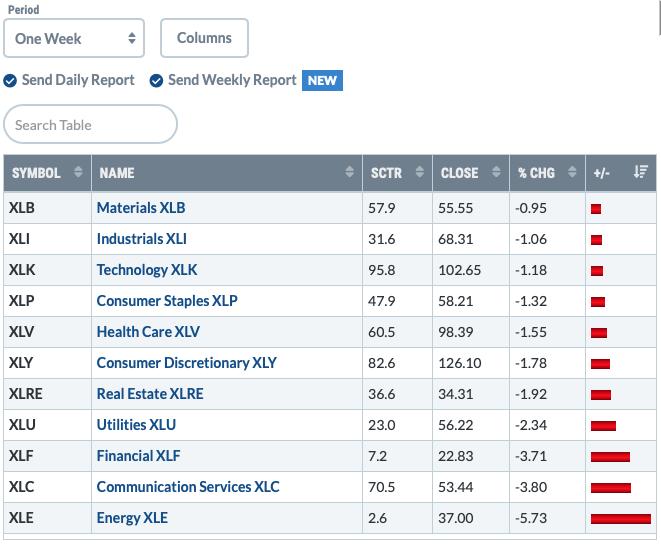
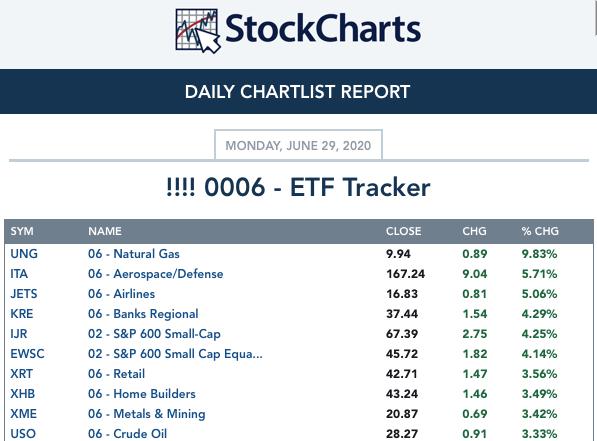
Top 10 from ETF Tracker:
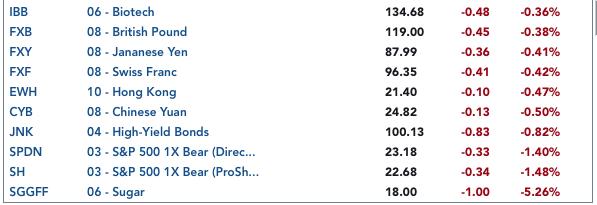
Bottom 10 from ETF Tracker:
On Friday, the DecisionPoint Alert Weekly Wrap presents an assessment of the trend and condition of the stock market (S&P 500), the U.S. Dollar, Gold, Crude Oil, and Bonds. Monday through Thursday the DecisionPoint Alert daily report is abbreviated and covers changes for the day.
Watch the latest episode of DecisionPoint on StockCharts TV's YouTube channel here!
SECTORS
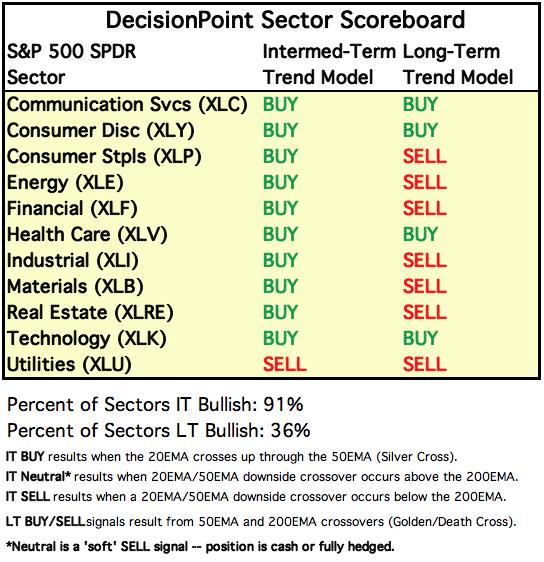
SIGNALS:
Each S&P 500 Index component stock is assigned to one, and only one, of 11 major sectors. This is a snapshot of the Intermediate-Term (Silver Cross) and Long-Term (Golden Cross) Trend Model signal status for those sectors.
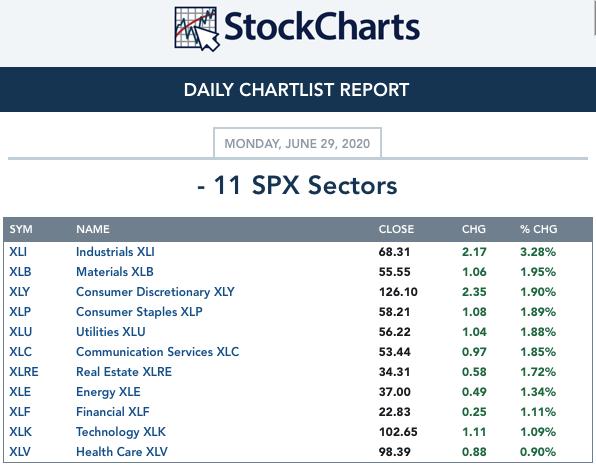
TODAY'S RESULTS:
One WEEK Results: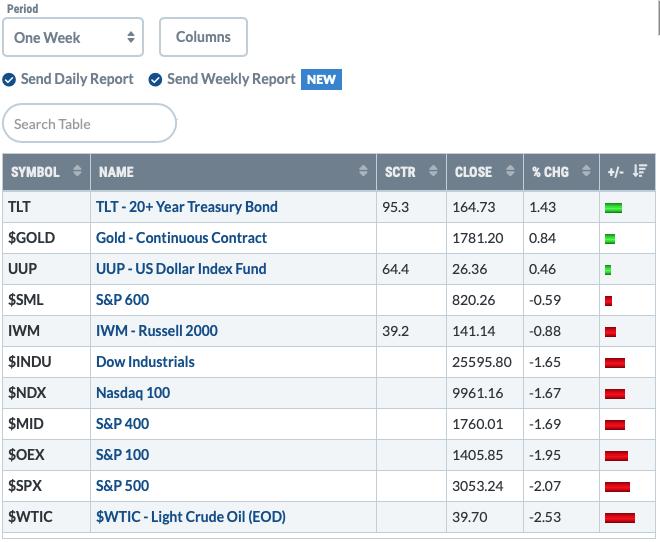
STOCKS
IT Trend Model: BUY as of 5/8/2020
LT Trend Model: BUY as of 6/8/2020
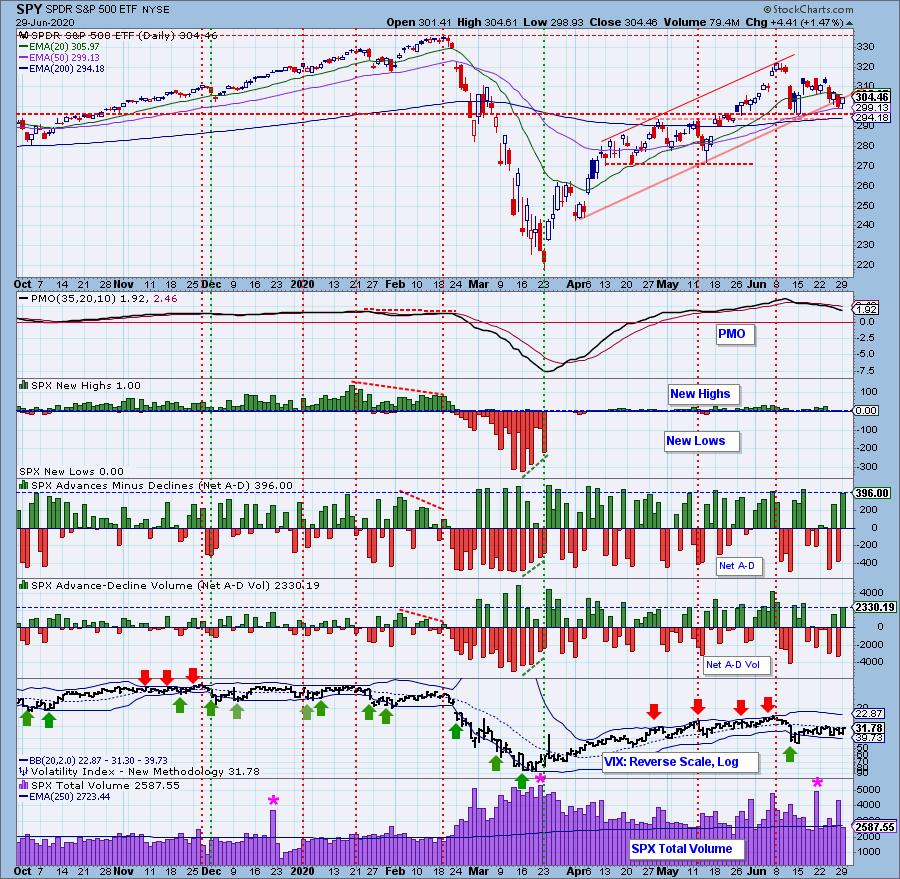
SPY Daily Chart: The market closed near its high for the day which is encouraging. What isn't encouraging is the continued declining short-term trend that has NOT been broken. As noted last week, there is strong support right here for the SPY--200-EMA, two horizontal support levels and the 50-EMA. We have a bearish bias in the short term that would suggest a breakdown here, but market players have been digging in, working on avoiding a breakdown.
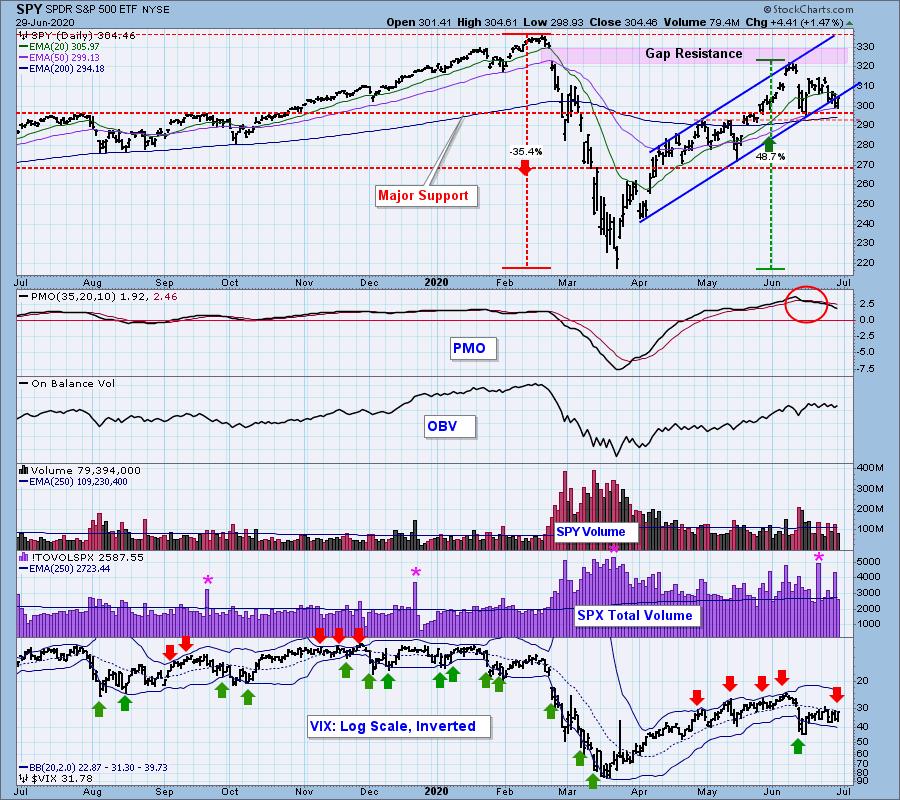
Climactic Market Indicators: We had positive climactic readings. I'm a bit stuck here. Typically I look at the previous trend of the market to determine if it is a buying exhaustion or initiation to higher prices. We have a declining trend so I would normally go with a buying initiation. Yet the VIX remains below its moving average which suggests weakness. Today was a rally 'pop' which came off the climactic negative readings from Friday. So I will go with a "soft" buying initiation here. Support should hold but I wouldn't look for a big rally "pop".
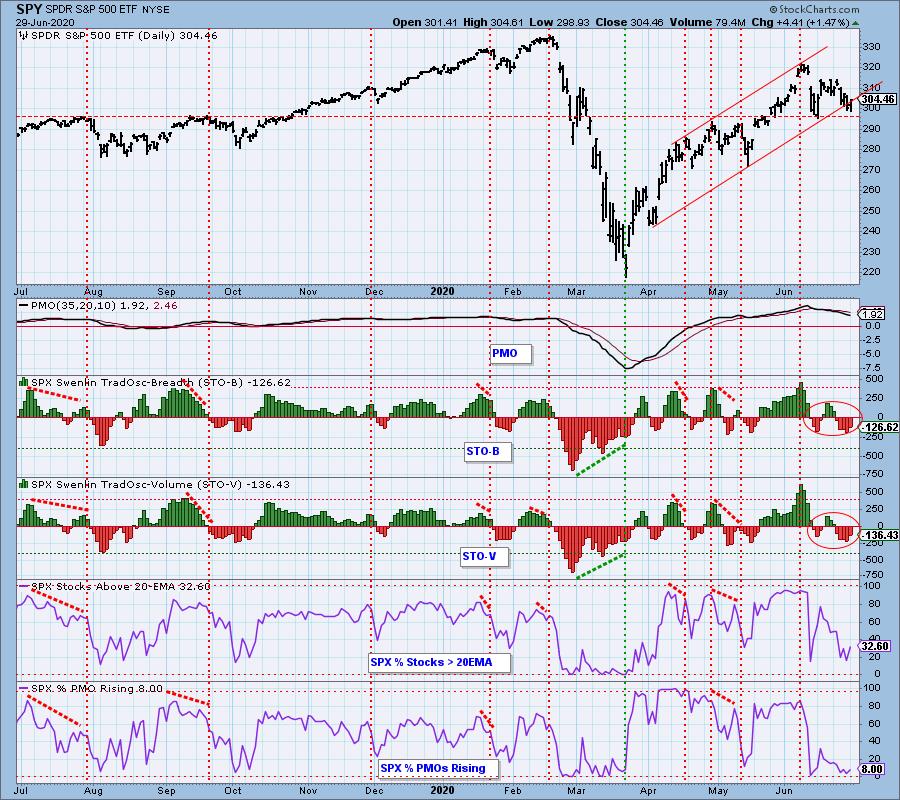
Short-Term Market Indicators: The short-term market trend is BEARISH and the condition is OVERSOLD. Based upon the STO ranges, market bias is BEARISH. Seeing so much red on the Swenlin Trading Oscillators (STOs) leads me to believe there is a short-term bearish bias. This is another reason I wouldn't look for a big rally. I do like the %Stocks indicators turning up today though.
Intermediate-Term Market Indicators: The Silver Cross Index (% of SPX stocks 20EMA > 50EMA) and the Golden Cross Index (% of SPX stocks 50EMA > 200EMA) are falling. Somewhat surprising to see the sensitive BPI only halt its decline and not turn back up on a big rally. The SCI and GCI are bearish.
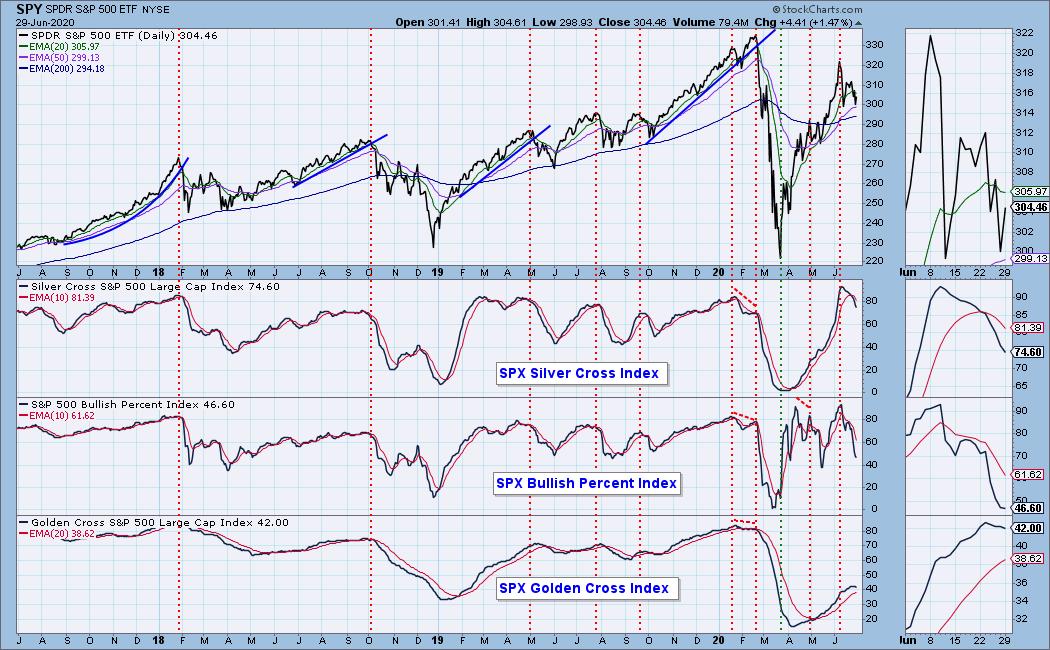
The intermediate-term market trend is UP and the condition is NEUTRAL. With most of the ITBM/ITVM readings since the end of April being above the zero lines, the market bias is BULLISH. These indicators are in decline, but given all of the "green" we have to assume a bullish market bias for the intermediate term.
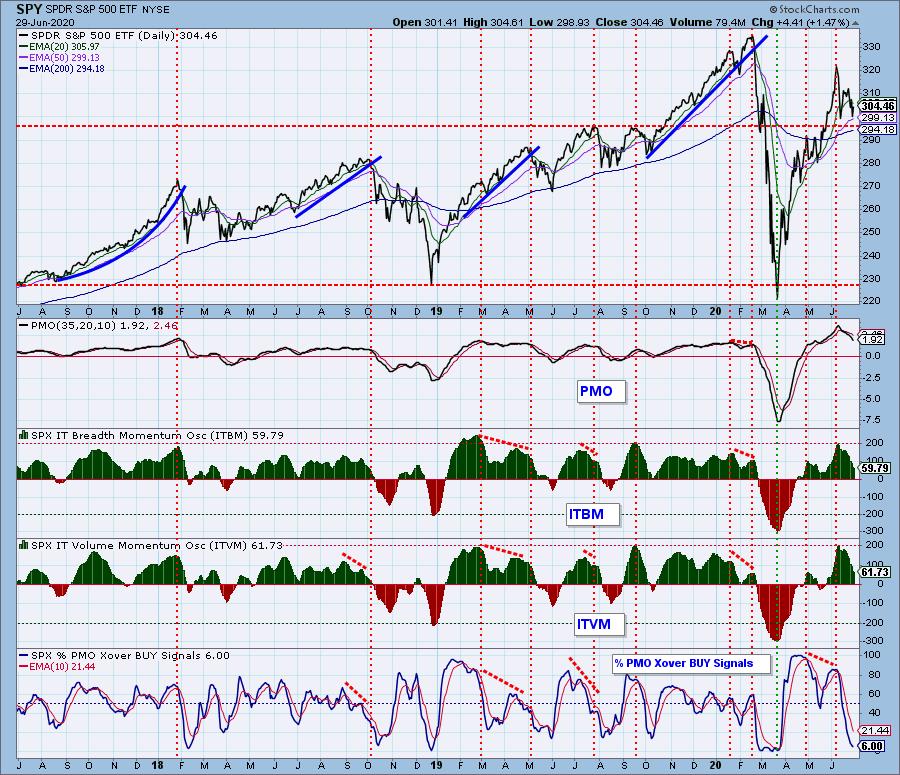
CONCLUSION: The indicators are suggesting short-term weakness. The VIX is below its average, STOs & ITBM/ITVM are declining and the SCI and GCI are quite negative. However, there is a bright spot. The %Stocks indicators are beginning to turn up in oversold territory and today's climactic indicators could be signaling another up day. My opinion is we should hold the current support area even should be see a decline.
DOLLAR (UUP)
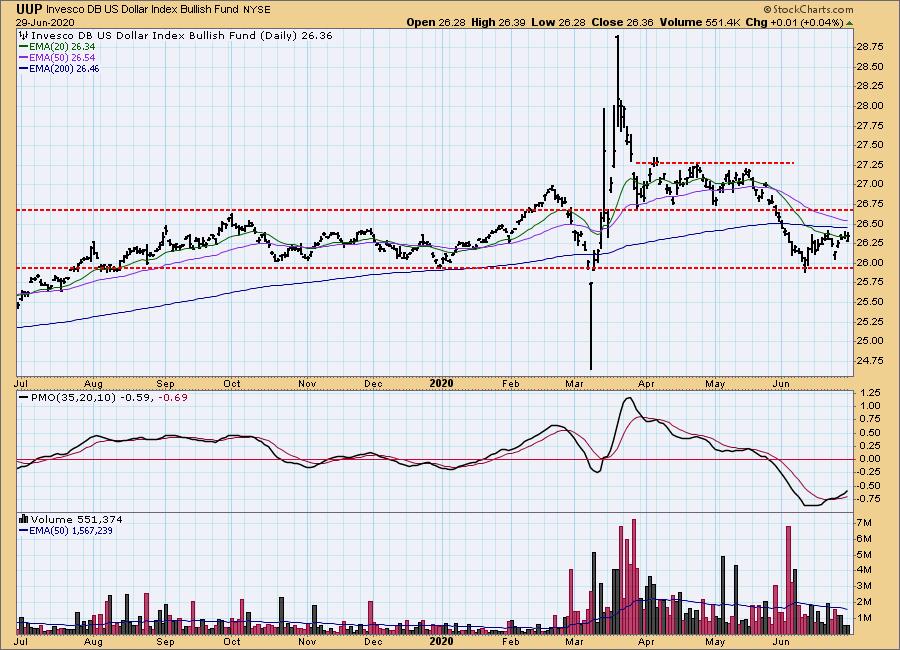
IT Trend Model: NEUTRAL as of 5/28/2020
LT Trend Model: BUY as of 5/25/2018
UUP Daily Chart: Price stalled at the previous June top, but given the short-term rising trend and the rising PMO that is on a BUY signal, I expect it to get back up to $26.75 to test overhead resistance.
GOLD
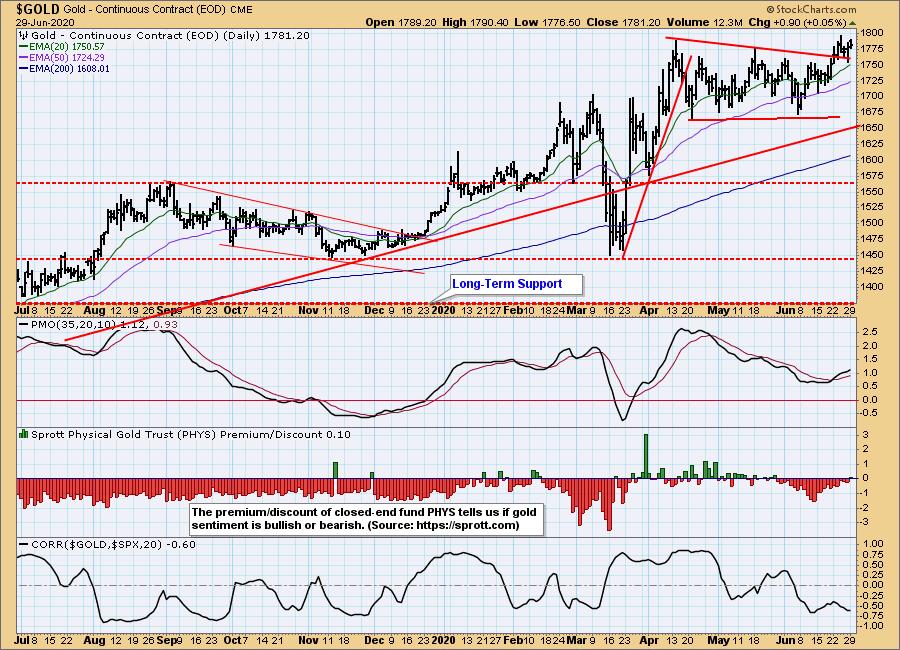
IT Trend Model: BUY as of 3/24/2020
LT Trend Model: BUY as of 1/8/2019
GOLD Daily Chart: Gold was mostly unchanged today. The PMO BUY signal is intact and it is rising. We saw a premium on PHYS which could be considered bearish for Gold, but it wasn't really high enough to worry me. Currently Gold is moving in the opposite direction of the market, so if this market weakness plays out with a breakdown, that will be good for Gold.
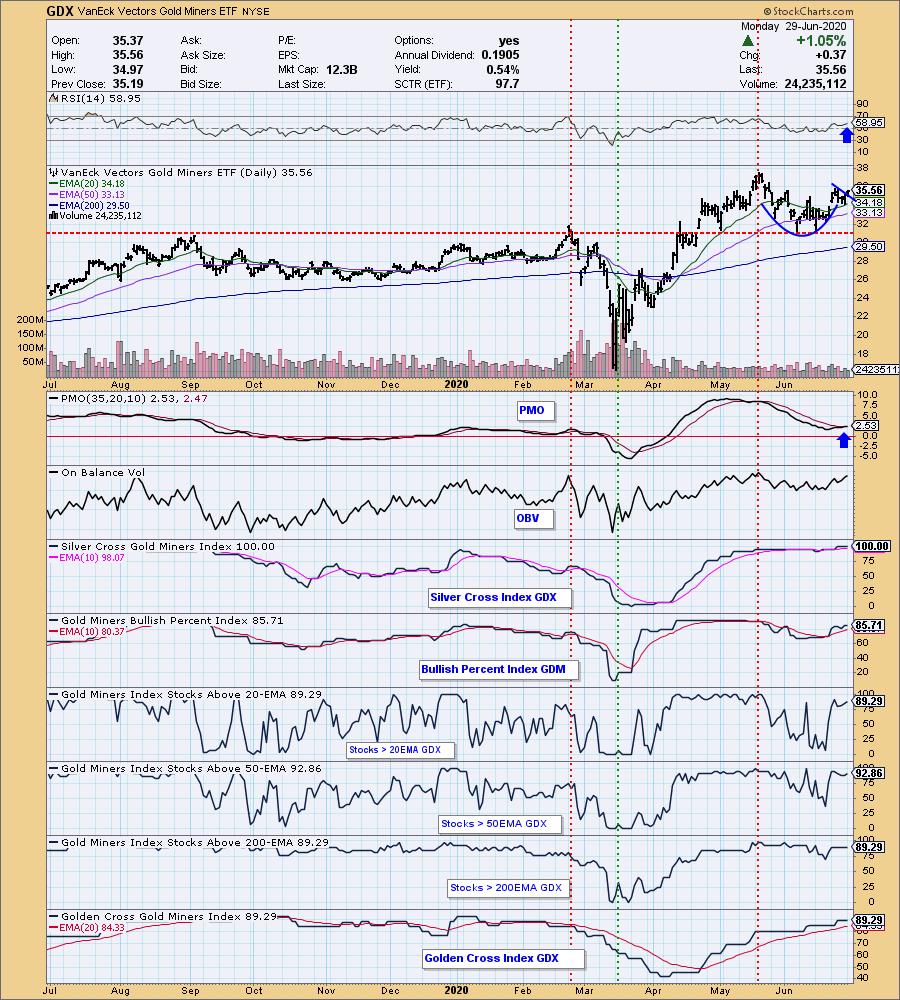
GOLD MINERS Golden and Silver Cross Indexes: I spy a textbook cup and handle pattern on GDX. Today would mark a breakout from the handle. The PMO just triggered a BUY signal. Certainly the indicators are all very overbought, but note that these indicators overbought conditions--just look at mid-April to mid-May.
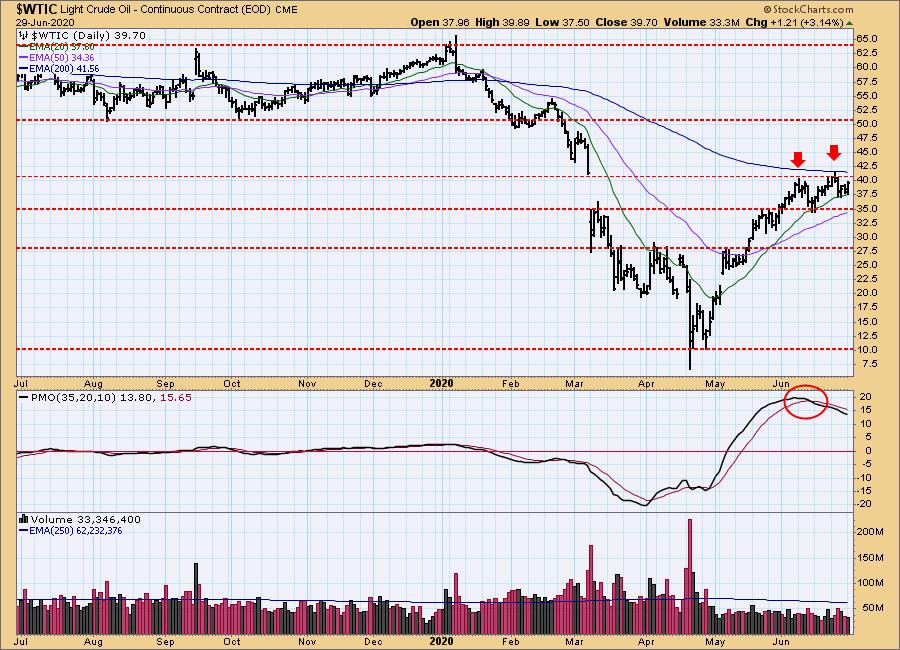
CRUDE OIL ($WTIC)
The oil market is under severe pressure due to a lack of demand, and we do not believe that USO is an appropriate investment vehicle at this time. Until further notice we will use $WTIC to track the oil market. Since this is a continuous contract dataset, it doesn't "play well" with our Trend Models, and we will not report Trend Model signals for oil.
$WTIC Daily Chart: Overhead resistance at the 200-EMA and gap resistance continues to confound Oil. The bright side is that the 20-EMA is holding tight. Until the PMO turns to the upside, I won't look for a breakout yet.
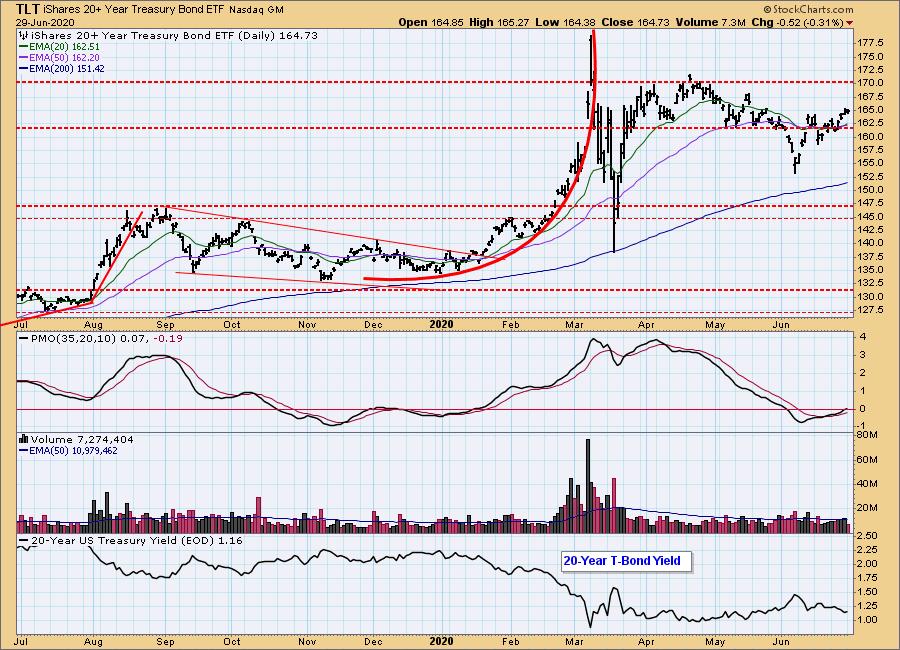
BONDS (TLT)
IT Trend Model: Neutral as of 6/5/2020
LT Trend Model: BUY as of 1/2/2019
TLT Daily Chart: We got the breakout last week for TLT. It pulled back today, but given the PMO BUY signal and its move above the zero line, I am not particularly worried. I'm considering it for my portfolio.
Have you subscribed the DecisionPoint Diamonds yet? DP does the work for you by providing handpicked stocks/ETFs from exclusive DP scans! Add it with a discount AND get the LIVE Trading Room for free! Contact support@decisionpoint.com for more information!
Technical Analysis is a windsock, not a crystal ball.
Happy Charting! - Erin
Email: erin@decisionpoint.com

Erin Swenlin will be presenting at the The MoneyShow Las Vegas August 16 - 20 at Bally's/Paris Resort! You'll have an opportunity to meet Erin and discuss the latest DecisionPoint news and Diamond Scans. Claim your FREE pass here! You can watch online with this pass too!! There will be online events held in May and when I have more information I'll let you know.
NOTE: The signal status reported herein is based upon mechanical trading model signals, specifically, the DecisionPoint Trend Model. They define the implied bias of the price index based upon moving average relationships, but they do not necessarily call for a specific action. They are information flags that should prompt chart review. Further, they do not call for continuous buying or selling during the life of the signal. For example, a BUY signal will probably (but not necessarily) return the best results if action is taken soon after the signal is generated. Additional opportunities for buying may be found as price zigzags higher, but the trader must look for optimum entry points. Conversely, exit points to preserve gains (or minimize losses) may be evident before the model mechanically closes the signal.
Helpful DecisionPoint Links (Can Be Found on DecisionPoint.com Links Page):
DecisionPoint Shared ChartList and DecisionPoint Chart Gallery
Price Momentum Oscillator (PMO)
Swenlin Trading Oscillators (STO-B and STO-V)