
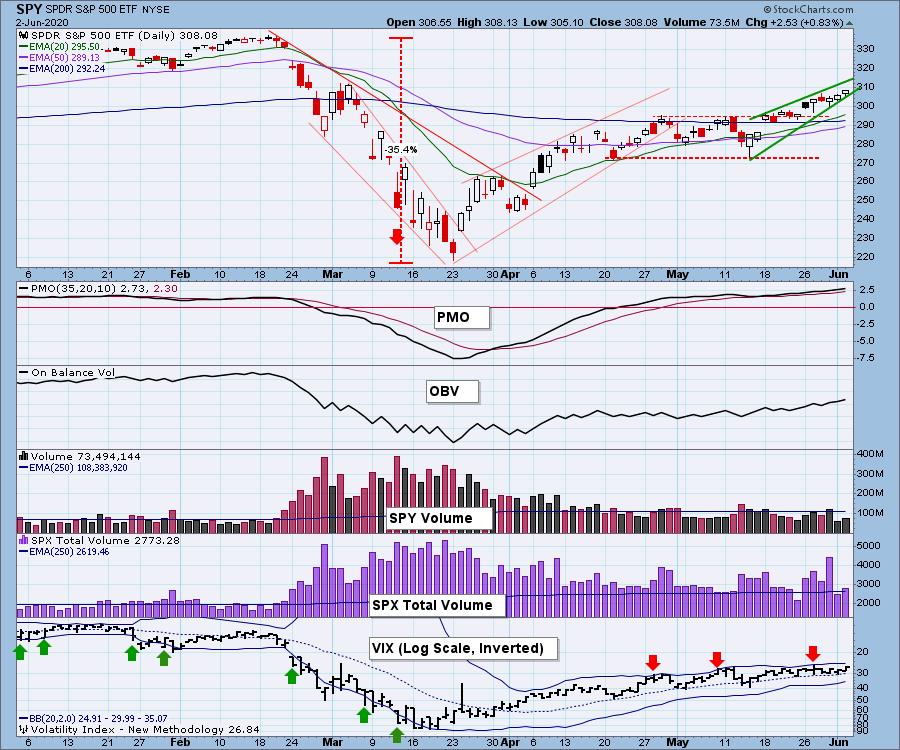
The market closed near its high for the day, continuing the rally. I took a look at the 5-month candlestick chart and noted that we have a bearish rising wedge in the short term. The technicals overall look healthy enough with the OBV bottoms rising and the PMO continuing to rise, albeit overbought. This bearish formation and overhead resistance are the only real negatives on the charts today.
** Announcement **
I will be traveling July 1 - July 15. I will be writing on the road, but broadcasting will likely be suspended during that time. It's going to be an adventurous road trip for me and my husband. We will be taking a train from Los Angeles to New Orleans, visiting family, checking out retirement areas and then renting a car and making our way back to California with various sightseeing stops along the way. I'll be sure to post a picture or two and I'm sure I'll have funny stories to share along the way. It'll be interesting to see the various stages of the reopening of America. A heads up to Bundle subscribers, after tomorrow the LIVE Trading Room will be going on hiatus as Mary Ellen will also be out of pocket in the upcoming month. We hope to reopen in late-July. Please direct questions to erin@decisionpoint.com.
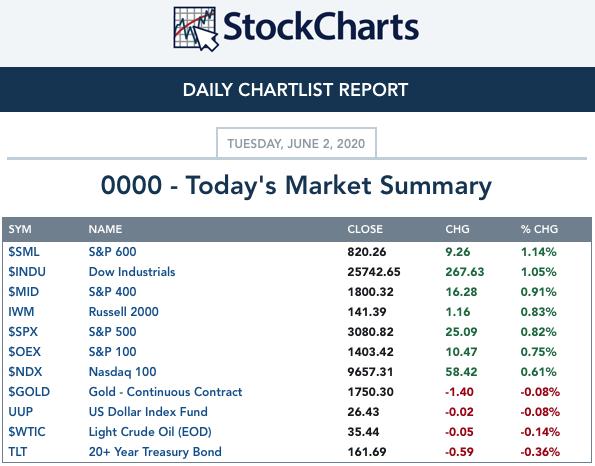
TODAY'S Broad Market Action:
Past WEEK Results: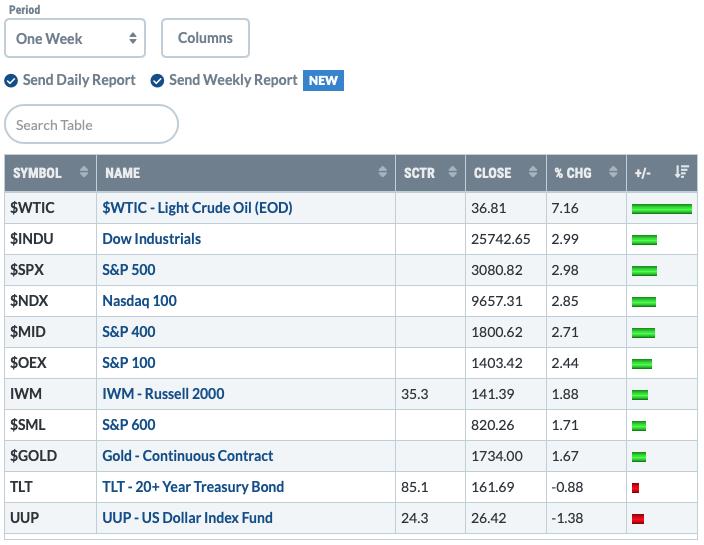
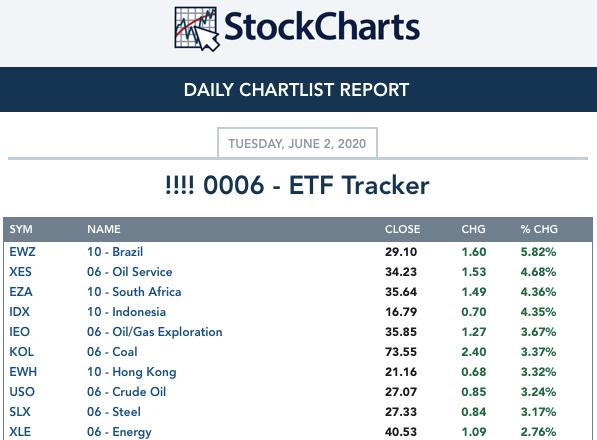
Top 10 from ETF Tracker:
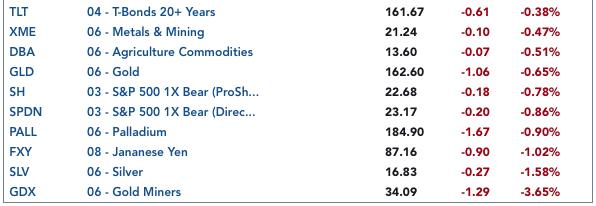
Bottom 10 from ETF Tracker:
On Friday, the DecisionPoint Alert Weekly Wrap presents an assessment of the trend and condition of the stock market (S&P 500), the U.S. Dollar, Gold, Crude Oil, and Bonds. Monday through Thursday the DecisionPoint Alert daily report is abbreviated and covers changes for the day.
Watch the latest episode of DecisionPoint on StockCharts TV's YouTube channel here!
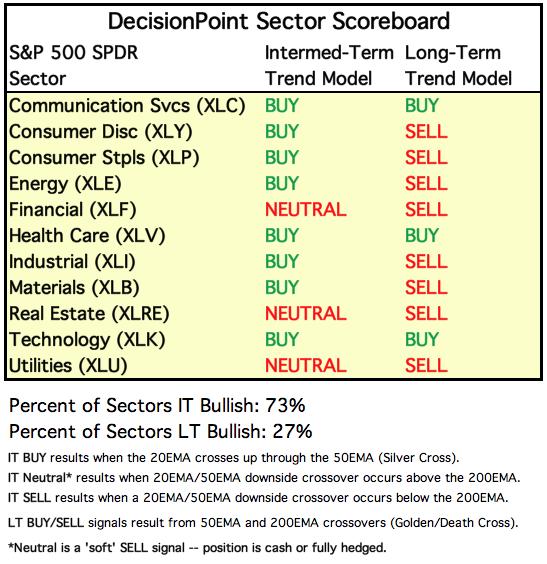
SECTORS
SIGNALS:
Each S&P 500 Index component stock is assigned to one, and only one, of 11 major sectors. This is a snapshot of the Intermediate-Term (Silver Cross) and Long-Term (Golden Cross) Trend Model signal status for those sectors.
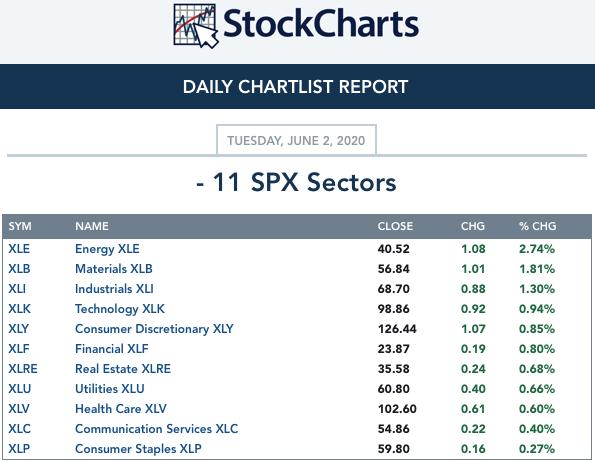
TODAY'S RESULTS:
One WEEK Results: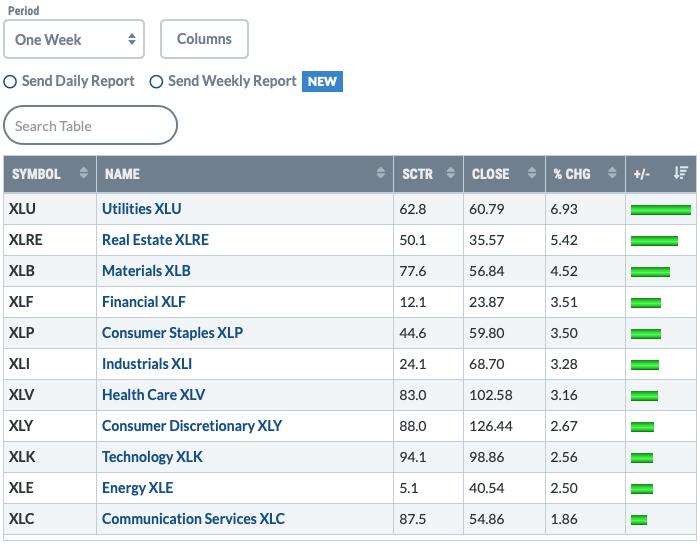
STOCKS
IT Trend Model: BUY as of 5/8/2020
LT Trend Model: SELL as of 3/19/2020
SPY Daily Chart: Looking at the daily bar chart, I note that our next area of overhead resistance is at the November/December 2019 tops (which also happen to match up with the March 2020 top). I suspect this will be the next line in the sand. The VIX continues to remain above its average on the inverted scale which suggests internal strength. Total volume rose on the rally which is bullish.
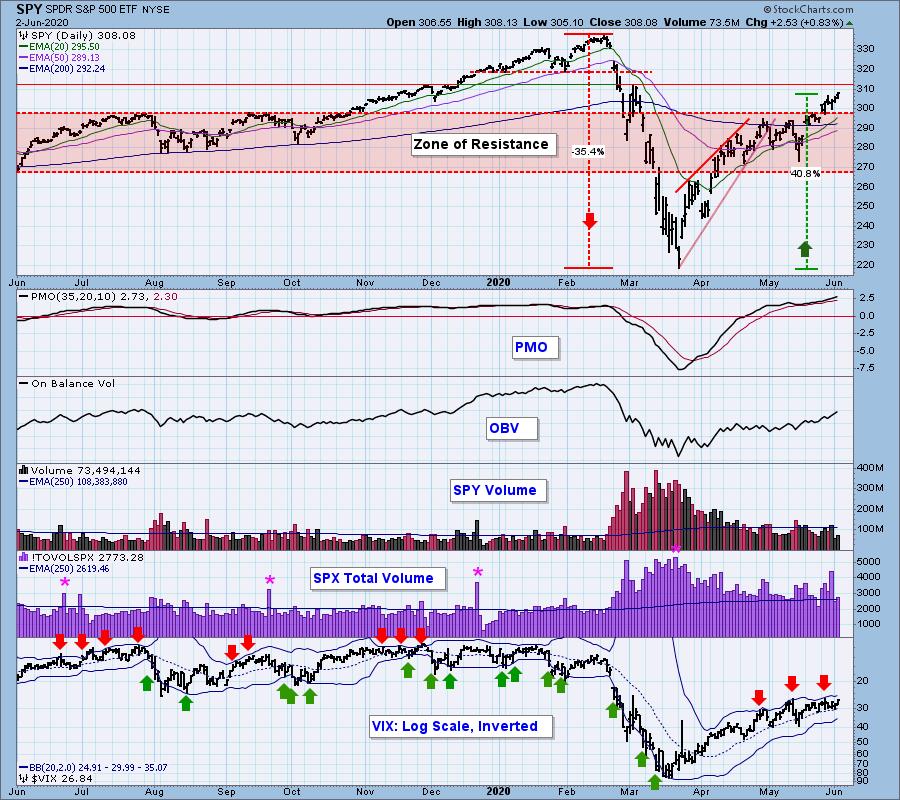
Climactic Market Indicators: No climactic readings, but I do note that we are seeing rising readings for the past three days on the Net A-D indicators which I would consider bullish until they reach climactic levels.
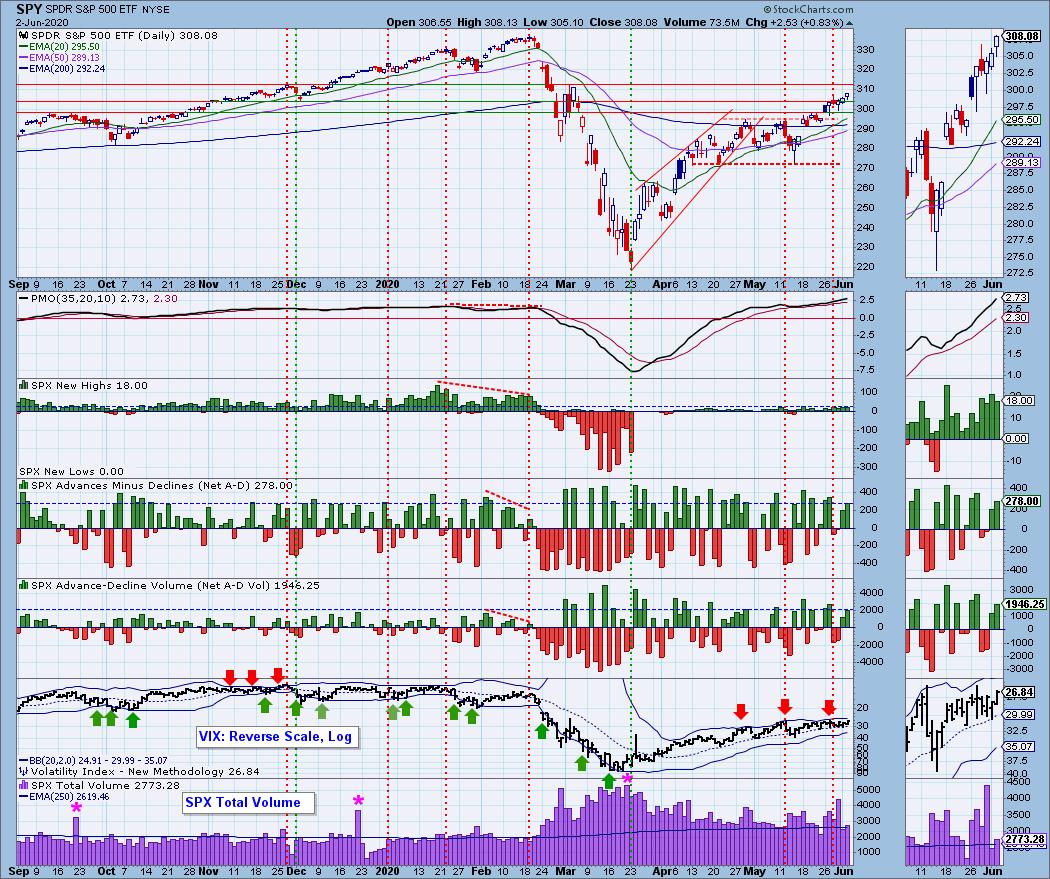
Short-Term Market Indicators: The ST trend is UP and the market condition is OVERBOUGHT based upon the Swenlin Trading Oscillator (STO) readings. I am noticing that we have rising bottoms on some of our indicators including the STOs. This would seem to confirm the current short-term rally. %Stocks > 20-EMA is getting very overbought and %PMOs Rising has flattened with a somewhat overbought reading. At this point these indicators are bullish.
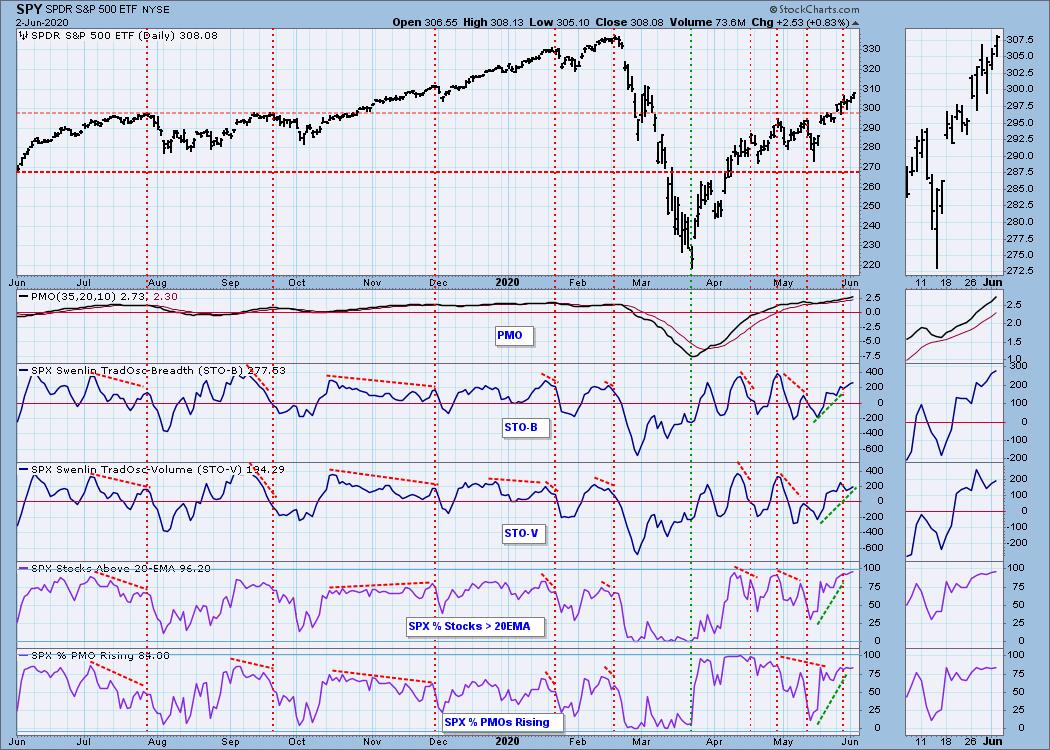
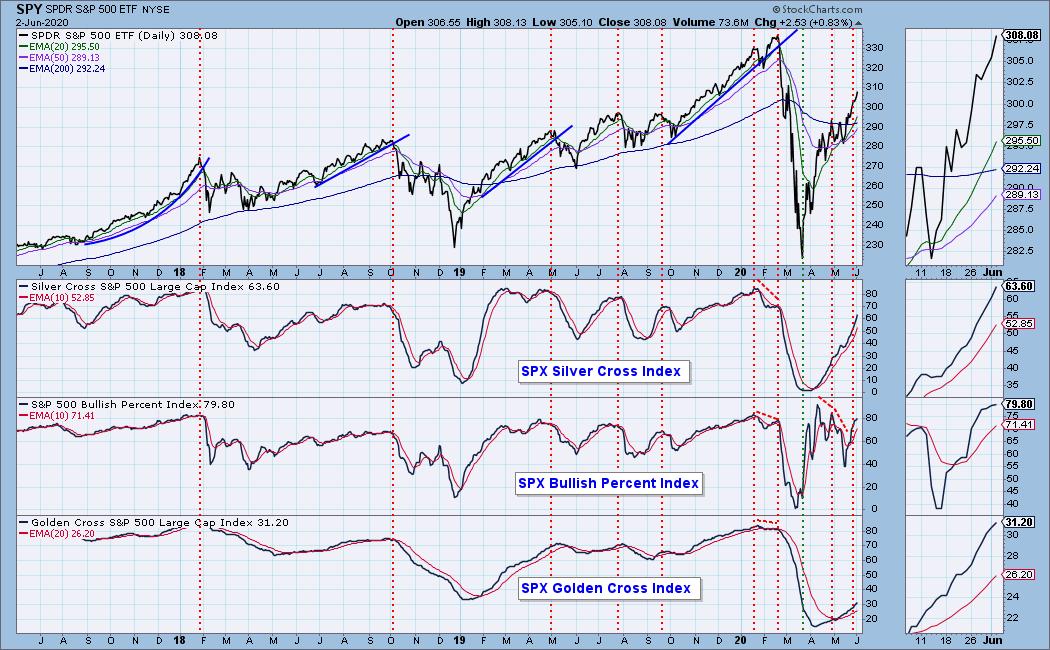
Intermediate-Term Market Indicators: The Silver Cross Index (% of SPX stocks 20EMA > 50EMA) and the Golden Cross Index (percent of SPX stocks 50EMA > 200EMA) are rising. The BPI is waffling but is still rising so all of these indicators are bullish for the intermediate term.
The IT trend is UP and the market condition is NEUTRAL based upon the ITBM and ITVM. All are rising nicely and are still neutral in my estimation. They are bullish.
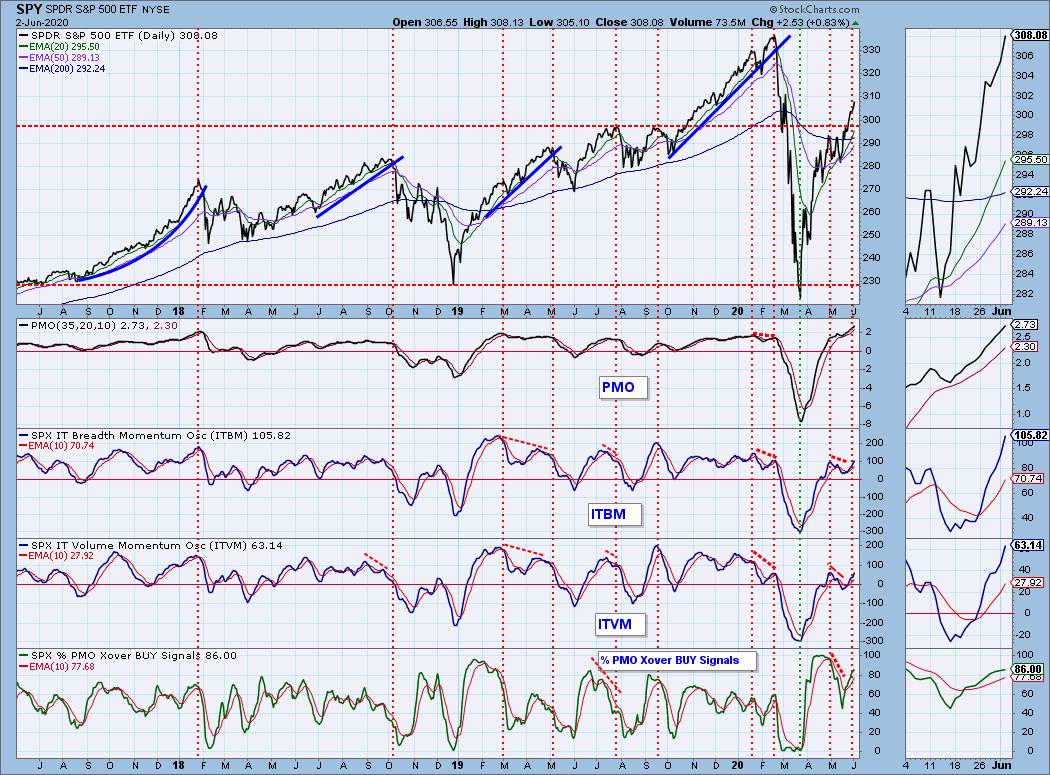
CONCLUSION: The ST trend is UP and IT trend is UP. Market condition based on ST indicators and IT indicators is NEUTRAL to OVERBOUGHT. I am bullish right now. There aren't many indicators that are negative. The only problem will be when price faces overhead resistance at the November/December 2019 and March 2020 tops. The bearish rising wedge also doesn't inspire confidence that we will see a rally move above that level this time around.
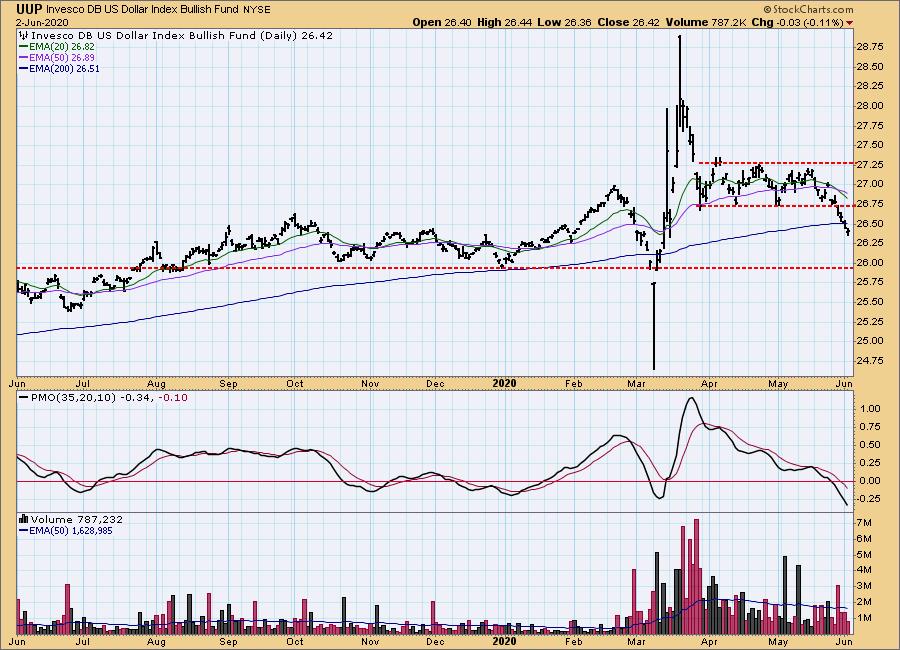
DOLLAR (UUP)
IT Trend Model: NEUTRAL as of 5/28/2020
LT Trend Model: BUY as of 5/25/2018
UUP Daily Chart: Yesterday's comments still apply: "UUP has now dropped below its 200-EMA. That's critical support that's been broken. I would look for further downside especially given the very negative PMO configuration."
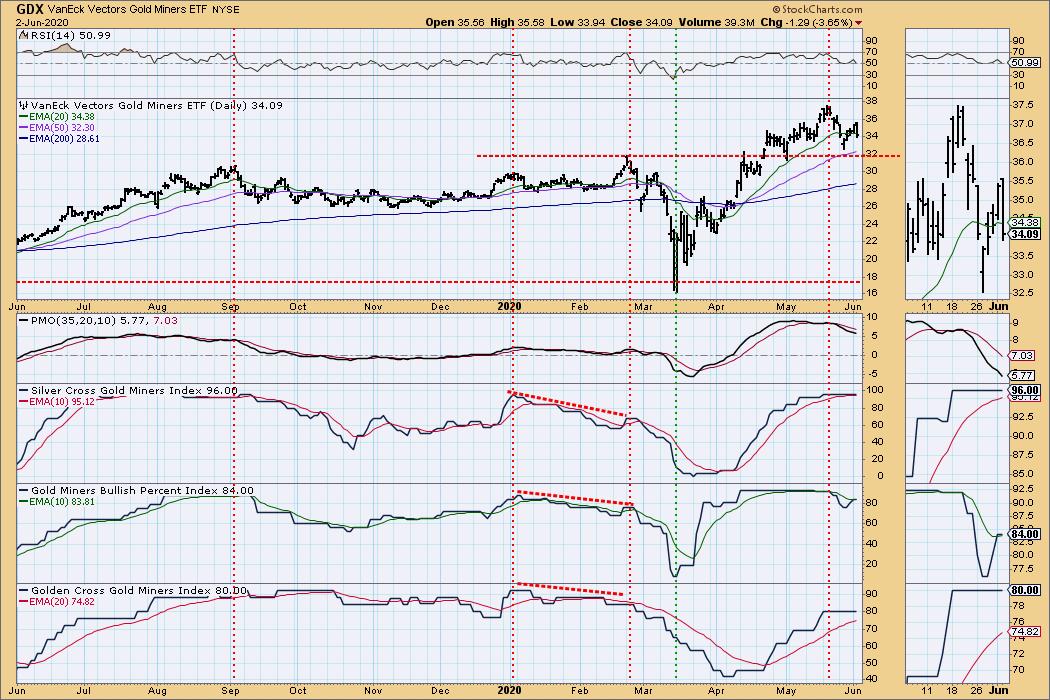
GOLD
IT Trend Model: BUY as of 12/26/2019
LT Trend Model: BUY as of 1/8/2019
GOLD Daily Chart: Gold at times drives me crazy. The indicators had lined up with the PMO turning up and a strong bounce off the rising bottoms trendline. Unfortunately today Gold pulled back. The good news is that it remains above the 20-EMA. The bad news is that it could still move lower to test the rising trendline given the PMO has turned down once again.

GOLD MINERS Golden and Silver Cross Indexes: We got quite a pullback on Gold Miners. After adding the PMO to this chart and following them today, I lost interest in this industry group. The RSI is still above 50 and the SCI/GCI/BPI all look healthy, but they all could be topping soon.
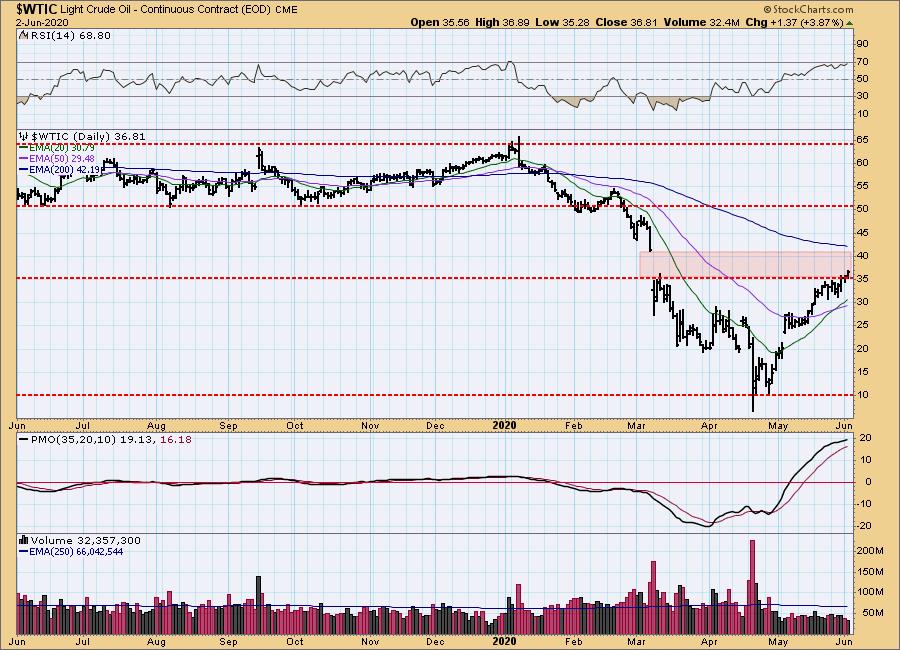
CRUDE OIL ($WTIC)
The oil market is under severe pressure due to a lack of demand, and we do not believe that USO is an appropriate investment vehicle at this time. Until further notice we will use $WTIC to track the oil market. Since this is a continuous contract dataset, it doesn't "play well" with our Trend Models, and we will not report Trend Model signals for oil.
$WTIC Daily Chart: I have annotated the gap in red for reference. I don't believe we will see this gap closed this time around. The PMO is decelerating and the RSI is getting overbought. It's time for a pullback and this area of overhead resistance is just the spot to do it.
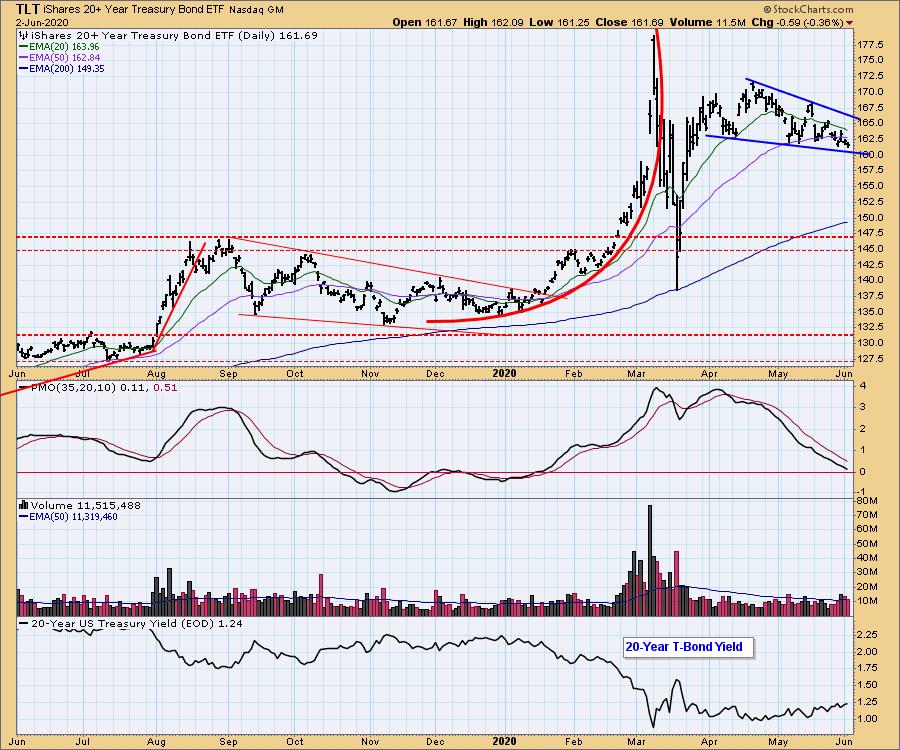
BONDS (TLT)
IT Trend Model: BUY as of 1/22/2020
LT Trend Model: BUY as of 1/2/2019
TLT Daily Chart: I bailed on the head and shoulders pattern and am sticking with a bullish falling wedge. Given price's inability to test the top of the wedge, I'm not looking for an upside breakout just yet. More likely it will break down given the PMO decline or we could see it meander sideways a bit longer before a breakout.
Have you subscribed the DecisionPoint Diamonds yet? DP does the work for you by providing handpicked stocks/ETFs from exclusive DP scans! Add it with a discount AND get the LIVE Trading Room for free! Contact support@decisionpoint.com for more information!
Technical Analysis is a windsock, not a crystal ball.
Happy Charting! - Erin
Email: erin@decisionpoint.com

Erin Swenlin will be presenting at the The MoneyShow Las Vegas August 16 - 20 at Bally's/Paris Resort! You'll have an opportunity to meet Erin and discuss the latest DecisionPoint news and Diamond Scans. Claim your FREE pass here! You can watch online with this pass too!! There will be online events held in May and when I have more information I'll let you know.
NOTE: The signal status reported herein is based upon mechanical trading model signals, specifically, the DecisionPoint Trend Model. They define the implied bias of the price index based upon moving average relationships, but they do not necessarily call for a specific action. They are information flags that should prompt chart review. Further, they do not call for continuous buying or selling during the life of the signal. For example, a BUY signal will probably (but not necessarily) return the best results if action is taken soon after the signal is generated. Additional opportunities for buying may be found as price zigzags higher, but the trader must look for optimum entry points. Conversely, exit points to preserve gains (or minimize losses) may be evident before the model mechanically closes the signal.
Helpful DecisionPoint Links (Can Be Found on DecisionPoint.com Links Page):
DecisionPoint Shared ChartList and DecisionPoint Chart Gallery
Price Momentum Oscillator (PMO)
Swenlin Trading Oscillators (STO-B and STO-V)