
I thought the 10-minute bar chart was worth a gander today. It seems that price reached a decision point at the end of the day. It could either break out of the declining trend and rally to meet the minimum upside target of the ascending triangle OR it could be turned away. Given price didn't make new highs in the final 20 minutes, it looks like this will be a problem in the morning.

Free Live Trading Room - Tuesdays/Thursdays
Do you miss MarketWatchers LIVE? You should definitely come visit the free trading room to get your fix. We give you a quick market update followed by your symbol requests and questions! I'm teaming up with Mary Ellen McGonagle (MEMInvestmentResearch.com) to do the regular "LIVE Trading Room" sessions for FREE at 11:00a EST - 12:15p EST Tuesdays/Thursdays.
** Here is the link to register for the live trading room.**
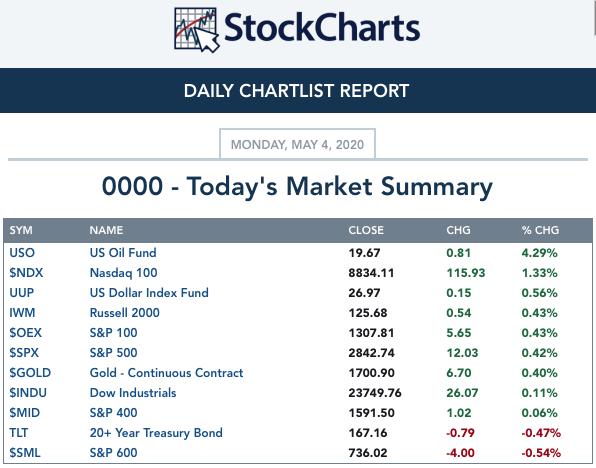
TODAY'S Broad Market Action:
Past WEEK Results: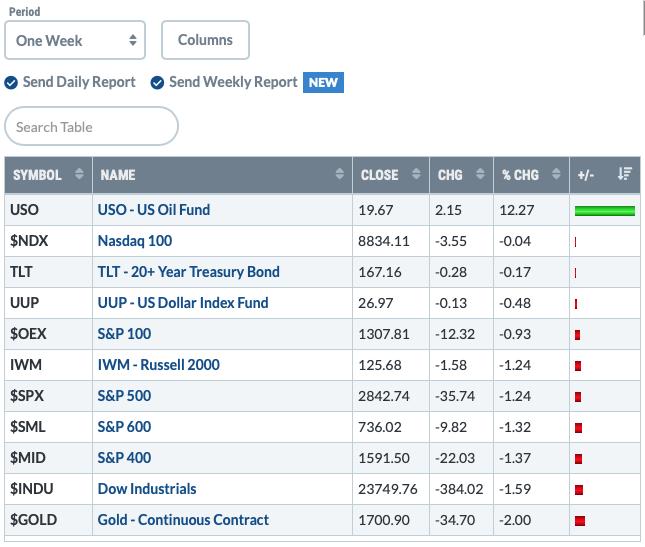
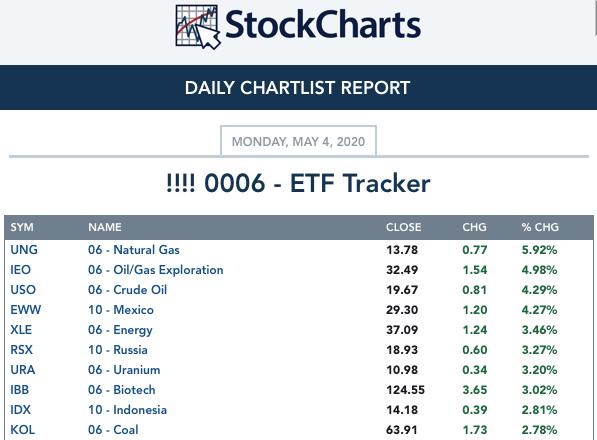
Top 10 from ETF Tracker:
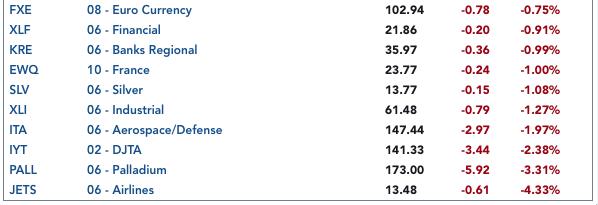
Bottom 10 from ETF Tracker:
On Friday, the DecisionPoint Alert Weekly Wrap presents an assessment of the trend and condition of the stock market (S&P 500), the U.S. Dollar, Gold, Crude Oil, and Bonds. Monday through Thursday the DecisionPoint Alert daily report is abbreviated and covers changes for the day.
Watch the latest episode of DecisionPoint on StockCharts TV's YouTube channel here!
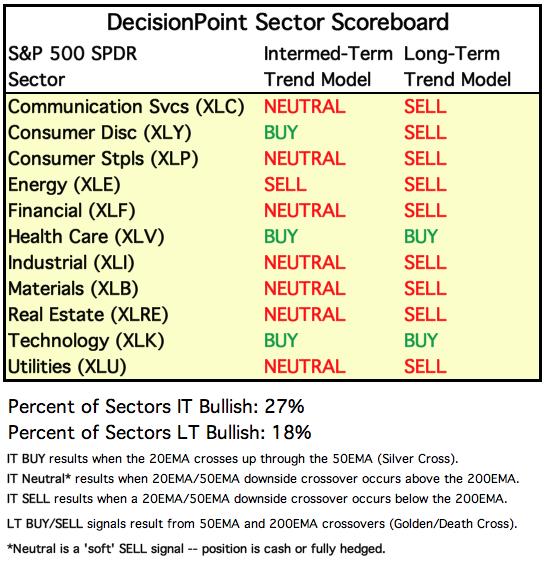
SECTORS
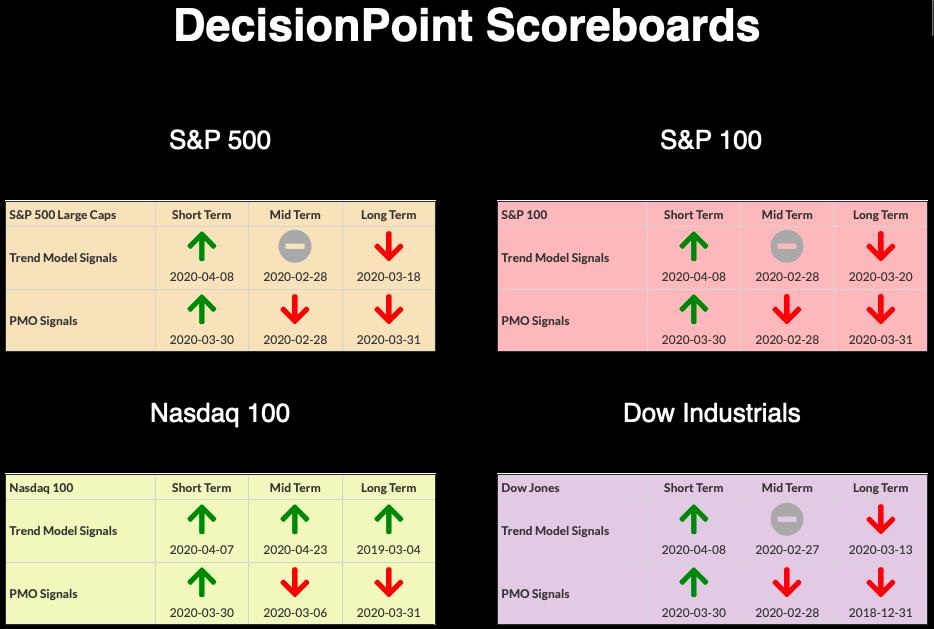
SIGNALS:
Each S&P 500 Index component stock is assigned to one, and only one, of 11 major sectors. This is a snapshot of the Intermediate-Term (Silver Cross) and Long-Term (Golden Cross) Trend Model signal status for those sectors.
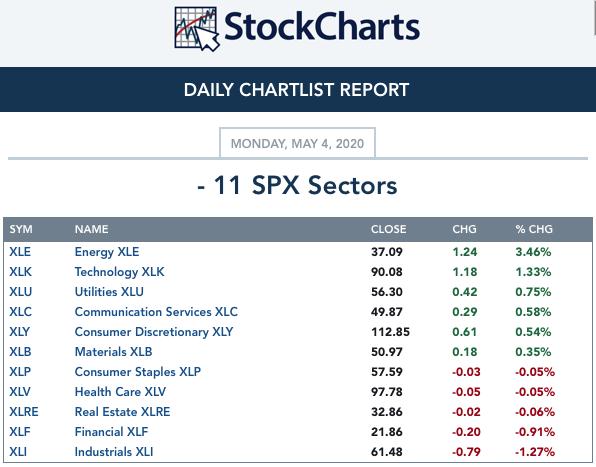
TODAY'S RESULTS:
One WEEK Results: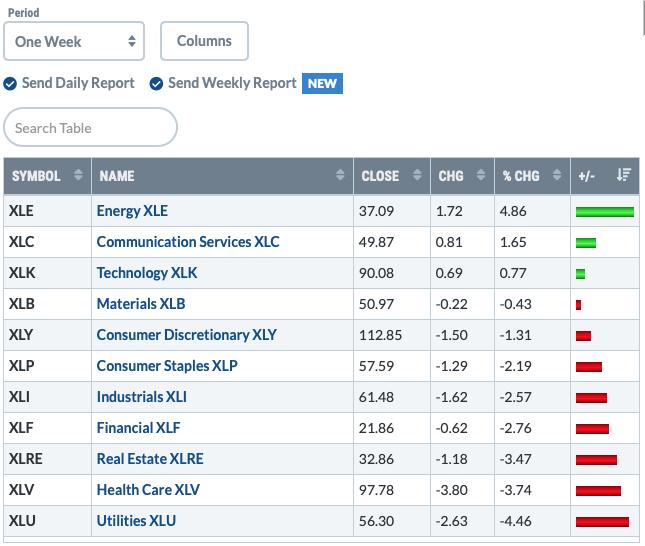
STOCKS
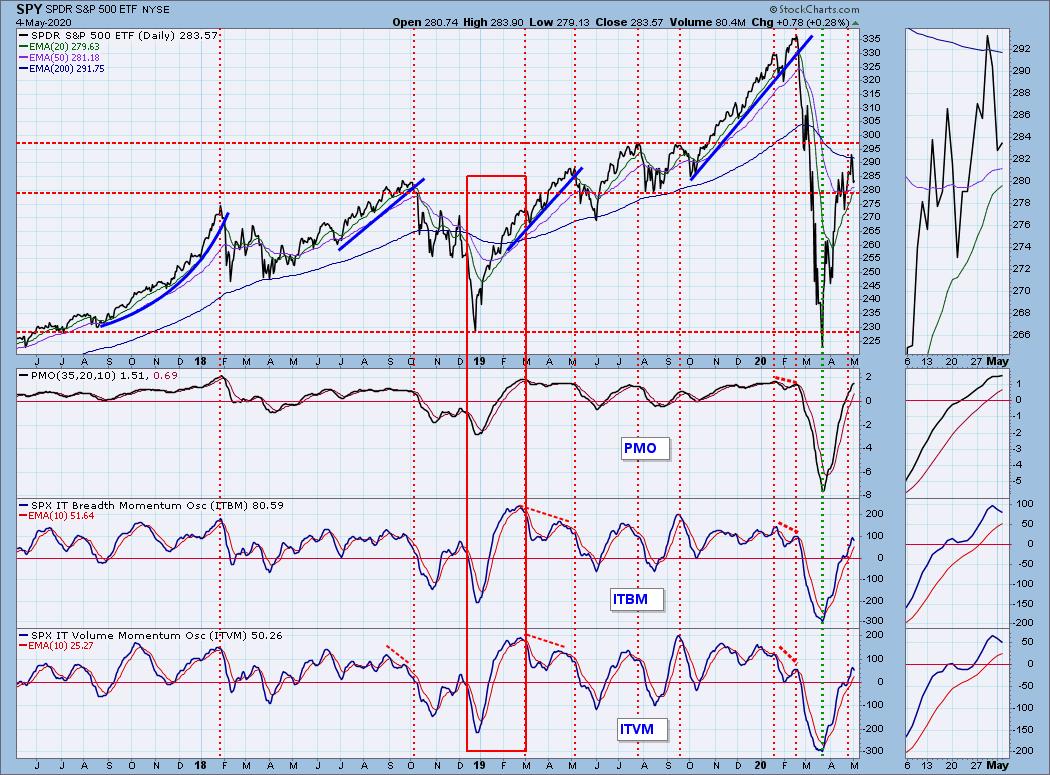
IT Trend Model: NEUTRAL as of 2/28/2020
LT Trend Model: SELL as of 3/19/2020
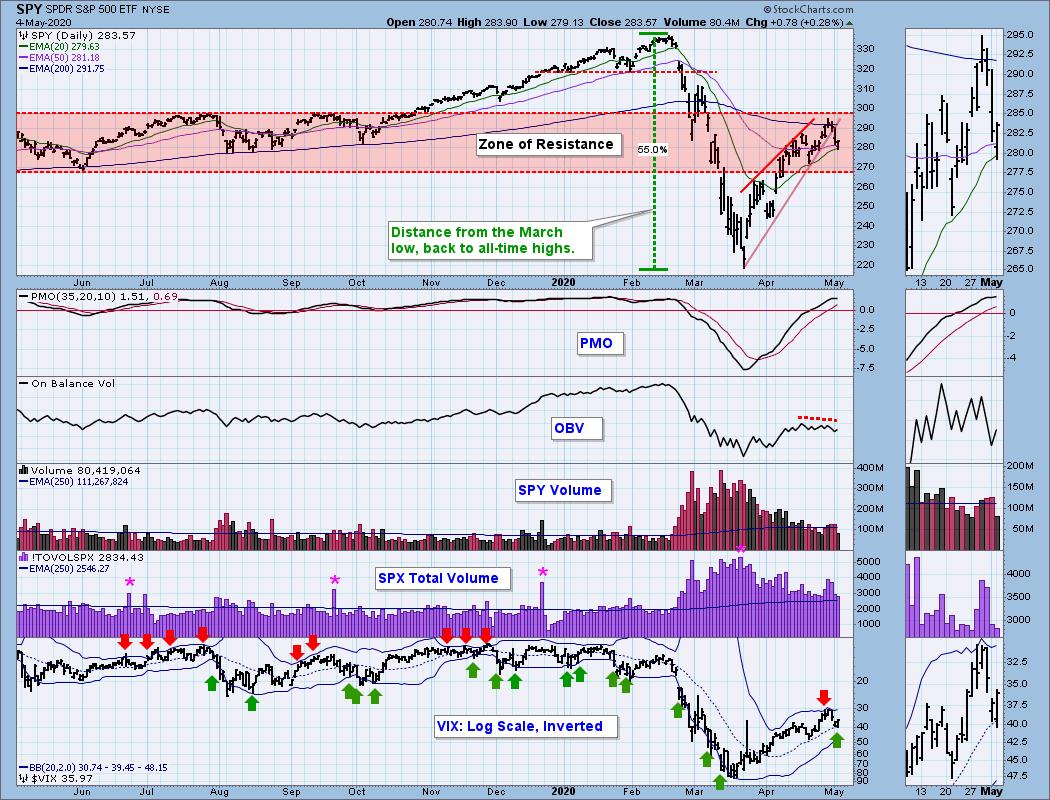
SPY Daily Chart: Price dipped below the 20/50-EMAs today, but did manage to close above both. The PMO is flattening, but hasn't really turned lower. The OBV was sporting a negative divergence last week and it seems to have given us warning of this pullback. The VIX dipped below its average but ended up finishing the day above the average on the inverted scale which I find bullish.
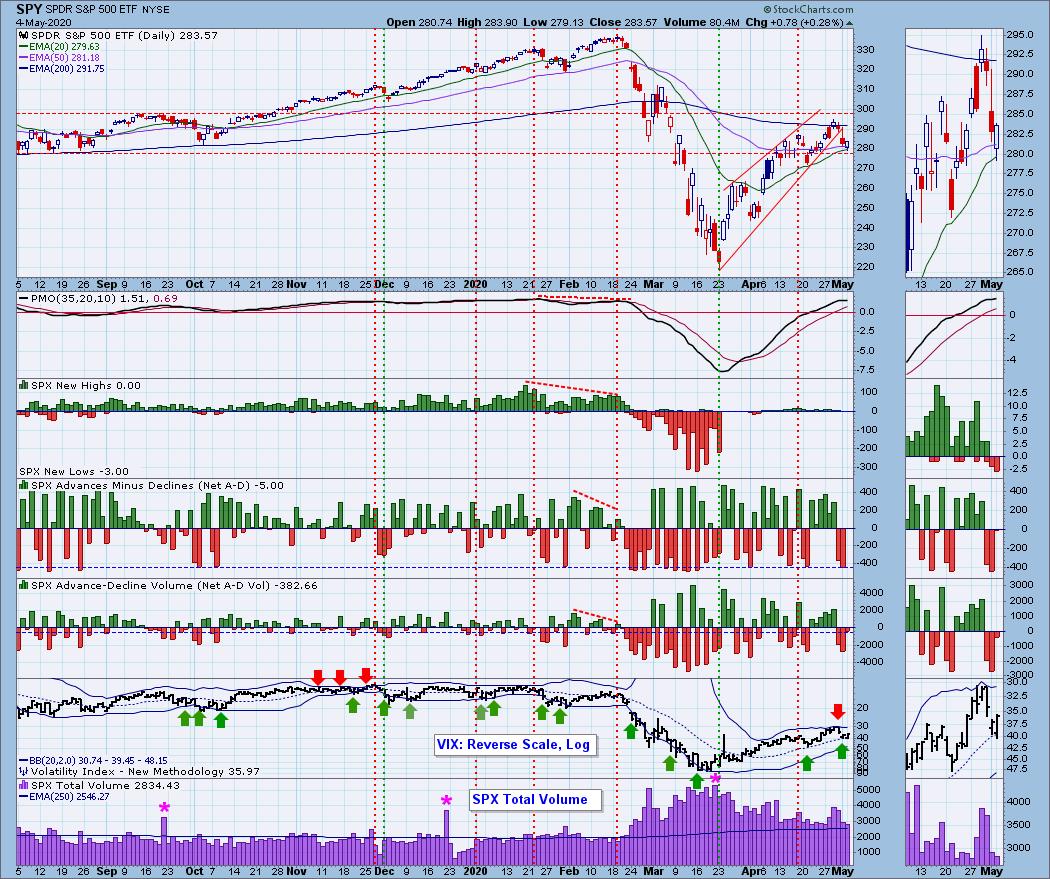
Climactic Market Indicators: The Net A-D reading was more climactic than last Friday but its sister, Net A-D Volume was not a climactic reading. Given the mixed messages of the VIX and those two indicators, I can't make much of it. I would err on the side of caution.
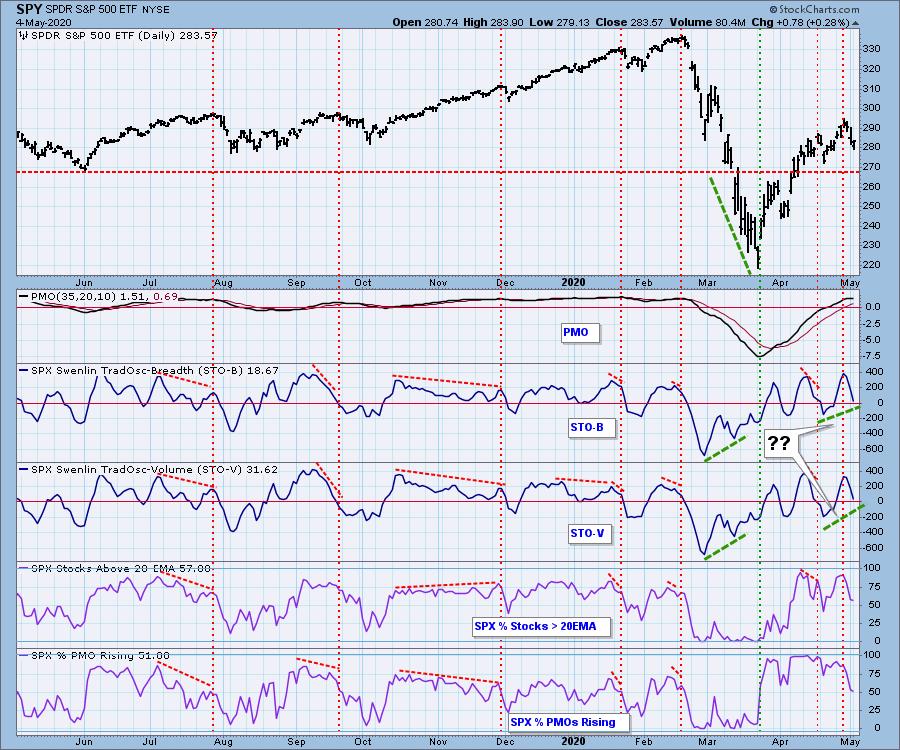
Short-Term Market Indicators: The ST trend is UP and the market condition is NEUTRAL based upon the Swenlin Trading Oscillator (STO) readings. The STOs are still in decline which tells me there is more downside to come this week. However, we have a shot at a positive divergence should the STOs see higher lows and price sees lower lows. Just food for thought. We do NOT have that set-up right now, only declining indicators and that is bearish.
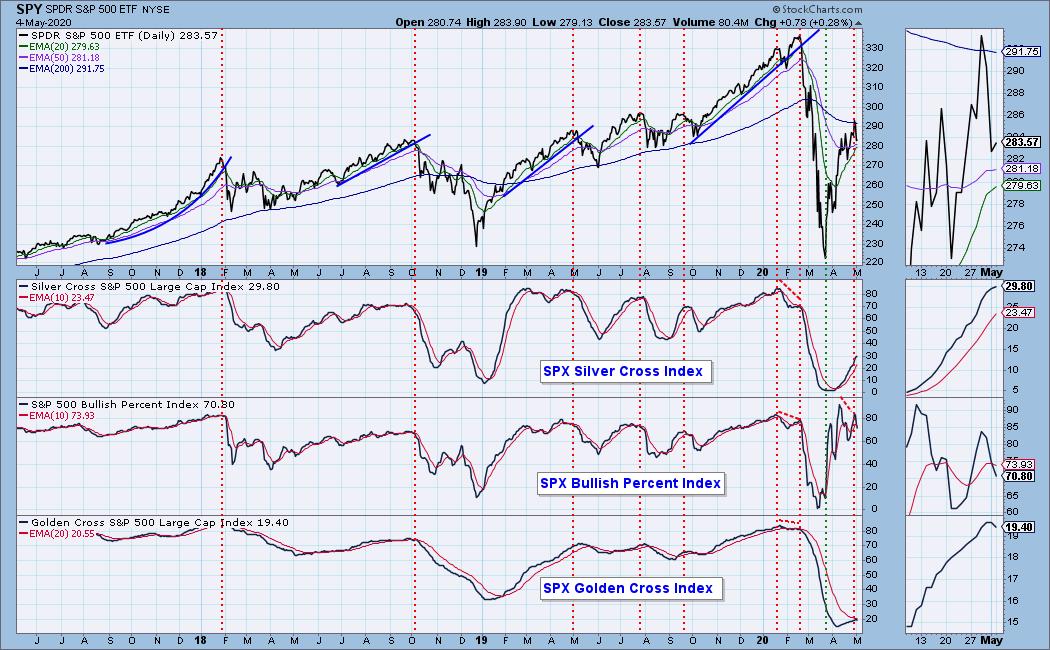
Intermediate-Term Market Indicators: The Silver Cross Index (% of SPX stocks 20EMA > 50EMA) and the Golden Cross Index (percent of SPX stocks 50EMA > 200EMA) are both rising. I do not like this chart. We have a decelerating Silver Cross Index, a negative crossover on the BPI and the Golden Cross Index has topped below the signal line. All of these are bearish for the intermediate term.
The IT trend is UP and the market condition is NEUTRAL based upon the ITBM and ITVM. They have now turned down which is bearish, but they haven't had a negative crossover. We saw similar action around April 21 and it didn't pan out. I prefer to wait for the crossovers before I get too bearish.
CONCLUSION: The ST is UP and IT trend is also UP. Market condition based on ST indicators and on IT indicators is NEUTRAL. There are mixed messages in the very short term with a positive VIX and disparate Net A-D readings. The short-term and intermediate-term indicators are in agreement that we should expect the declining trend to continue.
(Not a Diamonds subscriber? Add it to your DP Alert subscription and get a discount! Contact support@decisionpoint.com for your limited time coupon code!)
DOLLAR (UUP)
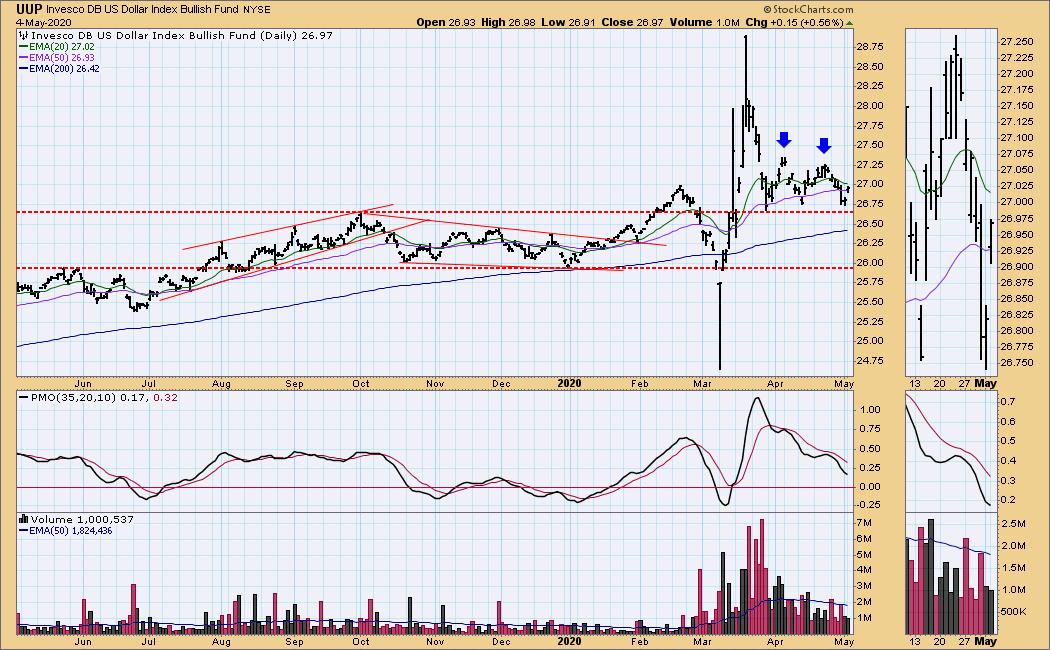
IT Trend Model: BUY as of 3/12/2020
LT Trend Model: BUY as of 5/25/2018
UUP Daily Chart: Price is consolidating sideways. I still am looking at that bearish double-top, but price rebounded rather than breaking down at the confirmation line. The pattern is falling apart with today's gap up, but the PMO is still in decline.
GOLD
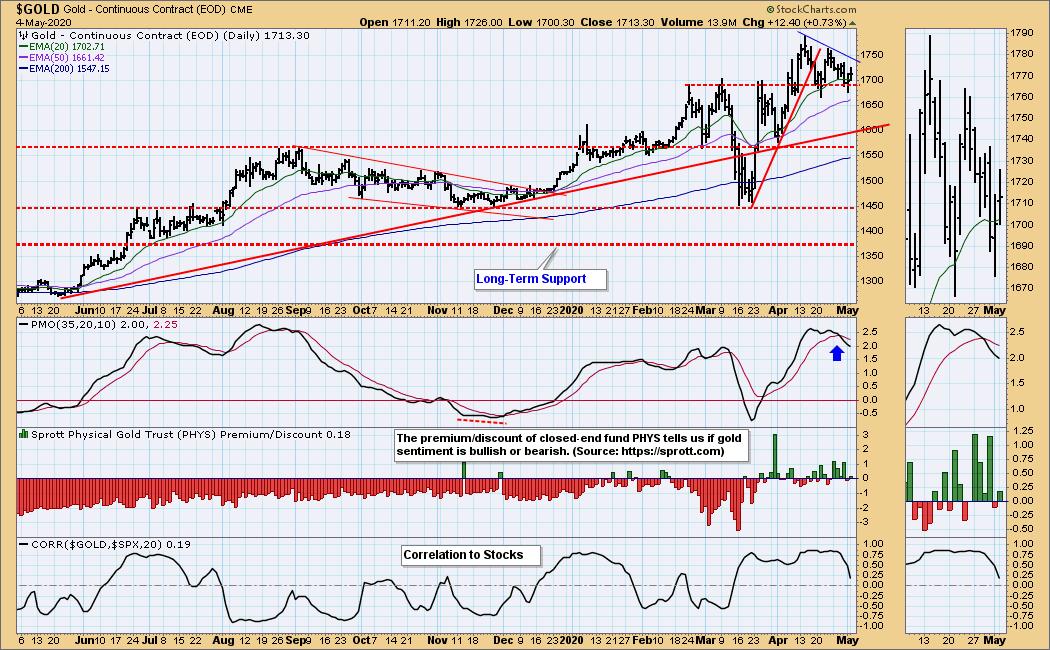
IT Trend Model: BUY as of 12/26/2019
LT Trend Model: BUY as of 1/8/2019
GOLD Daily Chart: Gold rallied but the declining trend remains along with a PMO SELL signal which suggest lower prices.
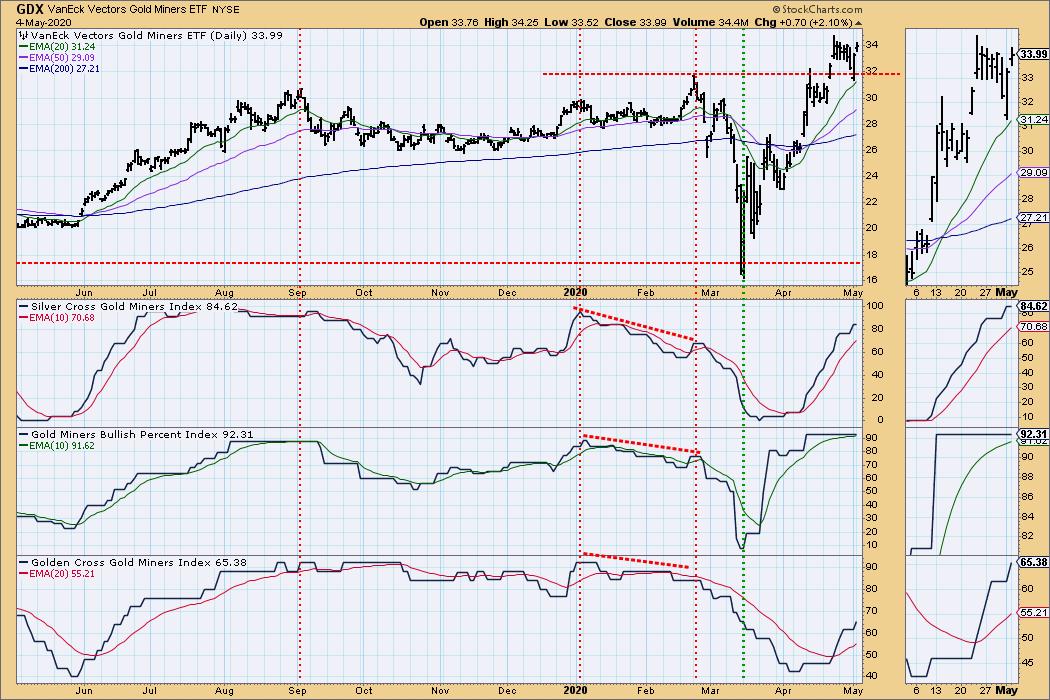
GOLD MINERS Golden and Silver Cross Indexes: Nice breakout on Miners today! The indicators look good and this is a very short-term breakout that could be signaling the next leg up. The Golden and Silver Cross Indexes are confirming the rally.
Bonus: For non-Diamonds Report subscribers, I added a Gold Miner to my list of "diamonds in the rough" today. So here's a sample of what I do in my Diamonds Reports. (If you'd like to add Diamonds to your DP Alert subscription, contact support@decisionpoint.com and I'll get it started at the "Bundle" price.
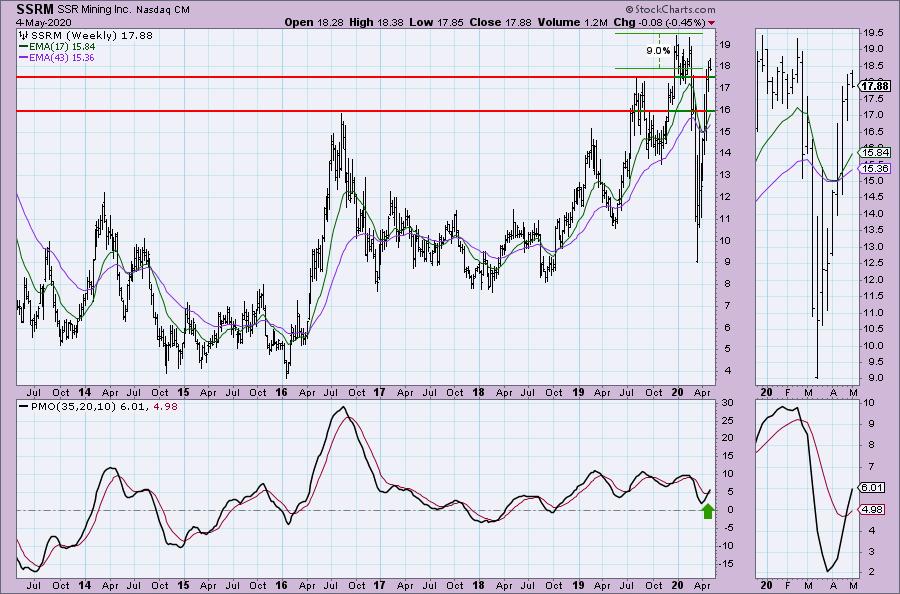
SSR Mining Inc (SSRM) - Earnings: 5/14/2020 (AMC)
SSR Mining, Inc. engages in the operation, development, exploration, and acquisition of precious metal projects. It focuses on the Puna, Marigold Mines, and Seabee Gold Operations. The company was founded on December 11, 1946 is headquartered in Vancouver, Canada.
Gold miners have been performing quite well and this one is no exception. The RSI moved out of overbought territory and is settling in above net neutral. The OBV is positive and moving higher. If I had a complaint it would be the overbought PMO, although we see that the recent PMO low was -10 and that suggests the upper range could move to +10.
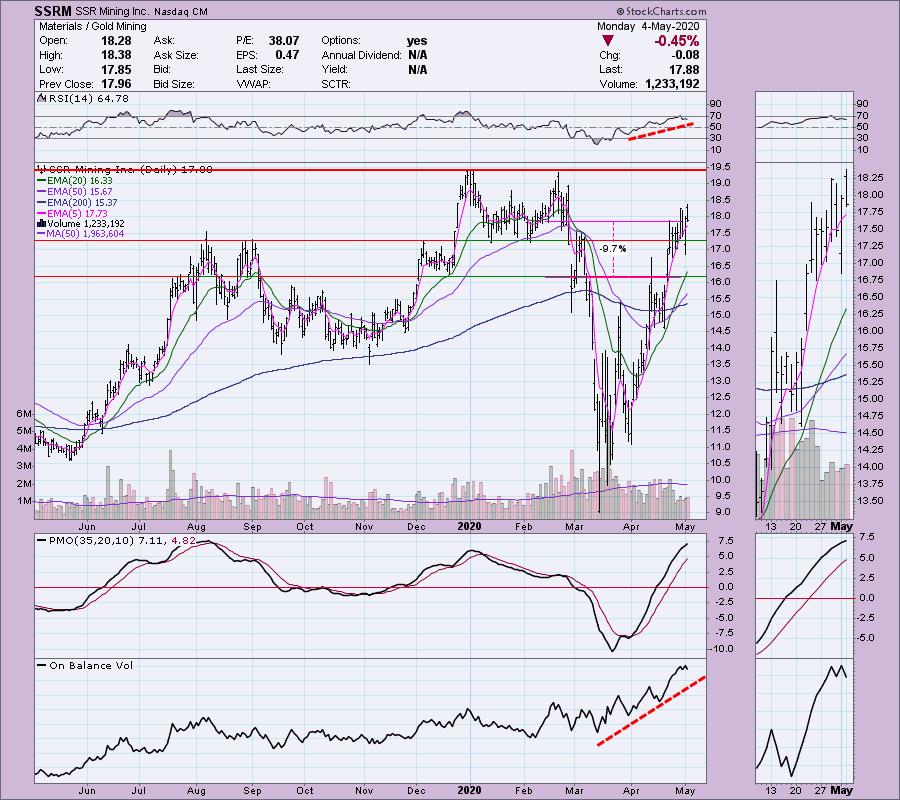
Upside potential to the all-time high is around 9%, but given the new PMO BUY signal, I suspect it will go higher.
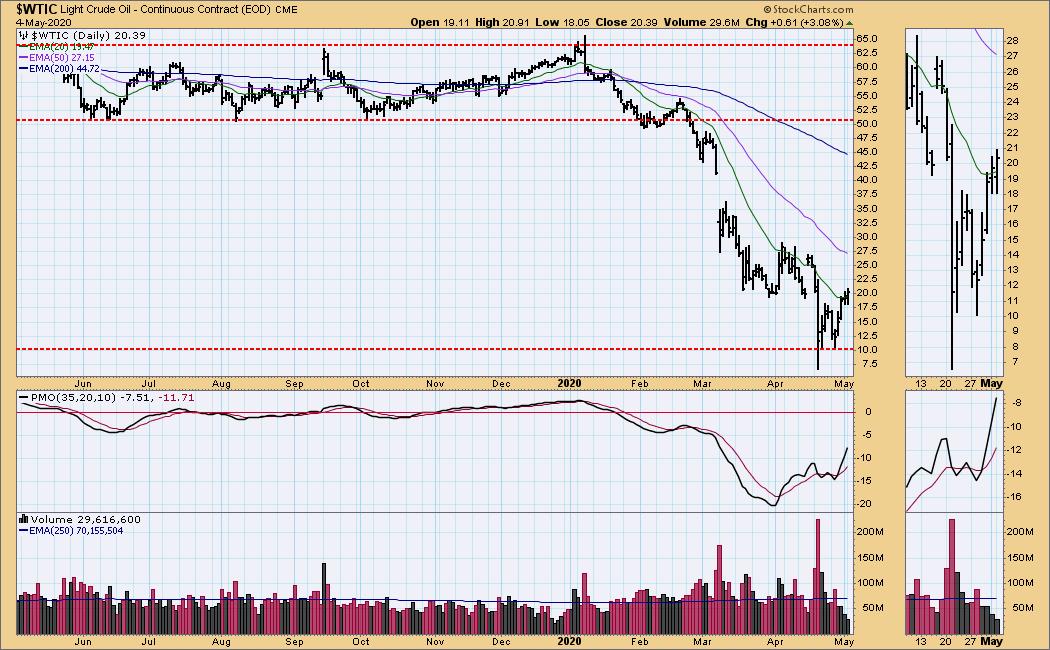
CRUDE OIL ($WTIC)
The oil market is under severe pressure due to a lack of demand, and we do not believe that USO is an appropriate investment vehicle at this time. Until further notice we will use $WTIC to track the oil market. Since this is a continuous contract dataset, it doesn't "play well" with our Trend Models, and we will not report Trend Model signals for oil.
$WTIC Daily Chart: This is still an area I would avoid despite the second day of price closing above the 20-EMA. We have a double-bottom that has executed which is bullish. The $20 area was support back at the end of March/beginning of April. Now it is overhead resistance. I suspect oil prices will struggle here. This is probably the most bullish I've seen $WTIC, but I would trade this area with caution. The supply and demand issues remain.
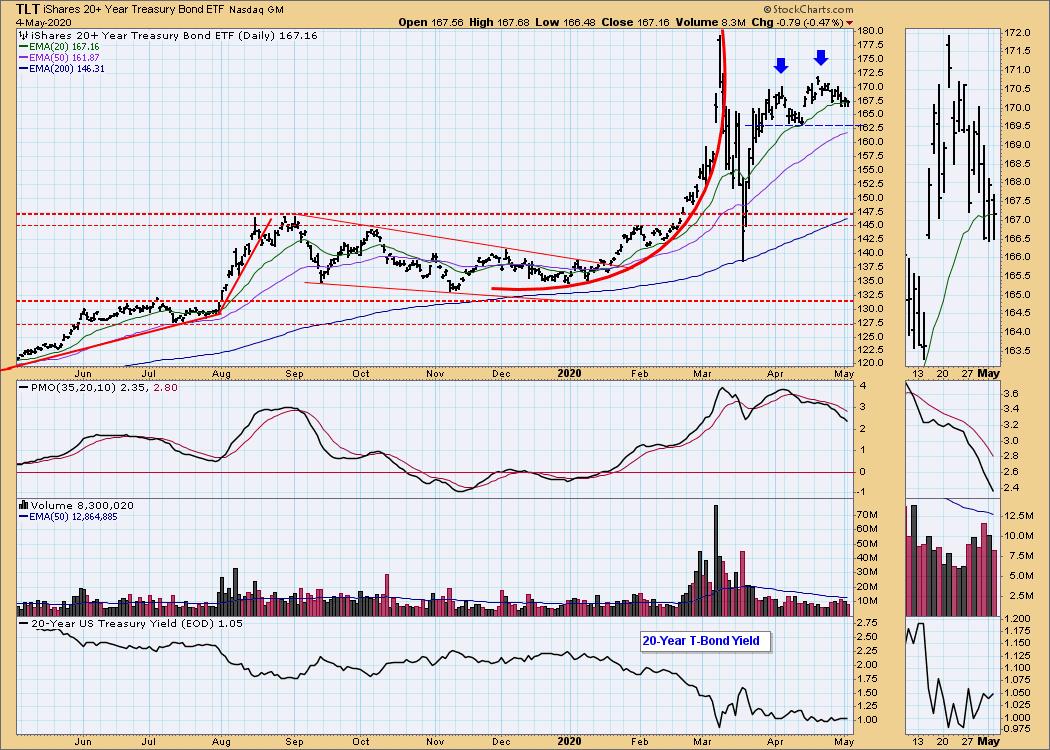
BONDS (TLT)
IT Trend Model: BUY as of 1/22/2020
LT Trend Model: BUY as of 1/2/2019
TLT Daily Chart: A bearish double-top is still in play, price is just taking its time to arrive at the confirmation line. The PMO in decline suggests price will at least test it.
Have you subscribed the DecisionPoint Diamonds yet? DP does the work for you by providing handpicked stocks/ETFs from exclusive DP scans! Add it with a discount! Contact support@decisionpoint.com for more information!
Technical Analysis is a windsock, not a crystal ball.
Happy Charting! - Erin
Email: erin@decisionpoint.com

Erin Swenlin will be presenting at the The MoneyShow Las Vegas August 16 - 20 at Bally's/Paris Resort! You'll have an opportunity to meet Erin and discuss the latest DecisionPoint news and Diamond Scans. Claim your FREE pass here! You can watch online with this pass too!! There will be online events held in May and when I have more information I'll let you know.
NOTE: The signal status reported herein is based upon mechanical trading model signals, specifically, the DecisionPoint Trend Model. They define the implied bias of the price index based upon moving average relationships, but they do not necessarily call for a specific action. They are information flags that should prompt chart review. Further, they do not call for continuous buying or selling during the life of the signal. For example, a BUY signal will probably (but not necessarily) return the best results if action is taken soon after the signal is generated. Additional opportunities for buying may be found as price zigzags higher, but the trader must look for optimum entry points. Conversely, exit points to preserve gains (or minimize losses) may be evident before the model mechanically closes the signal.
Helpful DecisionPoint Links (Can Be Found on DecisionPoint.com Links Page):
DecisionPoint Shared ChartList and DecisionPoint Chart Gallery
Price Momentum Oscillator (PMO)
Swenlin Trading Oscillators (STO-B and STO-V)