
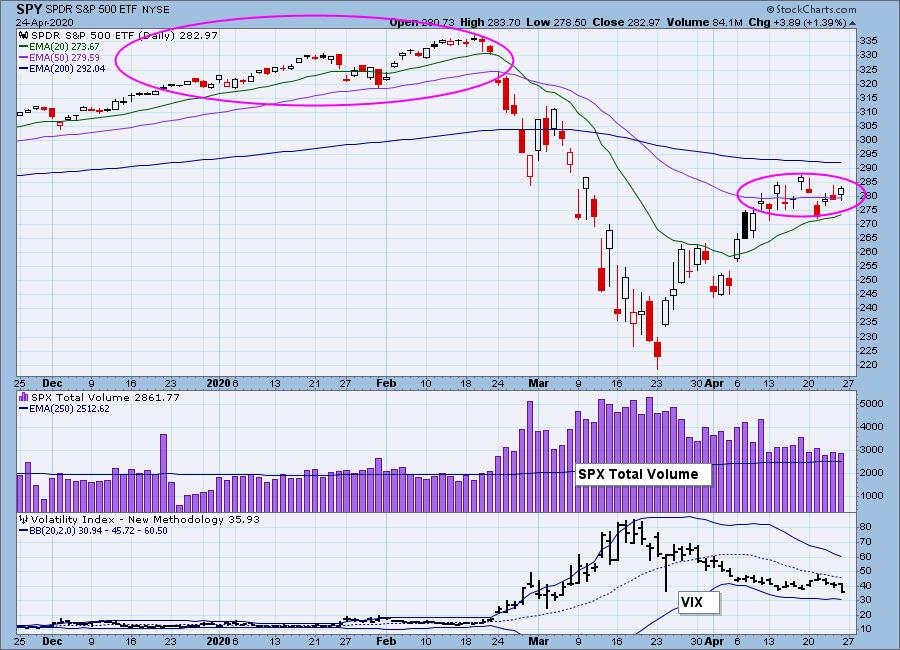
During our StockCharts TV show this week (posted on Thursday morning), I remarked to Erin that the market was "feeling" differently of late, more like it felt earlier in the year before the crash. I was referring to the fact that the price swings weren't so wild, and that price seemed to resist declines and favor advances. I went to our 5-month SPY chart, stripped out distracting indicators and annotations, and looked a bit closer. Compared to price action from mid-February through early April, price in the last two weeks has settled down considerably, but still it isn't as calm as it was before the bottom fell out. This was confirmed by the VIX, which is well off last month's highs, but is still far from the bull market norms to which we had become accustomed. (Note that I have used the standard VIX display on this chart.) SPX Total Volume has also contracted substantially, but it has stayed above the one-year daily average. So, yes, the market has been behaving better in the last two weeks, but it is still far from being back to "bull market normal."
The DecisionPoint Alert Weekly Wrap presents an end-of-week assessment of the trend and condition of the Stock Market, the U.S. Dollar, Gold, Crude Oil, and Bonds. The DecisionPoint Alert daily report (Monday through Thursday) is abbreviated and gives updates on the Weekly Wrap assessments.
Watch the latest episode of DecisionPoint on StockCharts TV's YouTube channel here!
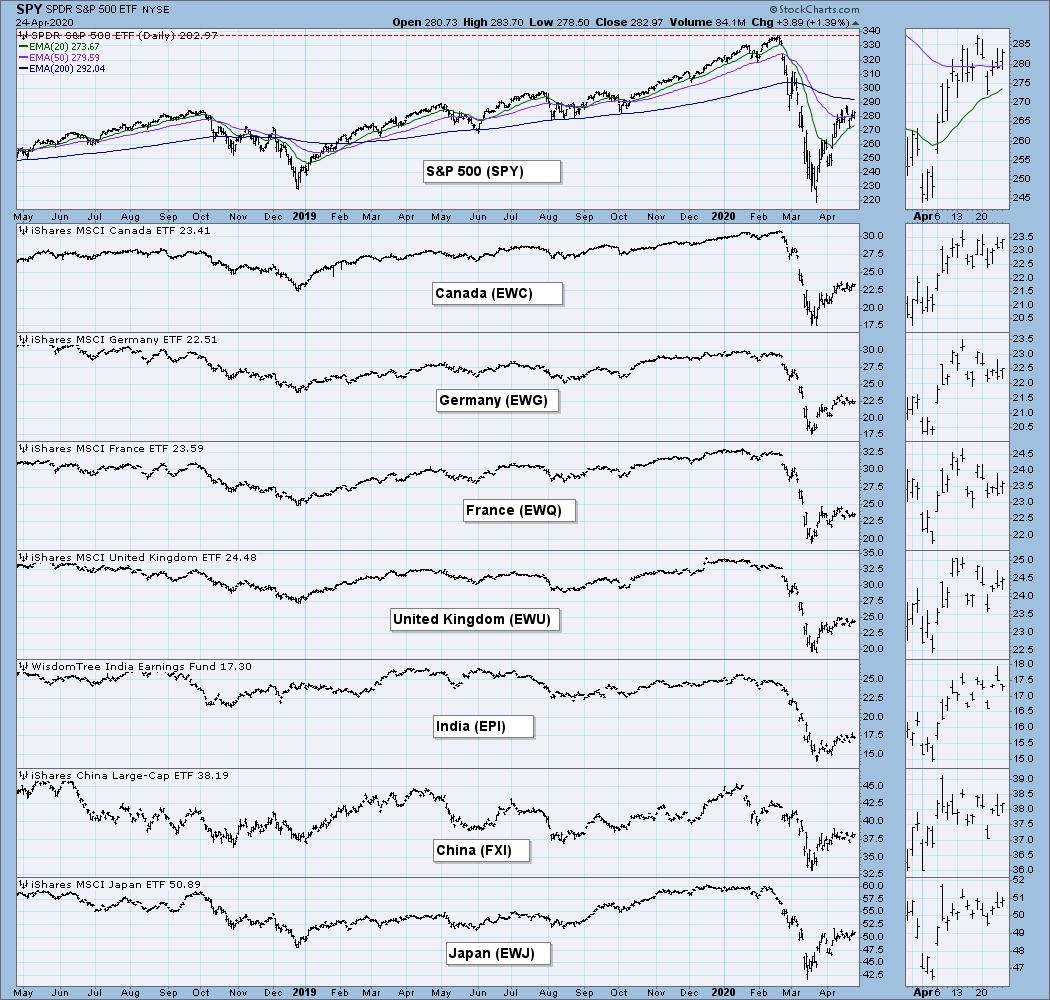
GLOBAL MARKETS
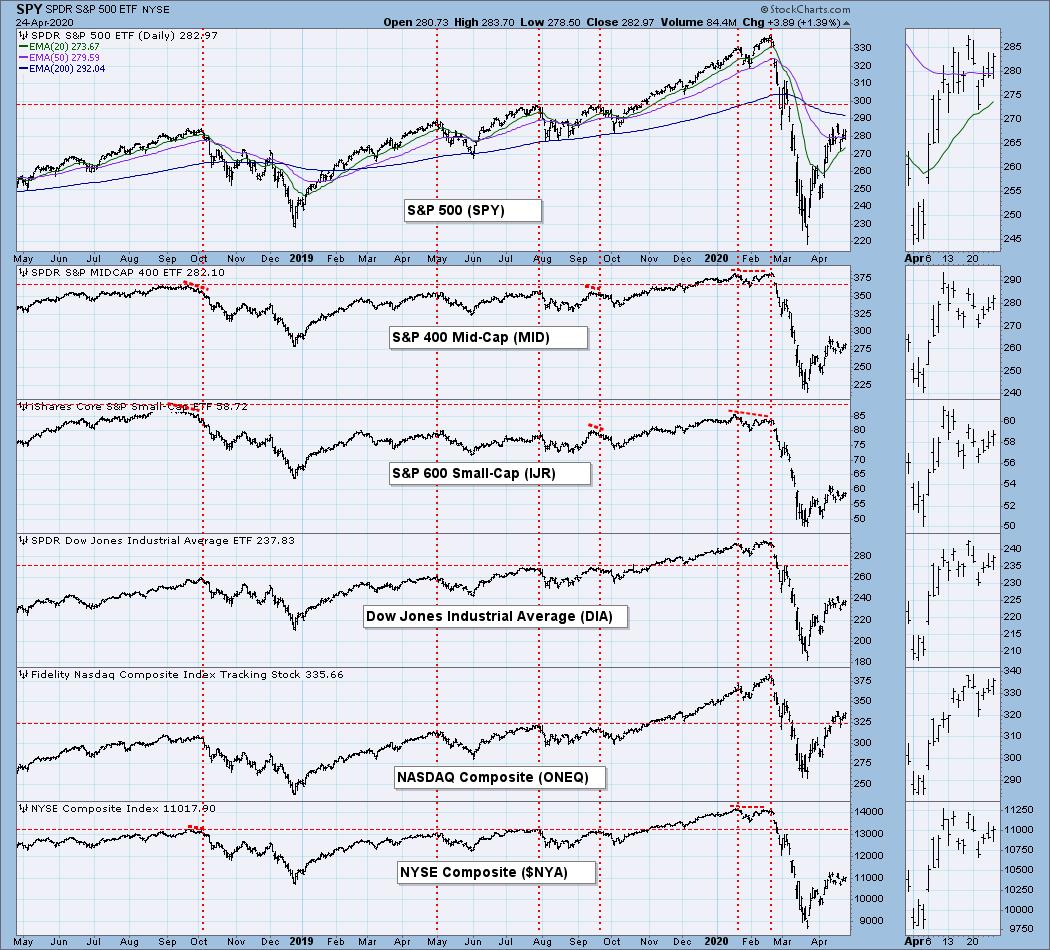
BROAD MARKET INDEXES
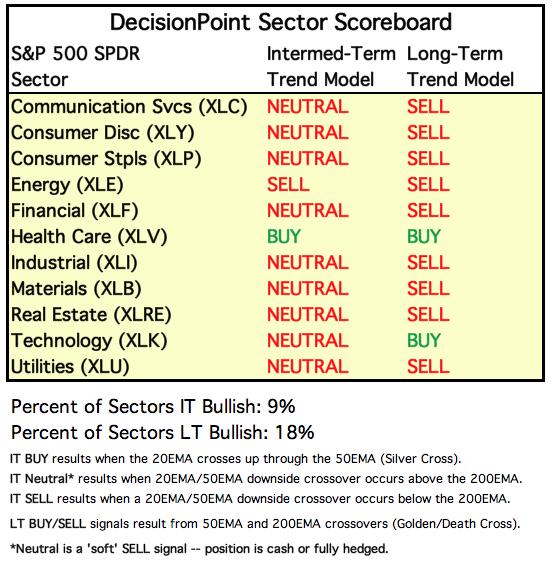
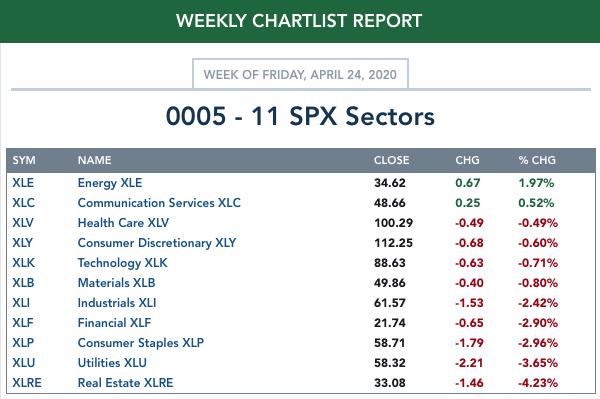
SECTORS
Each S&P 500 Index component stock is assigned to one, and only one, of 11 major sectors. This is a snapshot of the Intermediate-Term (Silver Cross) and Long-Term (Golden Cross) Trend Model signal status for those sectors.
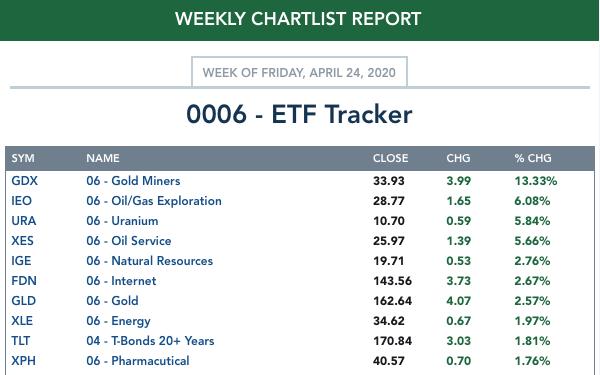
ETF TRACKER: This is a list of about 100 ETFs intended to track a wide range of U.S. market indexes, sectors, global indexes, interest rates, currencies, and commodities. StockCharts.com subscribers can acquire it in the DecisionPoint Trend and Condition ChartPack.
Top 10 . . .
. . . and bottom 10: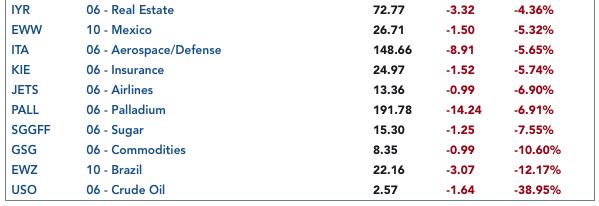
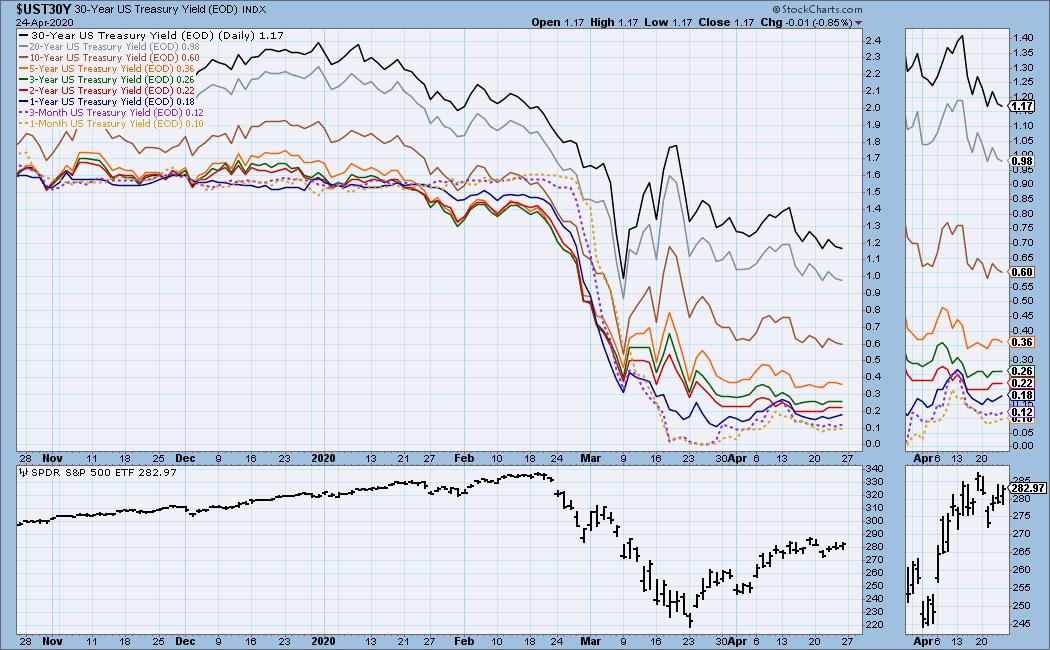
INTEREST RATES
This chart is included so we can monitor rate inversions. In normal circumstances the longer money is borrowed the higher the interest rate that must be paid. When rates are inverted, the reverse is true.
STOCKS
IT Trend Model: NEUTRAL as of 2/28/2020
LT Trend Model: SELL as of 3/19/2020
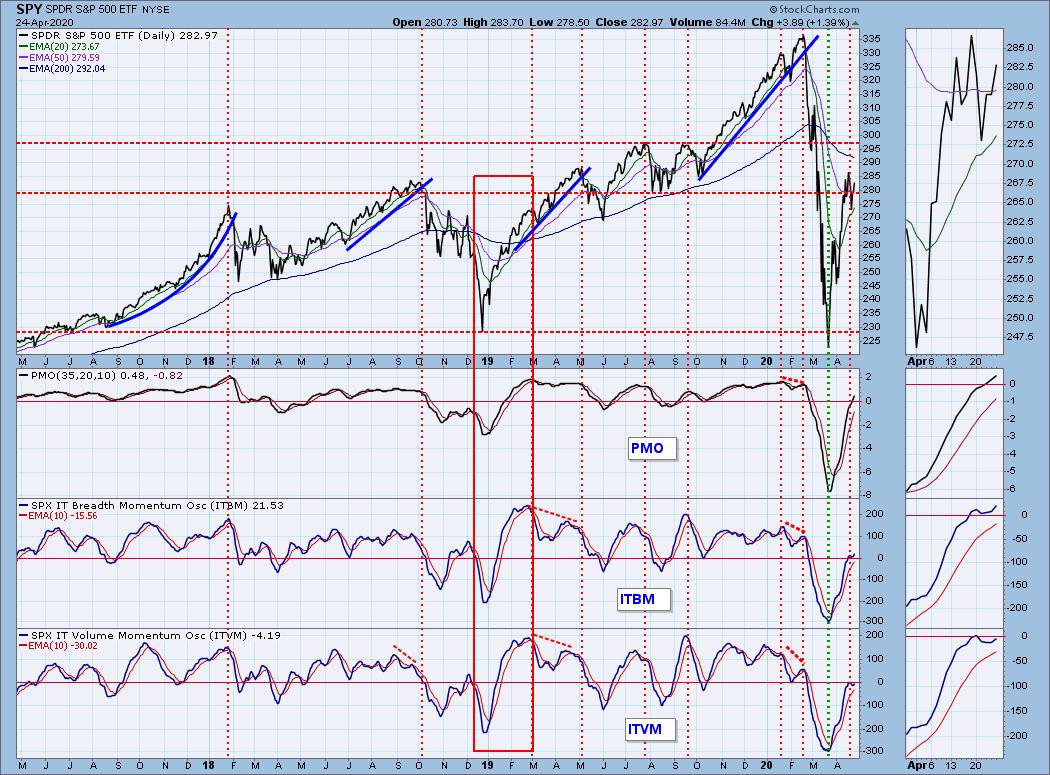
SPY Daily Chart: The rising wedge fulfilled my expectations by resolving downward on Tuesday. Since then, price has ridden up just under the bottom of the wedge, failing to reward my patience with any follow through. I plan to redraw the rising trend line next week (across the two April lows).
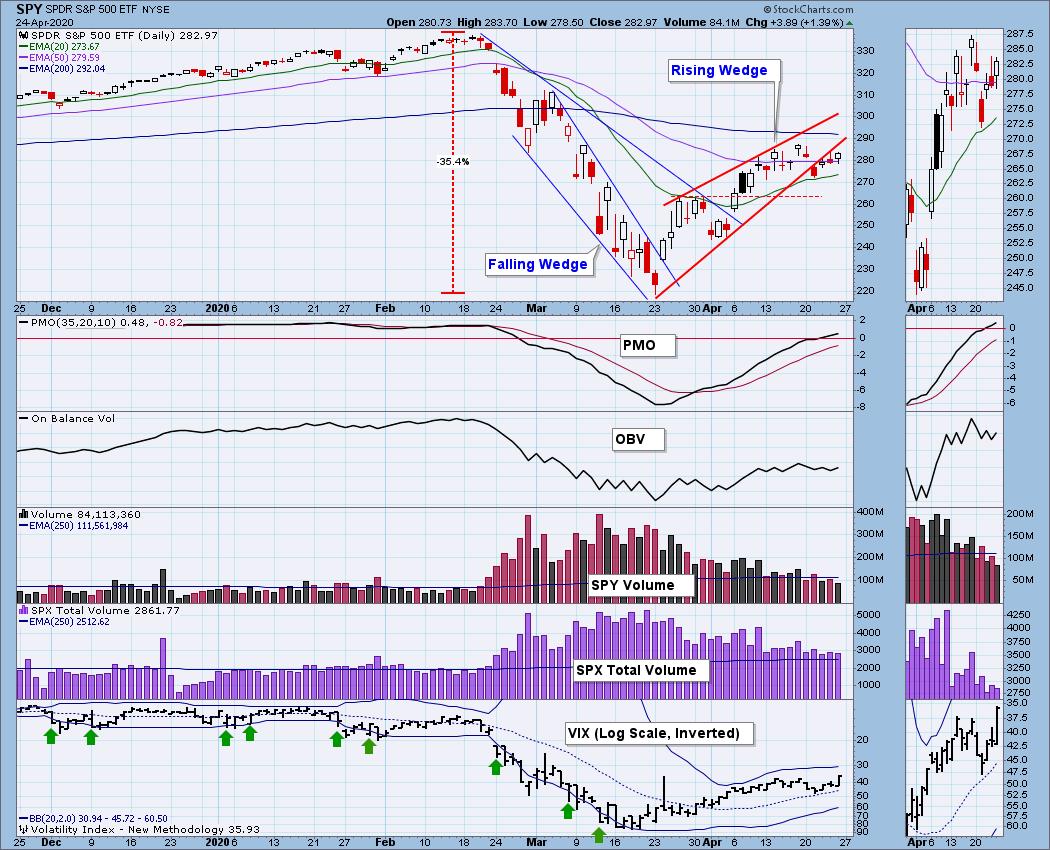
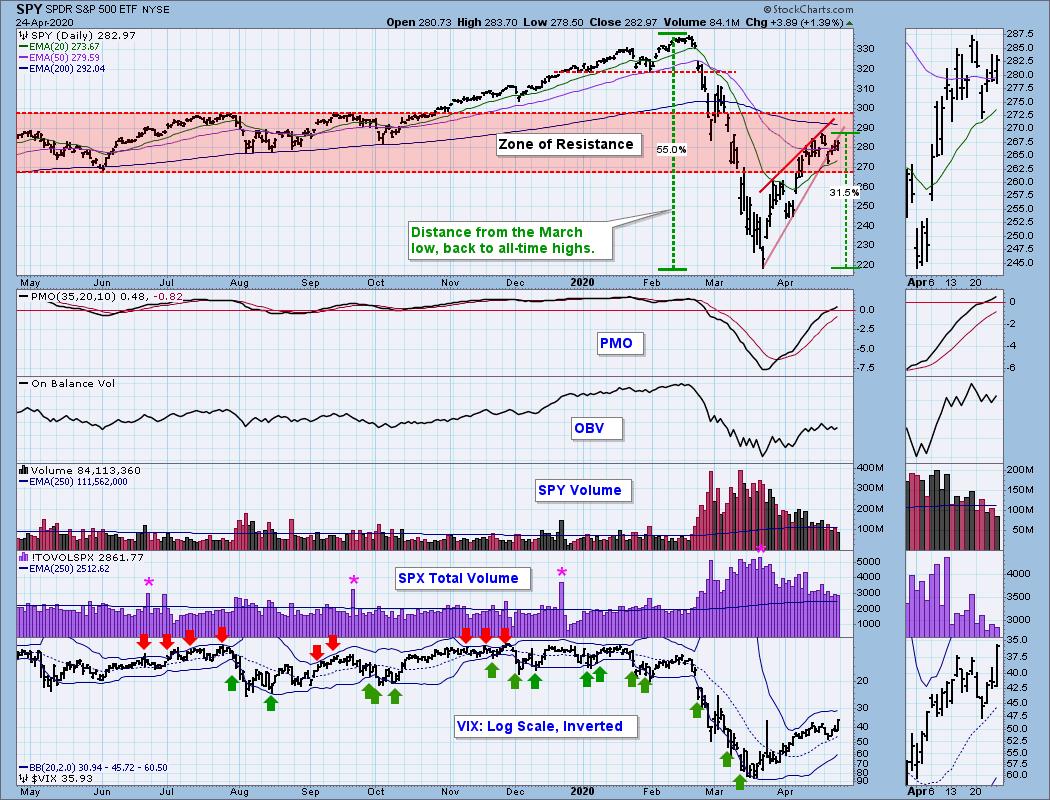
Clark, a subscriber, has suggested that the price action of the last few weeks appears to be building flag formations on the major U.S. and global indexes. They are not the best flags I've ever seen, but, yes, I'll buy it -- I can see the flag/consolidation as preparation for another push upward -- however, the top of the zone of resistance looks like a probable termination level. I should mention, the flags are more convincing on the 3-year charts near the top of this article.
The daily PMO is not all the way to the top of its range, but it is truly overbought, considering the distance it has traveled from its March low.
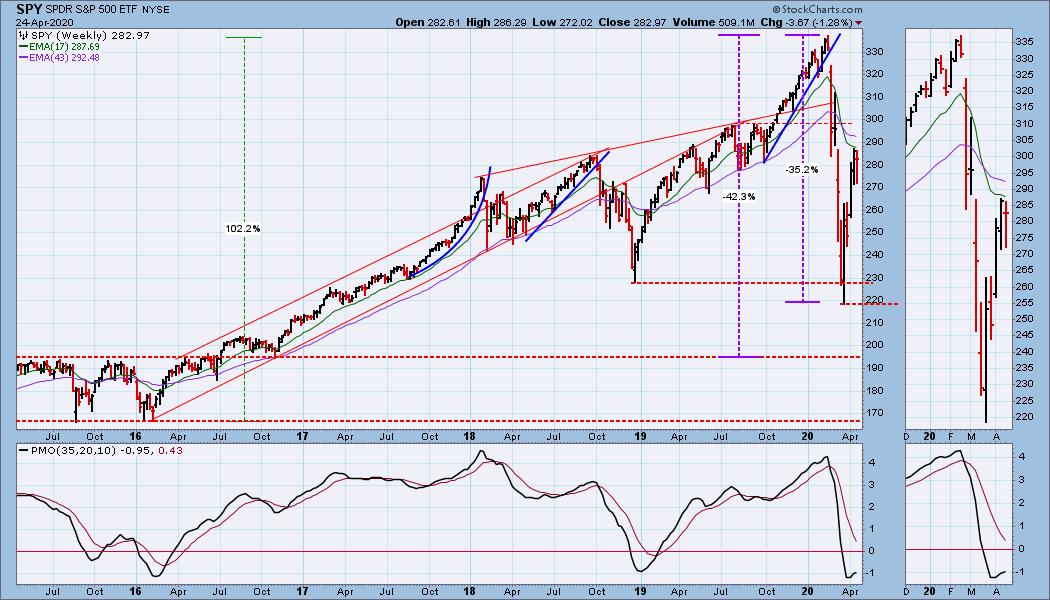
SPY Weekly Chart: The weekly PMO is oversold, but it is trying to turn down, which would be bearish.
Climactic Market Indicators: There was climactic breadth on Wednesday and Friday, but volume did not join in.
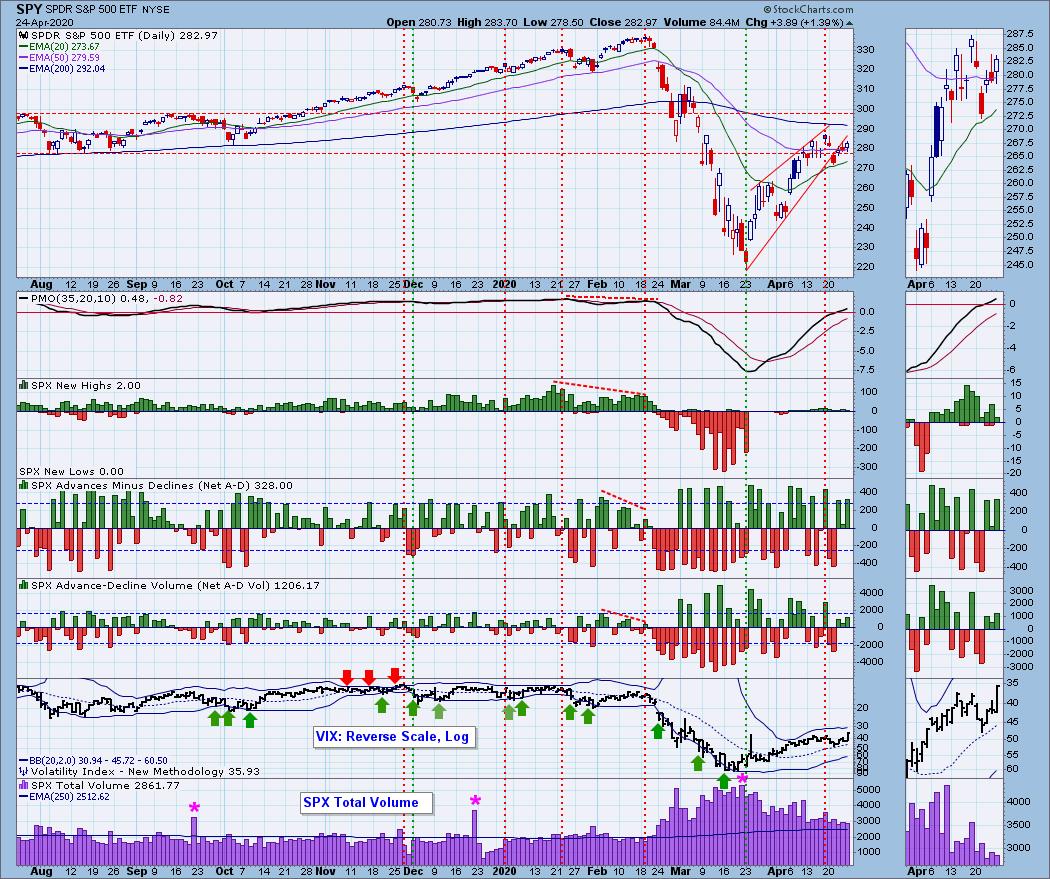
Short-Term Market Indicators: The short-term market trend is UP and the condition is NEUTRAL. The STO-V topped below the zero line on Friday, and the STO-B is almost there. Tops below the zero line are bearish in this time frame, so I'll project that next week will close down.
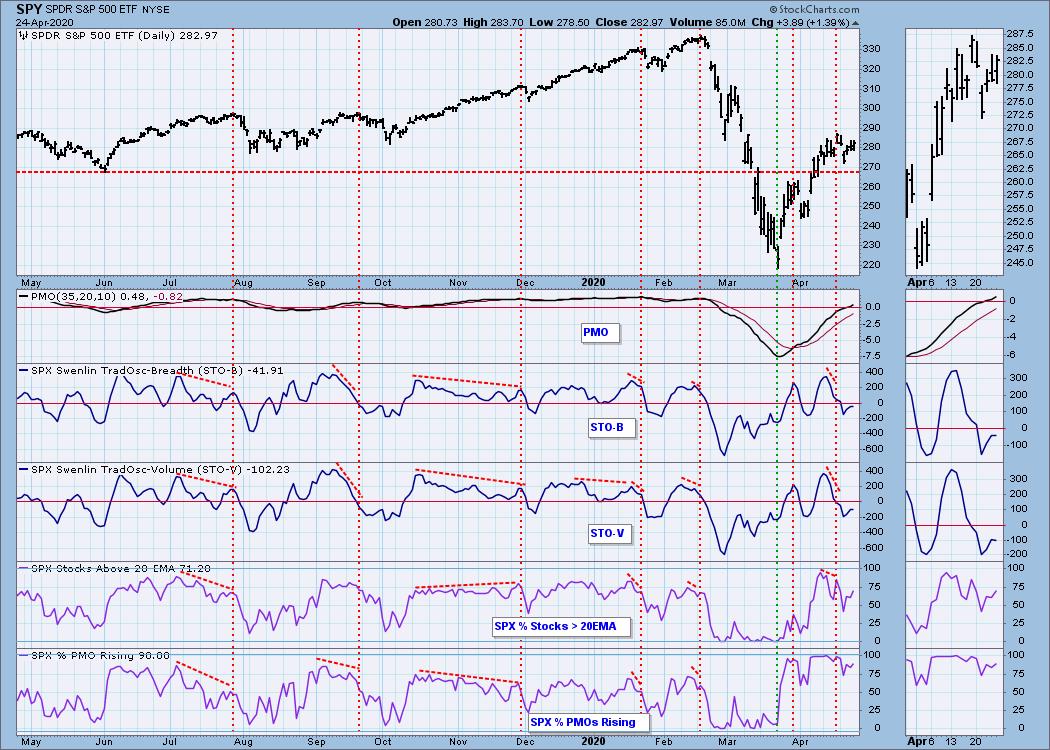
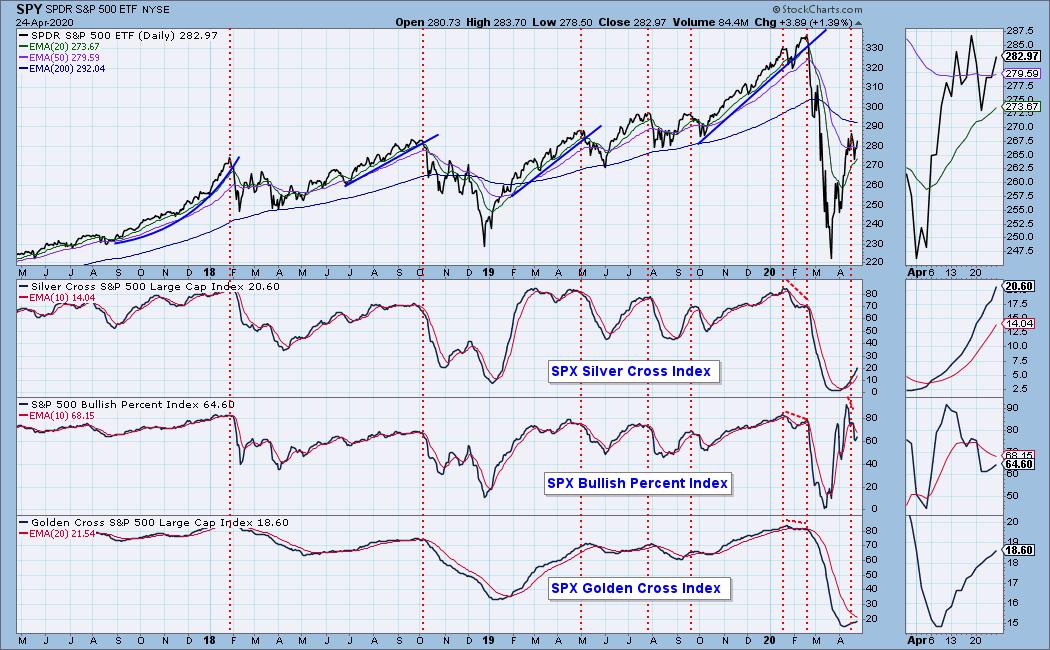
Intermediate-Term Market Indicators: The Silver/Golden Cross Indexes still reflect how oversold individual stocks in the S&P 500 became.
The intermediate-term market trend is UP and the condition is OVERBOUGHT. My judgment that the market is overbought has more to do with the distance the indicators have traveled from their low than their relation to the top of the historical range. And they are starting to falter.
CONCLUSION: A survey taken in New York City showed that one in five people have the COVID-19 antibody, meaning that they had the virus and recovered. It means also, among other things, that the mortality rate is much lower than originally projected. In my mind, I am seeing a much better outcome than has been anticipated, although, the apparent improvement could, of course, be overshadowed by future developments. If the free enterprise system is allowed to fully engage, I have high hopes for the speed of the recovery, with biggest problem being to get the government to hell out of the way.
I still think that a bear market (secular) is in force; however, since the market has advanced about 31% since the March low, I have to assume we have entered a bull market (cyclical). Nevertheless, as I discussed at the beginning of this article, volatility is still high, and the market has not regained the temperament of a confident, plodding bull. It is a case where we won't know for sure until after the fact. If new 52-week highs are made, this rally was the beginning of a new bull market. If new 52-week lows are made, this rally is irrelevant.
Short-term indicators point to next week being a down week. Intermediate-term indicators are overbought, and a down week could extend to much longer.
Have you subscribed the DecisionPoint Diamonds yet? DP does the work for you by providing handpicked stocks/ETFs from exclusive DP scans! Add it with a discount! Contact support@decisionpoint.com for more information!
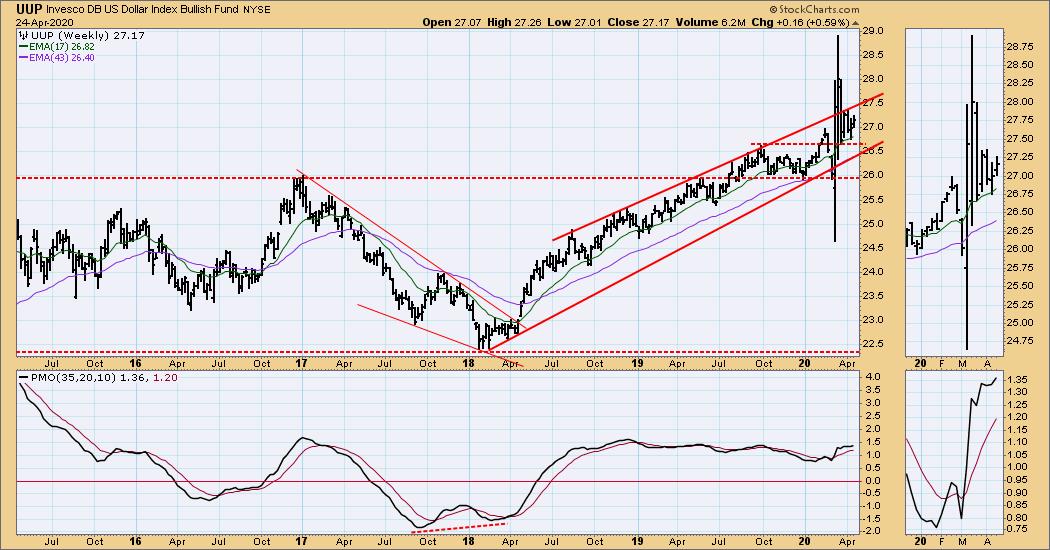
DOLLAR (UUP)
IT Trend Model: BUY as of 3/13/2020
LT Trend Model: BUY as of 5/25/2018
UUP Daily Chart: The UUP chart resembles the TLT chart in that it had a volatile March, and now seems to be trending higher. I wonder how this will be able to persist with us piling on more massive debt.
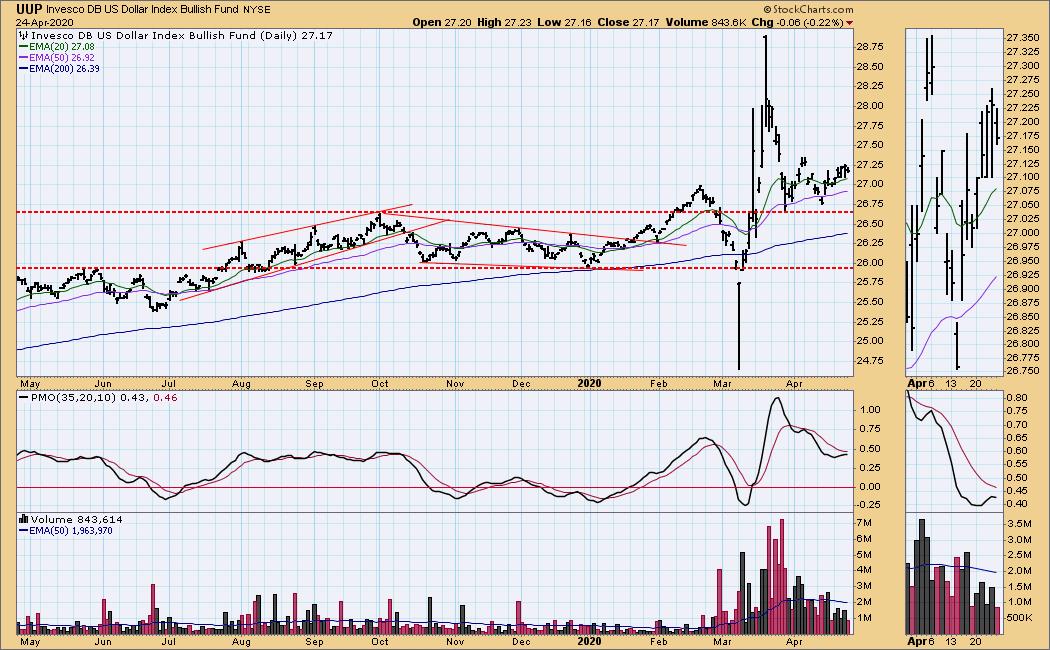
UUP Weekly Chart: Here I'm looking at March as an outlier in the context of a rising trend channel.
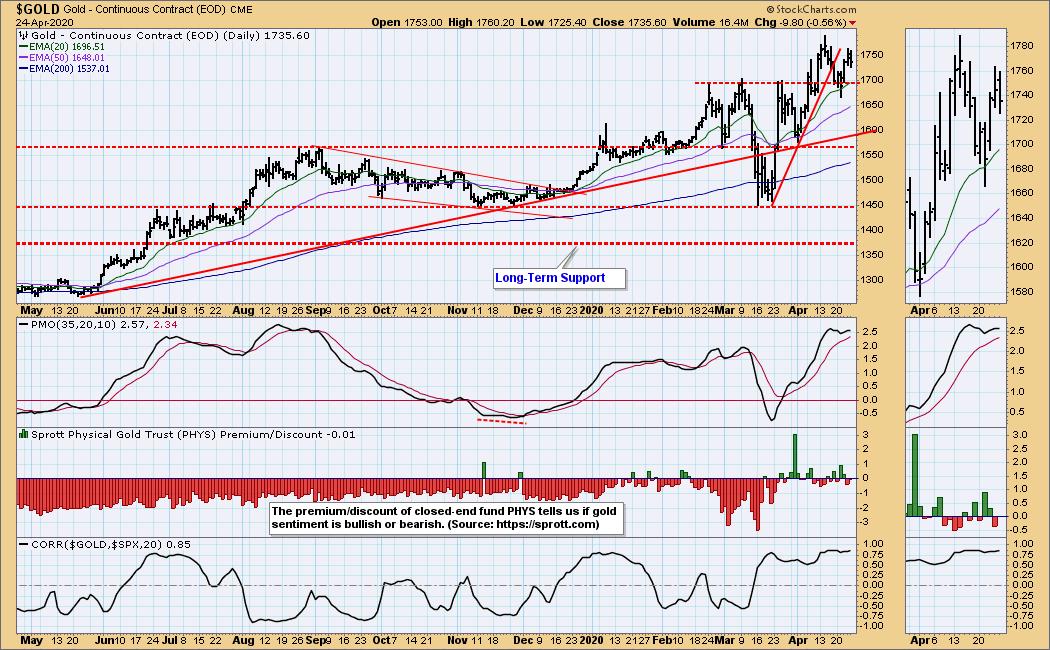
GOLD
IT Trend Model: BUY as of 12/26/2019
LT Trend Model: BUY as of 1/8/2019
GOLD Daily Chart: I often refer to gold's progress as being "tortured," and I have no reason to abandon the term now. In this time frame, gold has been positively correlated with stocks since mid-March, which accounts to the sharp pullback followed by a nice rally. The daily PMO is overbought, so we should expect a period of consolidation or pullback.
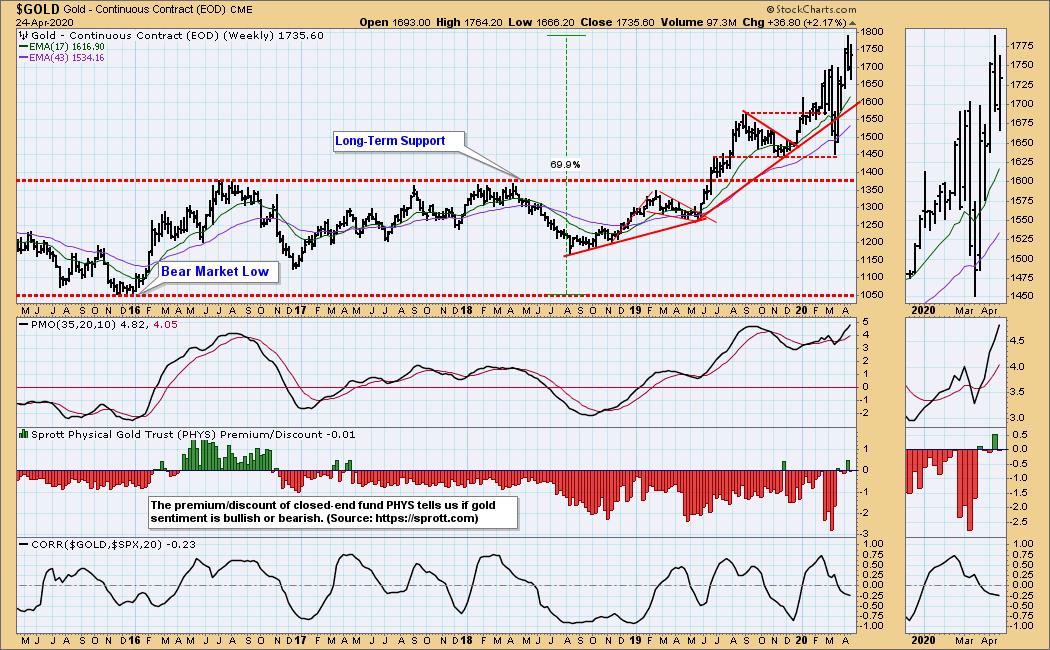
GOLD Weekly Chart: The weekly PMO is also overbought, and a move back to the rising trend line seems reasonable.
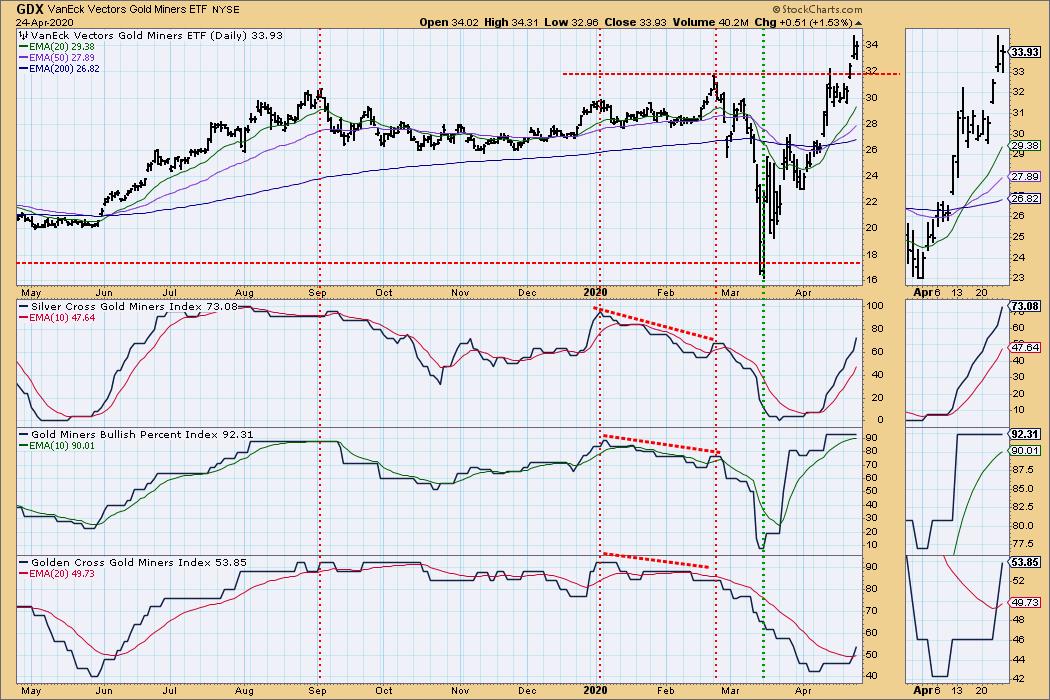
GOLD MINERS Golden and Silver Cross Indexes: Gold miners broke out this week. While the early warning Bullish Percent Index is overbought, the Silver Cross and Golden Cross Indexes allow for the rally to continue before they reach overbought levels.
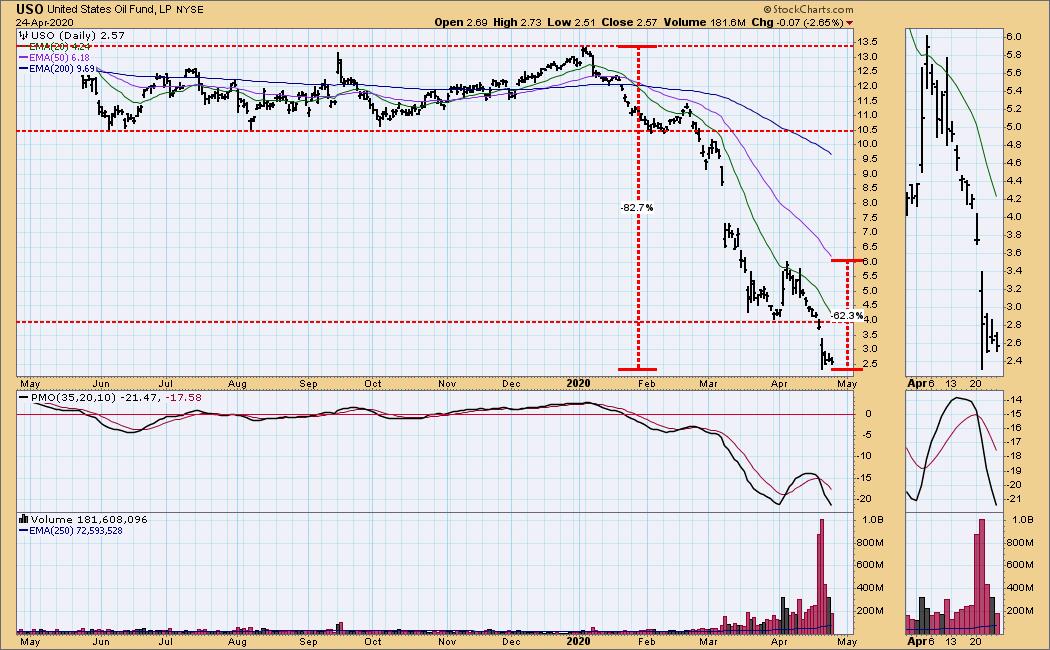
CRUDE OIL (USO)
IT Trend Model: NEUTRAL as of 1/27/2020
LT Trend Model: SELL as of 2/3/2020
USO Daily Chart: This week, for the first time ever the crude oil futures near contract (May) traded well below zero, basically because there is no place to store the oil because of low demand, and the contract was expiring. We can see how this affected USO, driving it to lows that may prompt a reverse split. (That's not something I've heard, but reverse splits are sometimes what happens when price starts crowding the bottom of the chart.) The daily PMO is super-oversold.
USO Weekly Chart: The weekly PMO is very oversold, second only to the PMO low generated by the 2008 crude oil crash (visible on the monthly chart below.
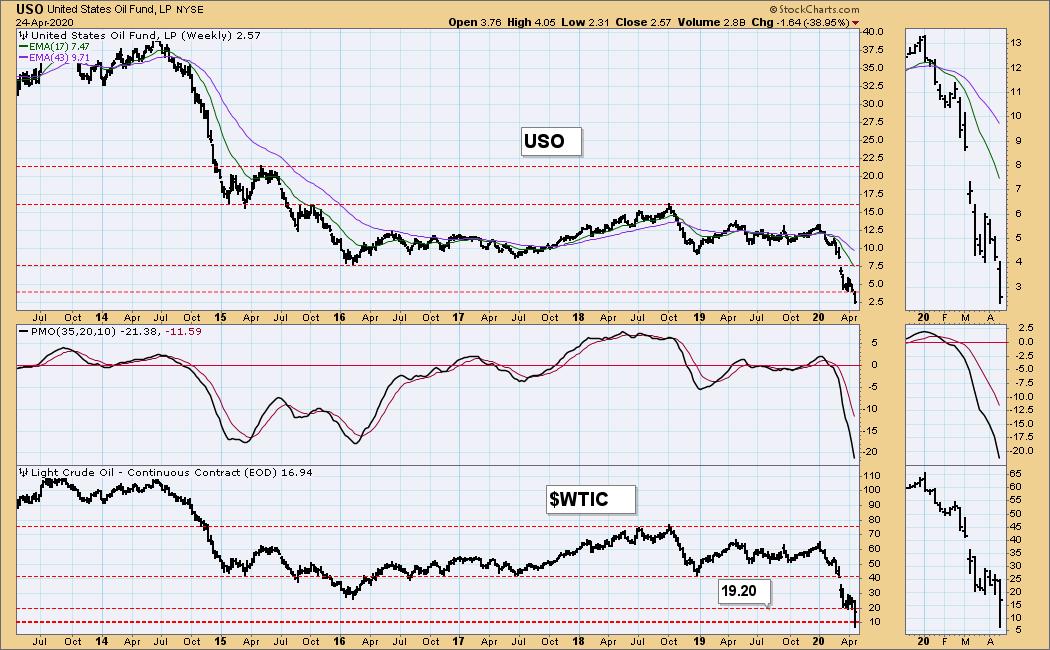
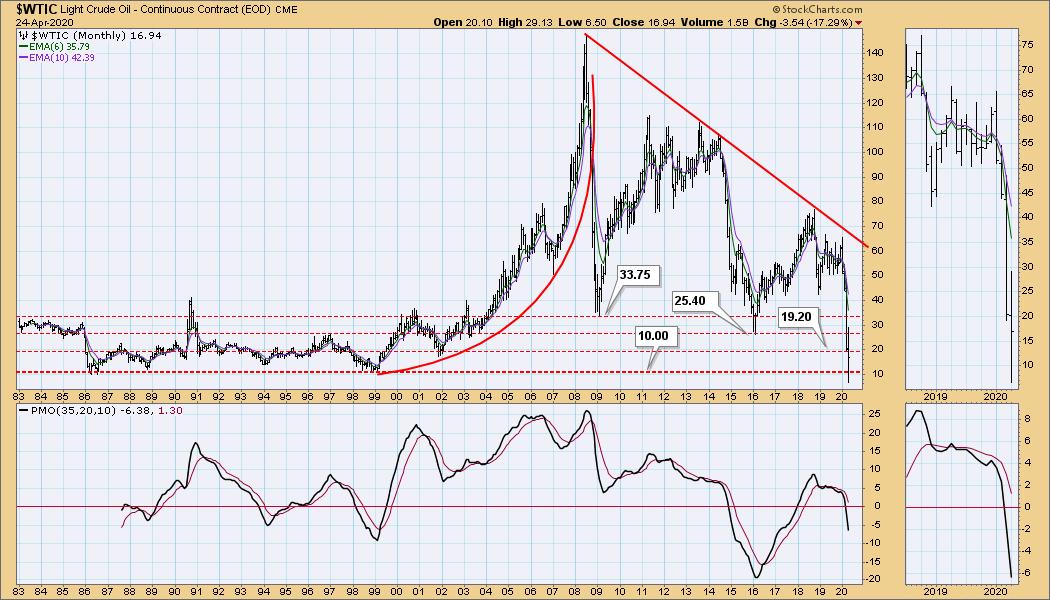
WTIC Monthly Chart: WTIC made a brief intraday plunge below the historical low support line at 10.00. I am amazed that not too long ago I didn't think we'd see it reach that support.
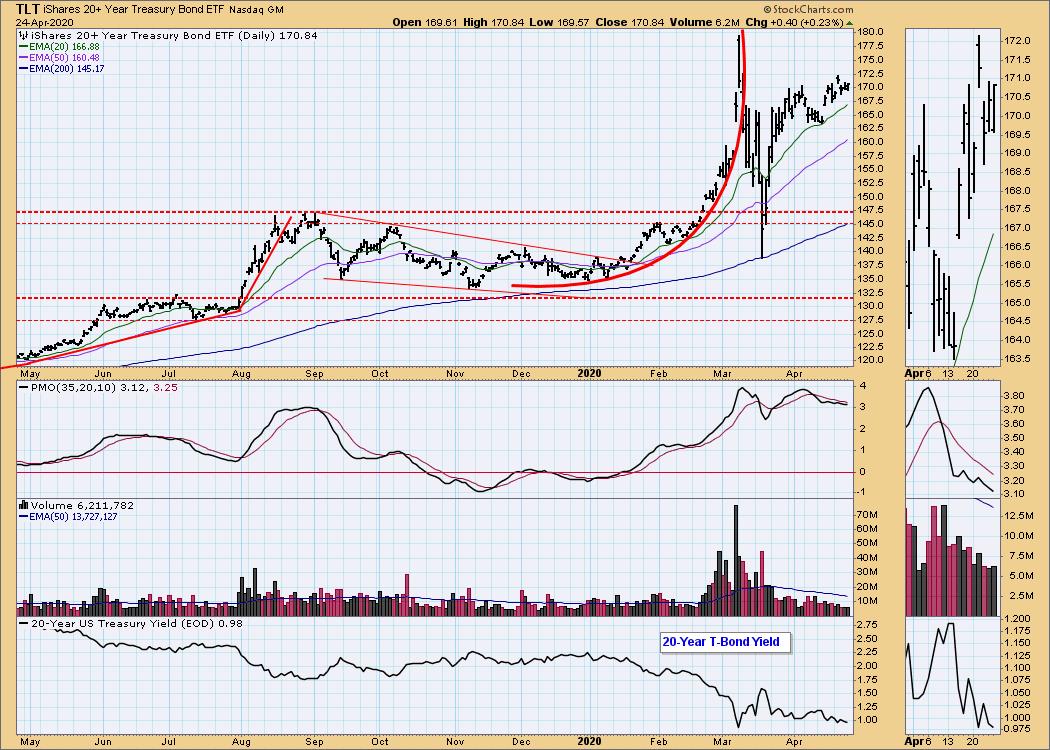
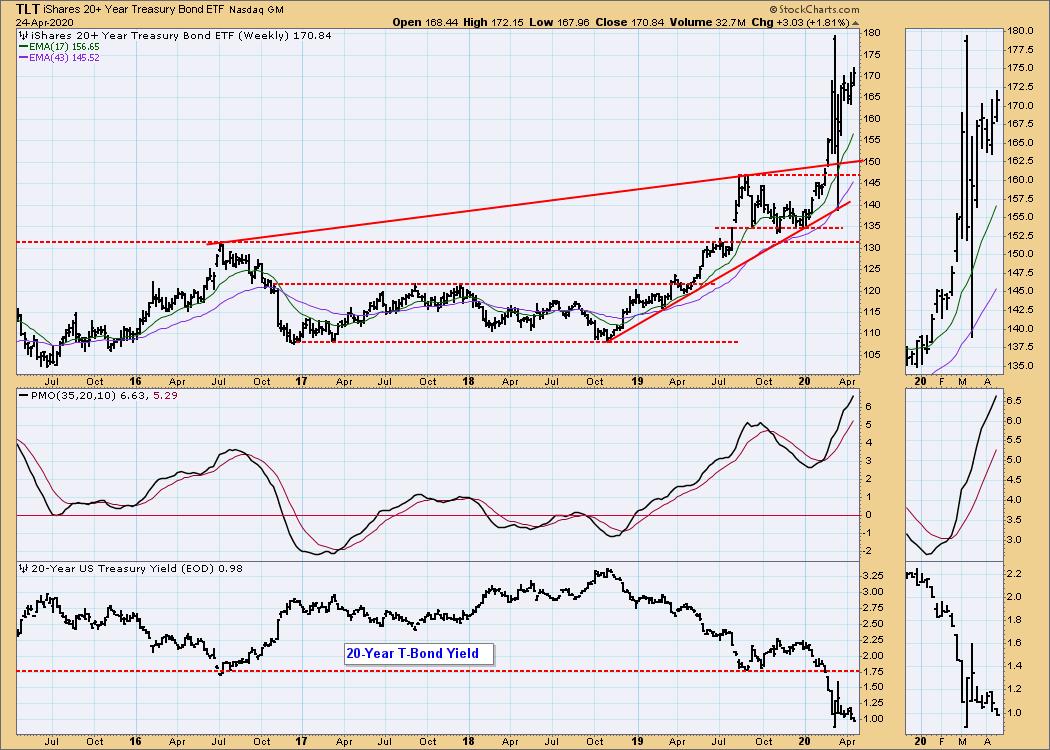
BONDS (TLT)
IT Trend Model: BUY as of 1/22/2020
LT Trend Model: BUY as of 1/2/2019
TLT Daily Chart: After the initial volatility in March passed, price has settled down to a steady advance. Since the 20-year bond has a one percent yield, there is still room for higher prices, even higher than the March top.
TLT Weekly Chart: The weekly PMO is very overbought, but I don't think that is going to limit the upside.
Technical Analysis is a windsock, not a crystal ball.
Happy Charting! - Carl
NOTE: The signal status reported herein is based upon mechanical trading model signals, specifically, the DecisionPoint Trend Model. They define the implied bias of the price index based upon moving average relationships, but they do not necessarily call for a specific action. They are information flags that should prompt chart review. Further, they do not call for continuous buying or selling during the life of the signal. For example, a BUY signal will probably (but not necessarily) return the best results if action is taken soon after the signal is generated. Additional opportunities for buying may be found as price zigzags higher, but the trader must look for optimum entry points. Conversely, exit points to preserve gains (or minimize losses) may be evident before the model mechanically closes the signal.
Helpful DecisionPoint Links:
DecisionPoint Alert Chart List
DecisionPoint Golden Cross/Silver Cross Index Chart List
DecisionPoint Sector Chart List
Price Momentum Oscillator (PMO)
Swenlin Trading Oscillators (STO-B and STO-V)