
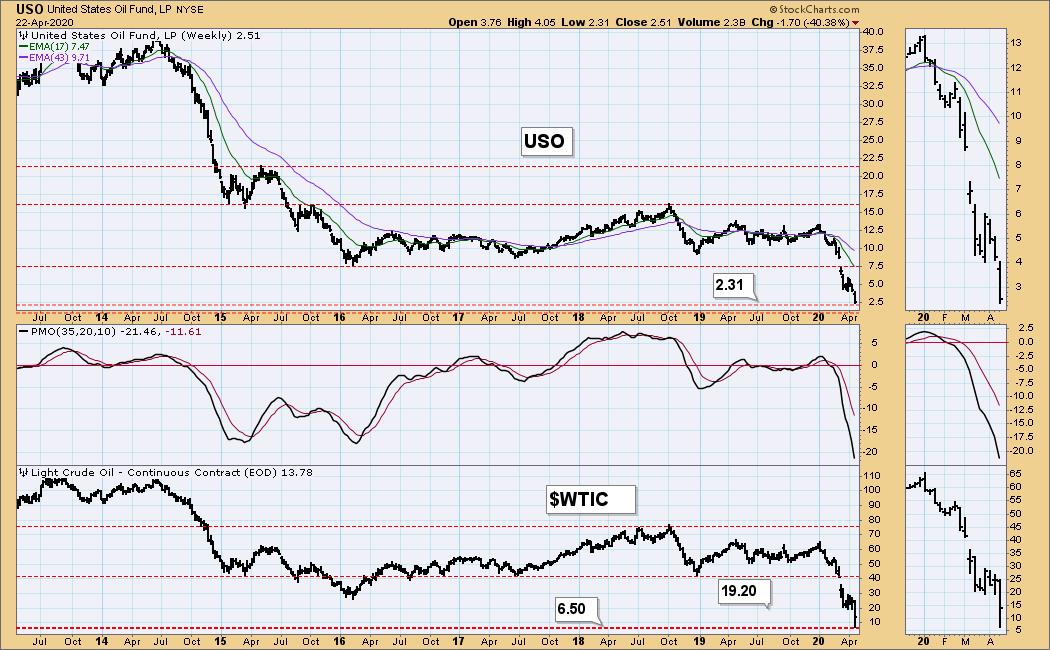
It's hard not to open with Oil again. Both $WTIC and USO dropped below the 1986 lows, setting an intraday record yesterday. It's hard to believe it still managed another 10% drop on the day. Currently only three days into the week, Oil is down over 40%. I concluded yesterday that with the major glut in supply and demand at historic lows, it will be some time before this area of the market rights itself. What's interesting is that the Energy sector is perking up short term.
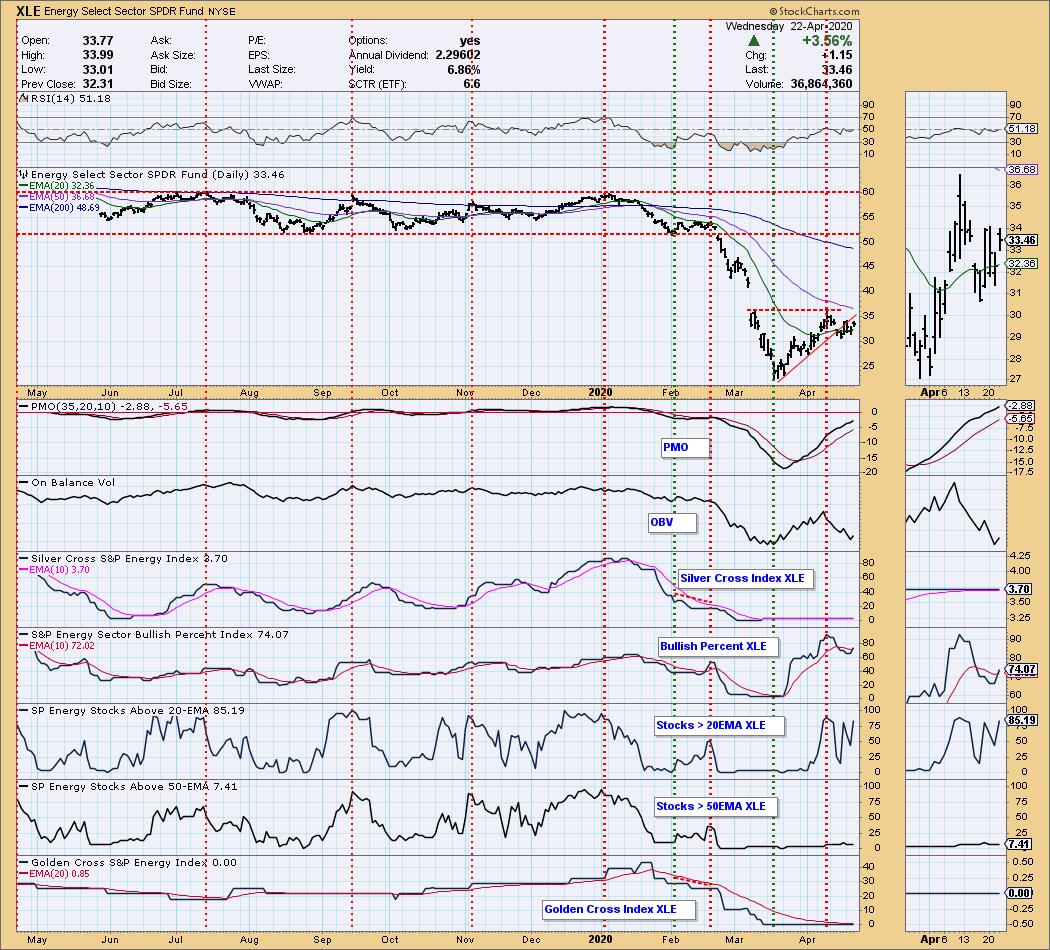
Energy was up over 3.56% which was just under Technology which was up 3.85%. The sector remains sluggish in the intermediate and long term with a SCTR of only 6.6 and a Golden Cross Index of 0.00, that means that none of the members of XLE have 50-EMAs > 200-EMAs. Oil most certainly is providing downside pressure on this sector, but despite that, it has been able to push price higher and get more members above their 20-EMA. It's not a sector I would put money in, mainly because there are other areas of the market that don't have to fight against Oil.
Today I was on the new StockCharts TV show "Your Daily Five". It's a 10 minute review of the top five charts I'm watching right at that moment. Here is the link to the YouTube video.
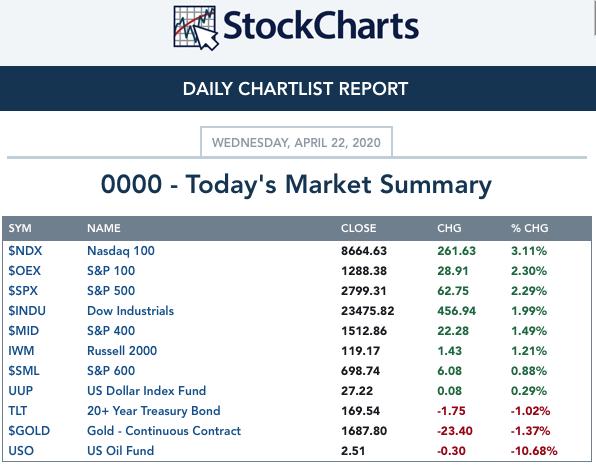
TODAY'S Broad Market Action:
Past WEEK Results: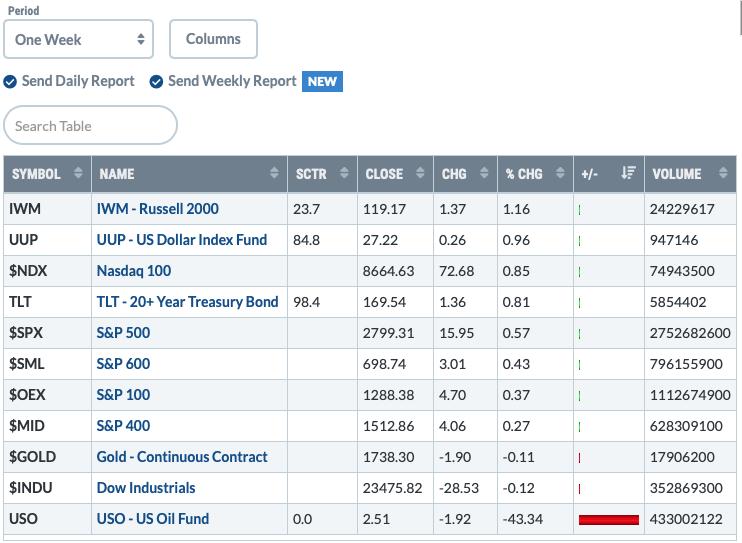
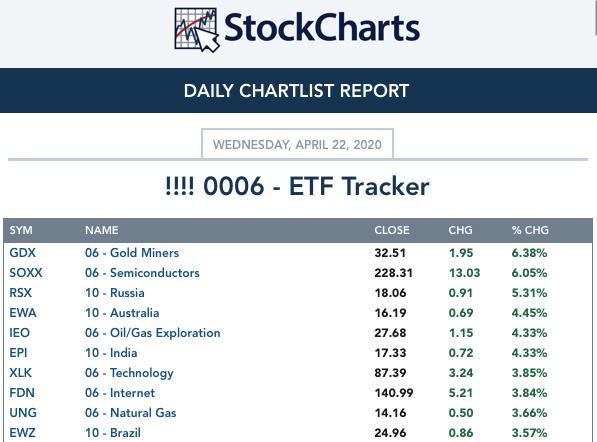
Top 10 from ETF Tracker:
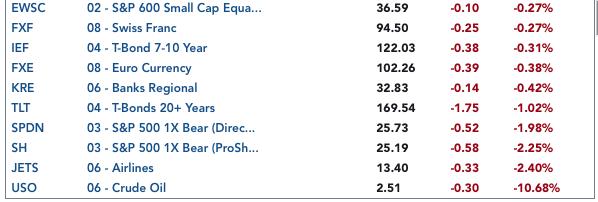
Bottom 10 from ETF Tracker:
On Friday, the DecisionPoint Alert Weekly Wrap presents an assessment of the trend and condition of the stock market (S&P 500), the U.S. Dollar, Gold, Crude Oil, and Bonds. Monday through Thursday the DecisionPoint Alert daily report is abbreviated and covers changes for the day.
Watch the latest episode of DecisionPoint on StockCharts TV's YouTube channel here!
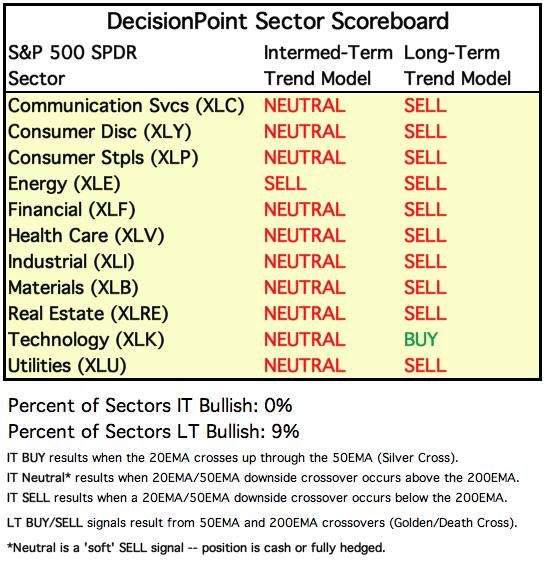
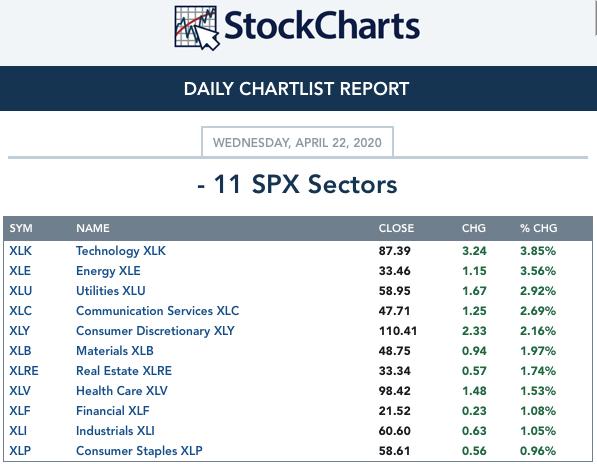
SECTORS
SIGNALS:
Each S&P 500 Index component stock is assigned to one, and only one, of 11 major sectors. This is a snapshot of the Intermediate-Term (Silver Cross) and Long-Term (Golden Cross) Trend Model signal status for those sectors.
TODAY'S RESULTS:
One WEEK Results: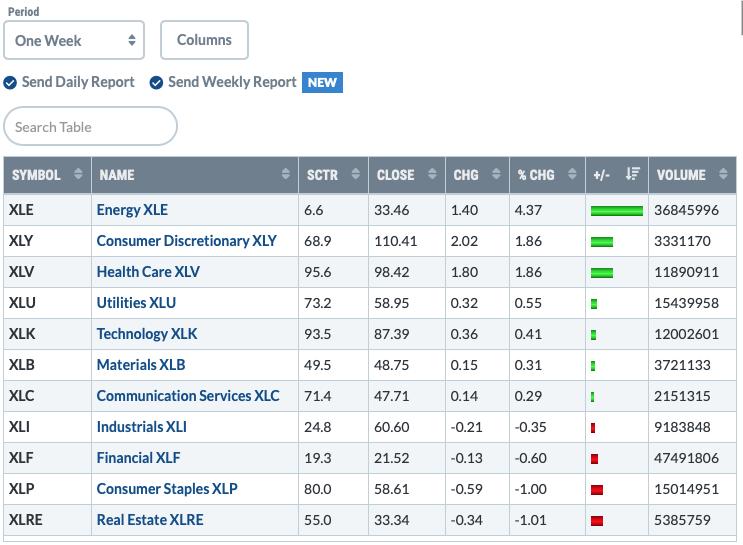
STOCKS
IT Trend Model: NEUTRAL as of 2/28/2020
LT Trend Model: SELL as of 3/19/2020
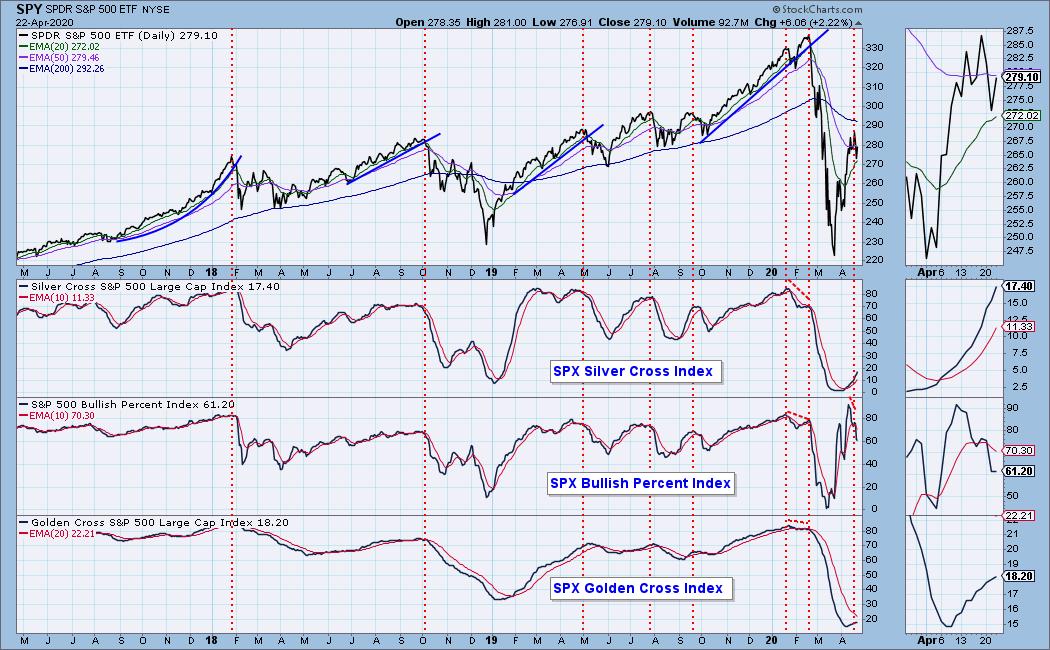
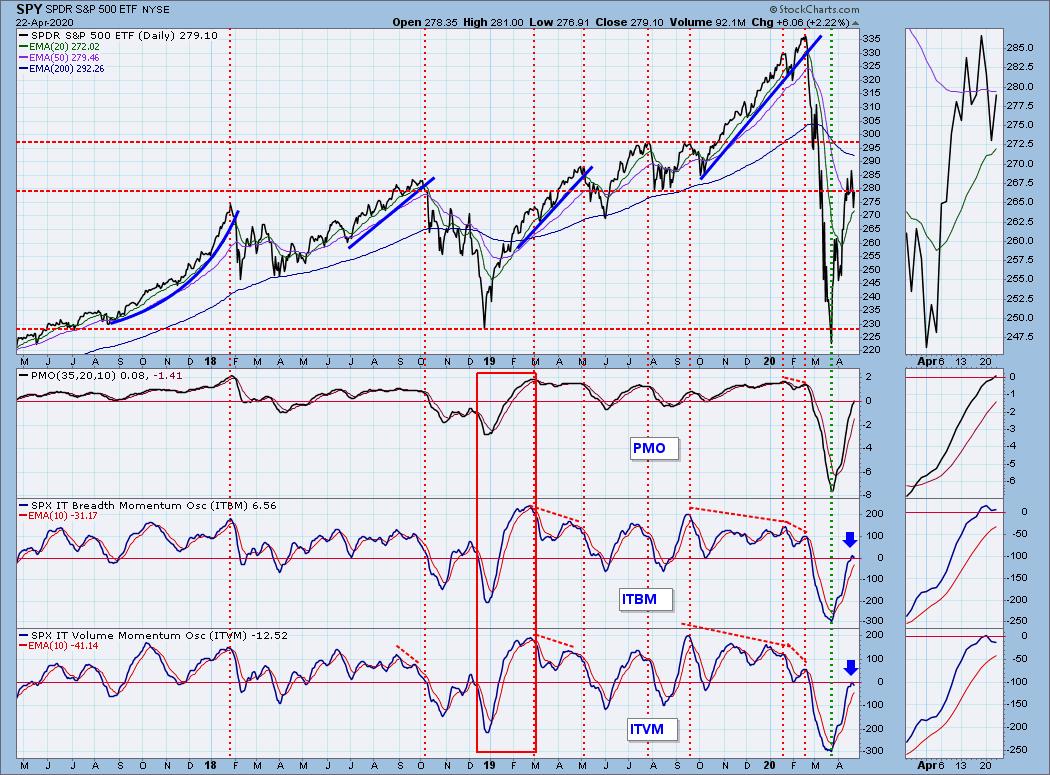
SPY Daily Chart: Price was unable to recapture the original rising trendline that constructs the bottom of the rising wedge. Price also closed below the 50-EMA. The PMO is now above zero, but looking at the big picture, it could be considered an overbought reading because we are still looking at a bear market configuration of the EMAs (50-EMA < 200-EMA). Volume declined on today's rise and I note that it is the first time SPY volume was below its annual 250-EMA. This does make the rally today slightly suspect.
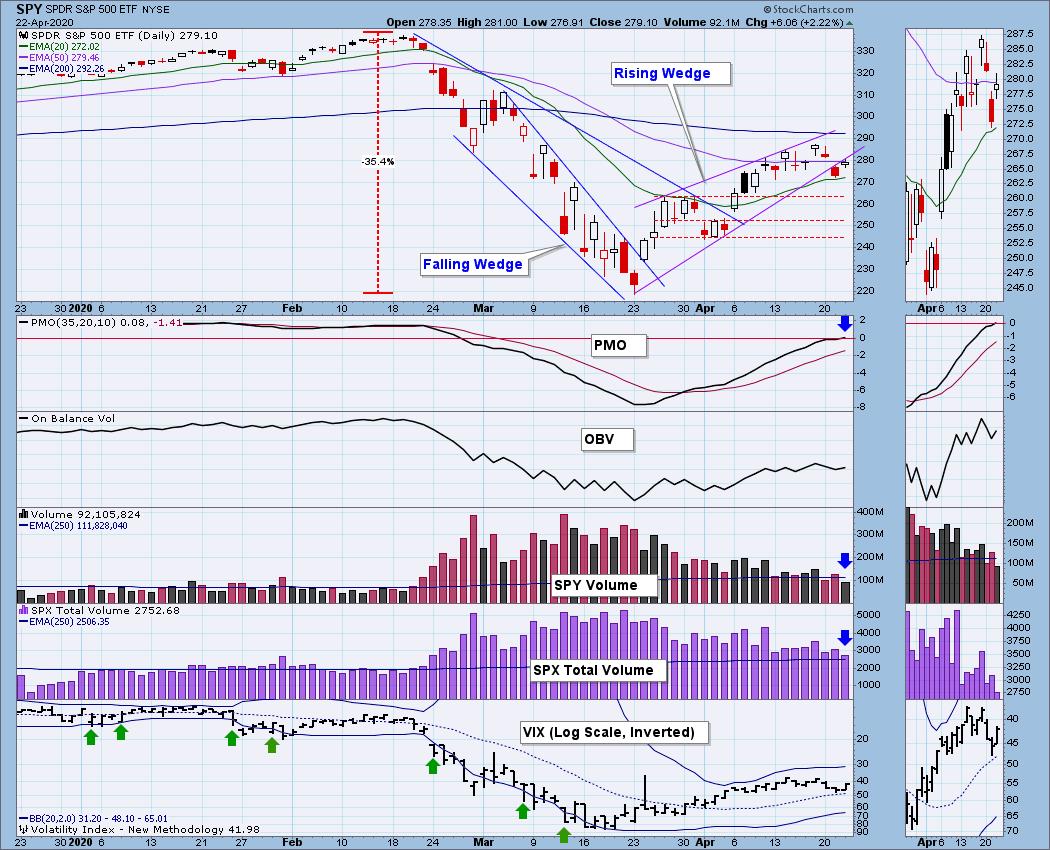
Climactic Market Indicators: Apparently yesterday's climactic downside readings on breadth were a selling exhaustion. Today's readings aren't that climactic given recent history, but they could be read as an initiation to more buying. The VIX has turned up before dropping below its average on the inverse scale which is bullish.
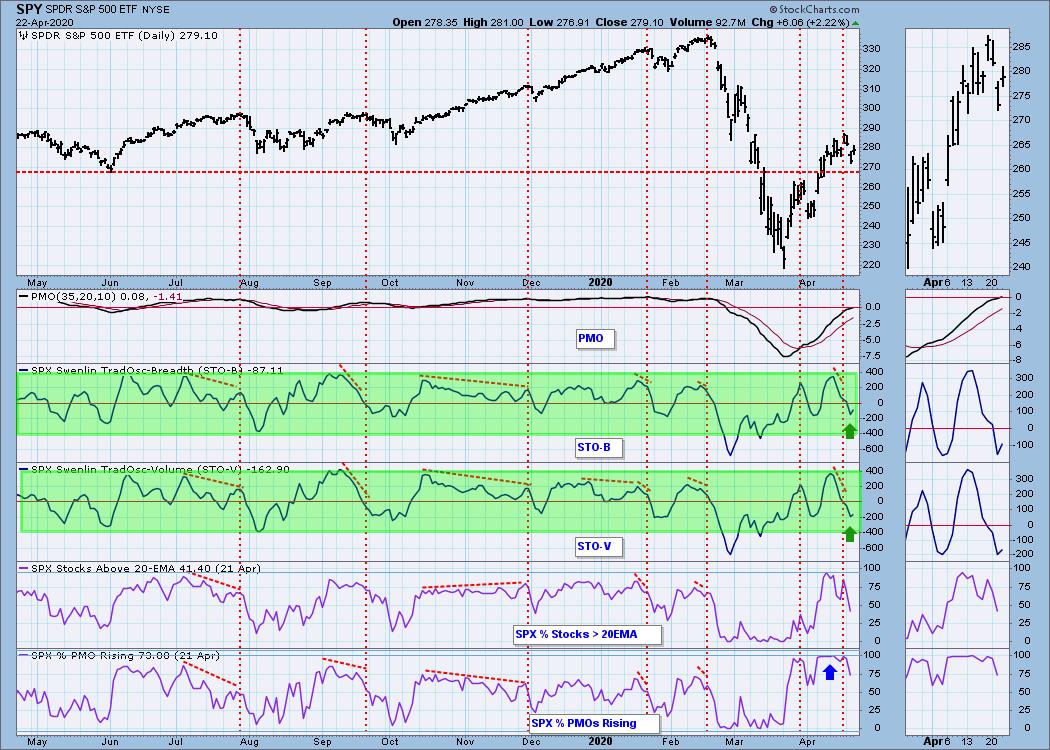
Short-Term Market Indicators: The ST trend is UP and the market condition is NEUTRAL based upon the Swenlin Trading Oscillator (STO) readings. We got an uptick on the STOs today which bodes well for a rally continuation. I'd prefer to see more than a "tick" upward, but these indicators have been pretty solid leading indicators with the exception of yesterday.
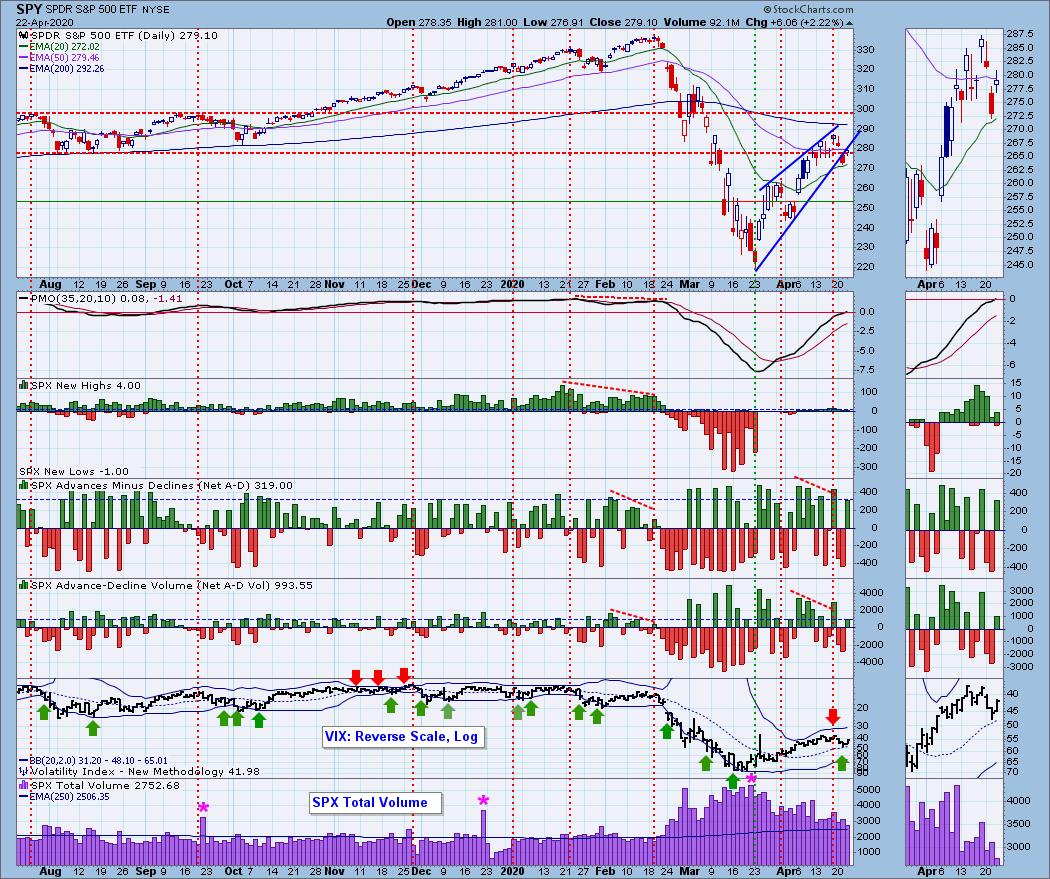
Intermediate-Term Market Indicators: The Silver Cross Index (% of SPX stocks 20EMA > 50EMA) and the Golden Cross Index (percent of SPX stocks 50EMA > 200EMA) are both rising. The BPI is attempting to bottom right now, but nothing spectacular. The SCI and GCI look bullish.
The IT trend is UP and the market condition is NEUTRAL based upon the ITBM and ITVM. The ITBM ticked up today and the ITVM is attempting to bottom. This is one reason why I prefer to wait for negative crossovers before moving bearish intermediate-term. Note this hesitation on the ITBM/ITVM in contrast to the move into a new bull market after the 2018 low. While we could be looking at the first leg of a new bull market, I don't think these indicators are confirming that.
CONCLUSION: The ST is UP and IT trend is also UP. Market condition based on ST indicators and IT indicators is NEUTRAL. While recording the DecisionPoint Show today (airs tomorrow morning on StockCharts TV), Carl and I discussed the bullish bias we are seeing on this rally out of the bear market low. It seems we can't get follow-through on declines. This is one reason why I believe the DP Diamonds have been indispensable. We've been able to identify strong areas and stocks to take advantage of short-term advances. In addition, yesterday, I listed stocks that had deep pullbacks on the market decline. Today's market rally was profitable for those stocks. Based on the indicators, I'm bullish short-term.
(Not a Diamonds subscriber? Add it to your DP Alert subscription and get a discount! Contact support@decisionpoint.com for your limited time coupon code!)
DOLLAR (UUP)
IT Trend Model: BUY as of 3/12/2020
LT Trend Model: BUY as of 5/25/2018
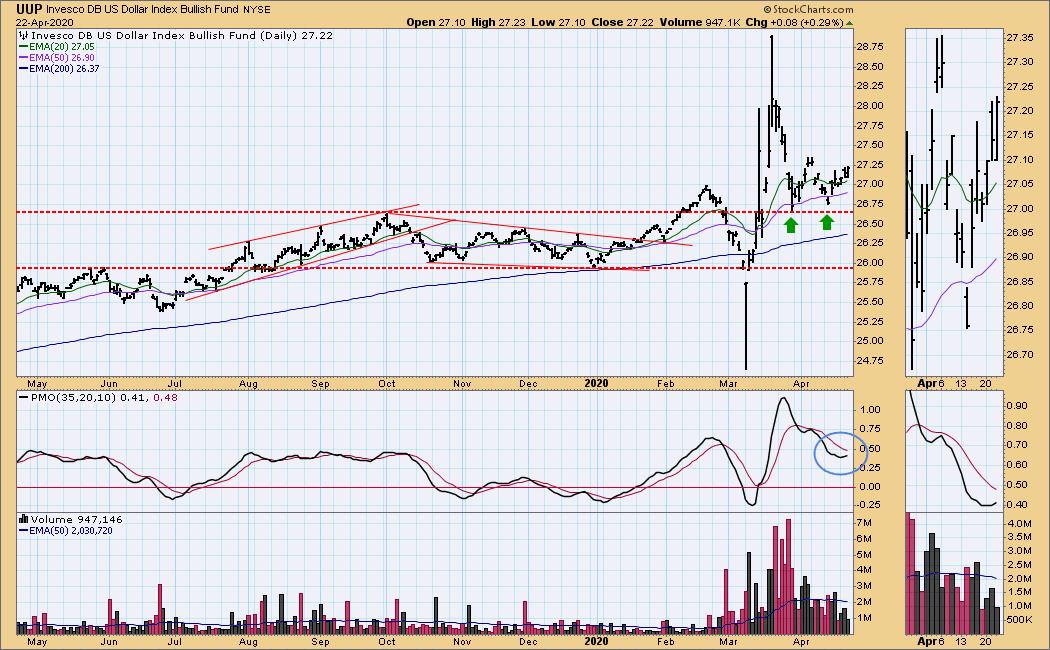
UUP Daily Chart: I've decided to annotate a short-term double-bottom on UUP. The PMO is turning up which suggests this might be the pattern to pay attention to.
GOLD
IT Trend Model: BUY as of 12/26/2019
LT Trend Model: BUY as of 1/8/2019
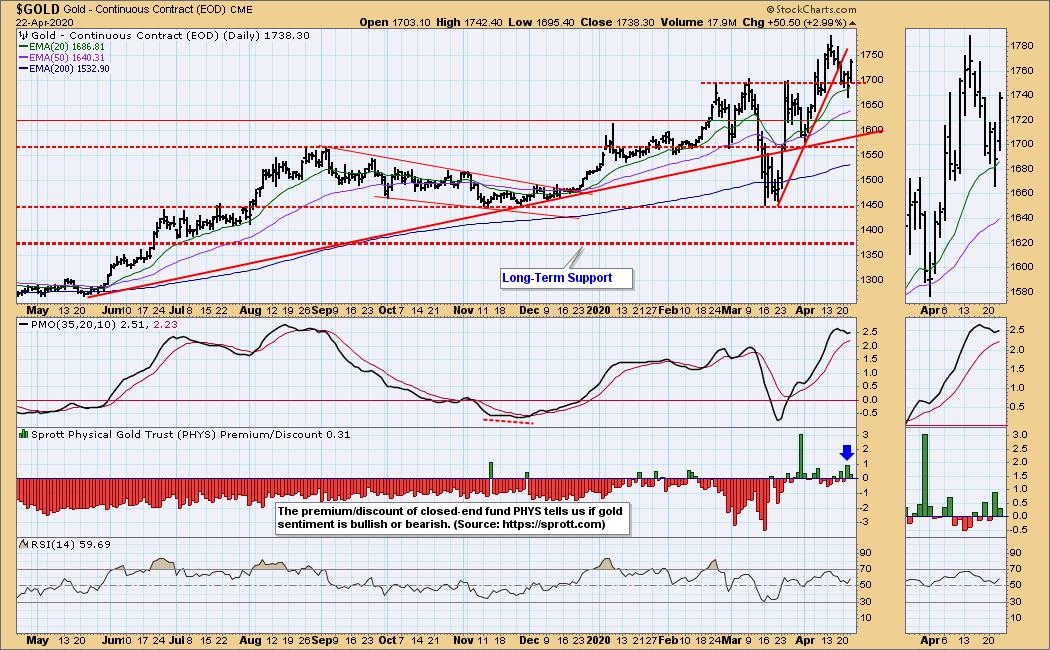
GOLD Daily Chart: Gold rebounded nicely today, spending most of its time above the 1700 support/resistance level. The PMO is somewhat overbought, but we did see it turn up today. Interest level is there for Gold based on the premiums we are now seeing on PHYS. Given the strong rally today, I would expect it to take some time to digest before it challenges the April top.
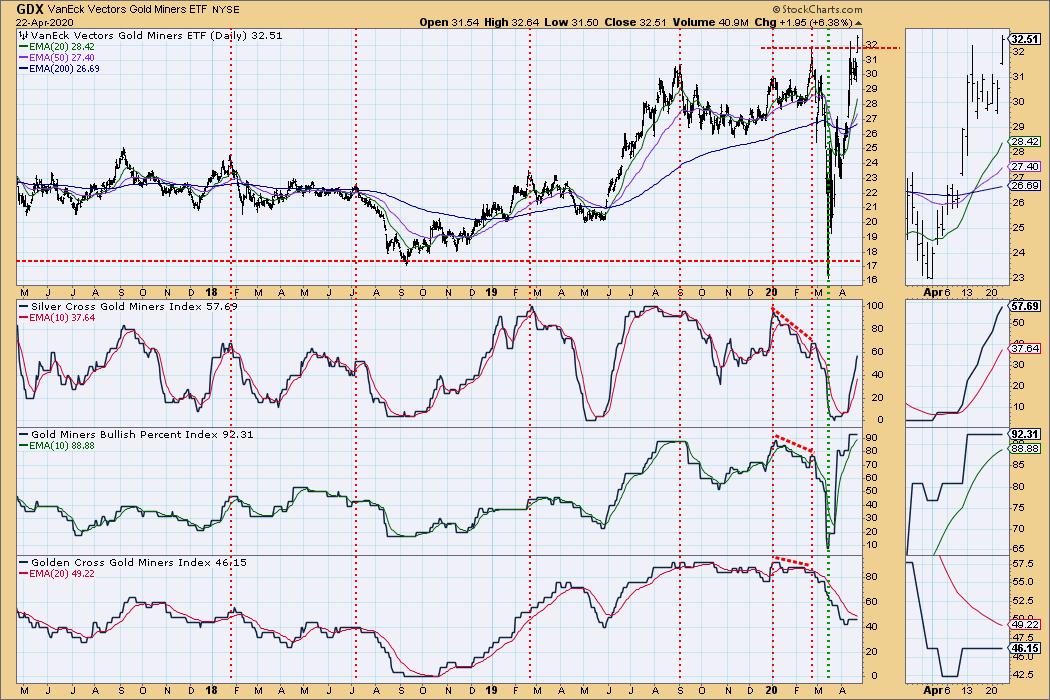
GOLD MINERS Golden and Silver Cross Indexes: Today we got the breakout on Miners. I was looking for this upside breakout, but didn't expect it to make this move. I like that price gapped out of the flag, it suggests to me that Miners will continue higher.
CRUDE OIL (USO)
IT Trend Model: Neutral as of 1/27/2020
LT Trend Model: SELL as of 2/3/2020
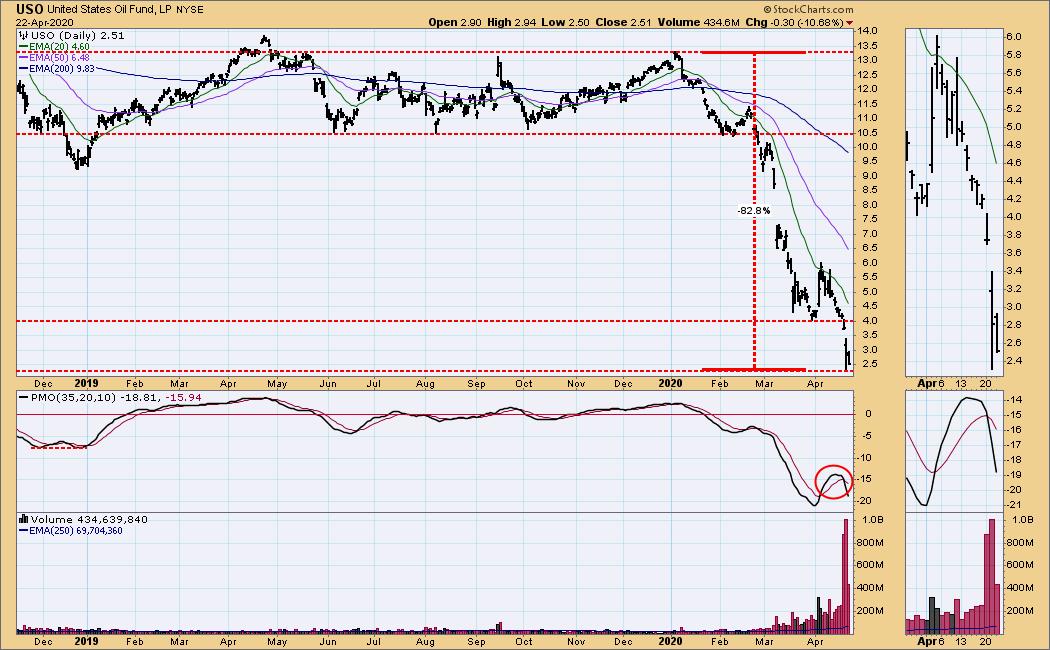
USO Daily Chart: USO took another huge hit today. I noted in the first chart of the article that the lows are unprecedented. Who would have believed that a barrel of Oil would decline all the way to $6.50! Apparently not even bargain hunters are willing to touch USO and I don't blame them. The good news is that when the supply problems work themselves out, this will be a great place to invest.
BONDS (TLT)
IT Trend Model: BUY as of 1/22/2020
LT Trend Model: BUY as of 1/2/2019
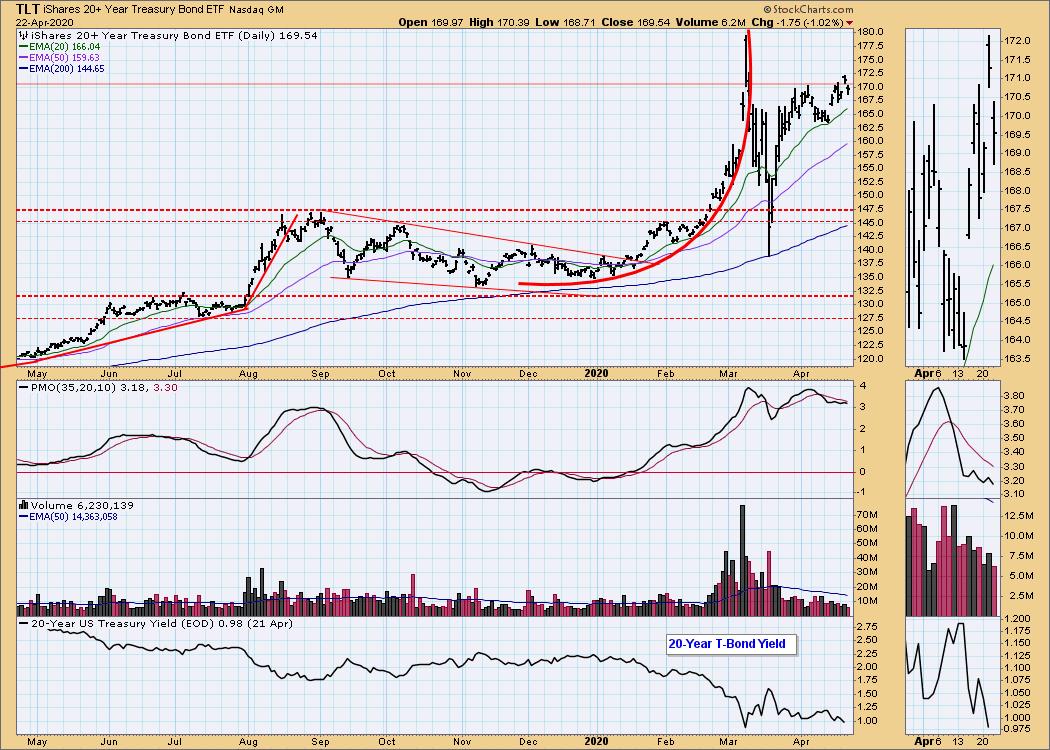
TLT Daily Chart: I may've given up on the double-top possibility too soon. We now have a second PMO top below the signal line in overbought territory. The technicals tell me to expect lower prices.
Have you subscribed the DecisionPoint Diamonds yet? DP does the work for you by providing handpicked stocks/ETFs from exclusive DP scans! Add it with a discount! Contact support@decisionpoint.com for more information!
Technical Analysis is a windsock, not a crystal ball.
Happy Charting! - Erin
Email: erin@decisionpoint.com

Erin Swenlin will be presenting at the The MoneyShow Las Vegas August 16 - 20 at Bally's/Paris Resort! You'll have an opportunity to meet Erin and discuss the latest DecisionPoint news and Diamond Scans. Claim your FREE pass here! You can watch online with this pass too!! There will be online events held in May and when I have more information I'll let you know.
NOTE: The signal status reported herein is based upon mechanical trading model signals, specifically, the DecisionPoint Trend Model. They define the implied bias of the price index based upon moving average relationships, but they do not necessarily call for a specific action. They are information flags that should prompt chart review. Further, they do not call for continuous buying or selling during the life of the signal. For example, a BUY signal will probably (but not necessarily) return the best results if action is taken soon after the signal is generated. Additional opportunities for buying may be found as price zigzags higher, but the trader must look for optimum entry points. Conversely, exit points to preserve gains (or minimize losses) may be evident before the model mechanically closes the signal.
Helpful DecisionPoint Links (Can Be Found on DecisionPoint.com Links Page):
DecisionPoint Shared ChartList and DecisionPoint Chart Gallery
Price Momentum Oscillator (PMO)
Swenlin Trading Oscillators (STO-B and STO-V)