
So much for the 'buying initiation' yesterday. On the open, it appeared we were going to get some upside follow-through on yesterday, but it couldn't get any positive momentum going. The Fed stepped in off schedule to lower rates by 50 basis points around 2p EST to staunch the bleeding. The market barely acknowledged it and in fact, it may have stoked more fear given the market was unable to sustain any sort of comeback.
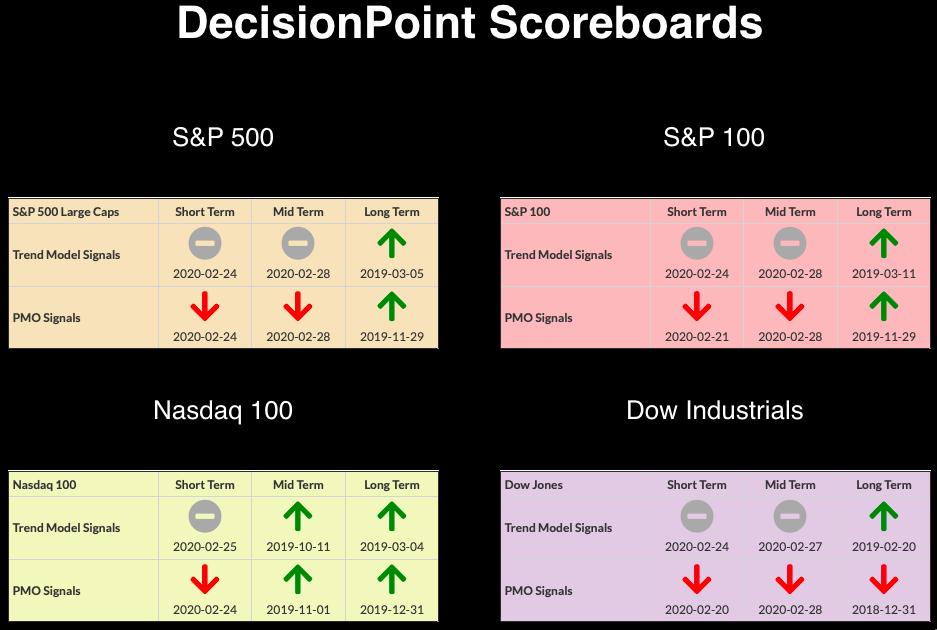
CURRENT BROAD MARKET DP Signals:
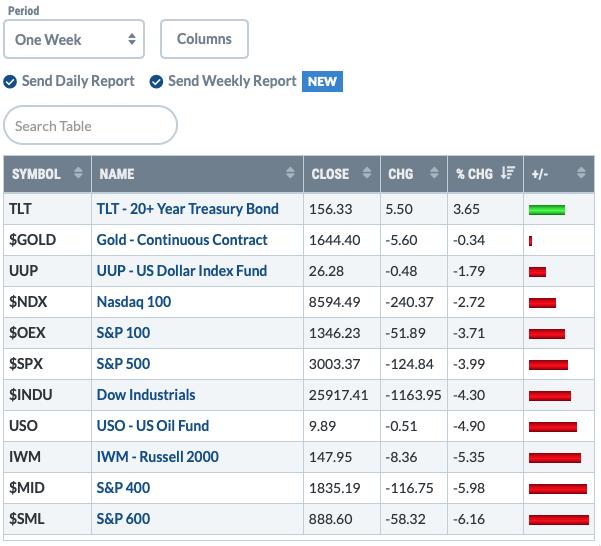
Past WEEK Results:
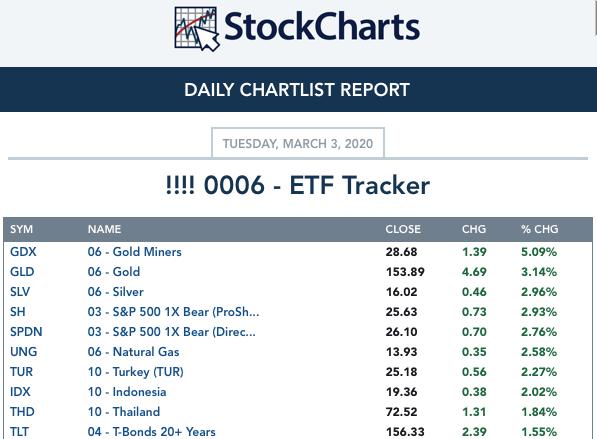
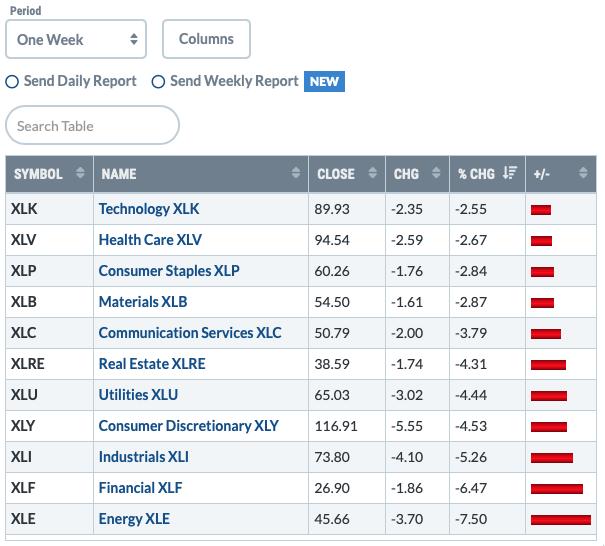
Top 10 from ETF Tracker:
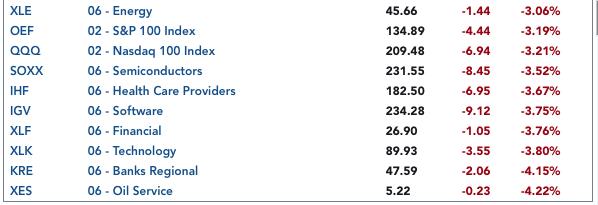
Bottom 10 from ETF Tracker:
On Friday, the DecisionPoint Alert Weekly Wrap presents an assessment of the trend and condition of the stock market (S&P 500), the U.S. Dollar, Gold, Crude Oil, and Bonds. Monday through Thursday the DecisionPoint Alert daily report is abbreviated and covers changes for the day.
Watch the latest episode of DecisionPoint on StockCharts TV's YouTube channel here!
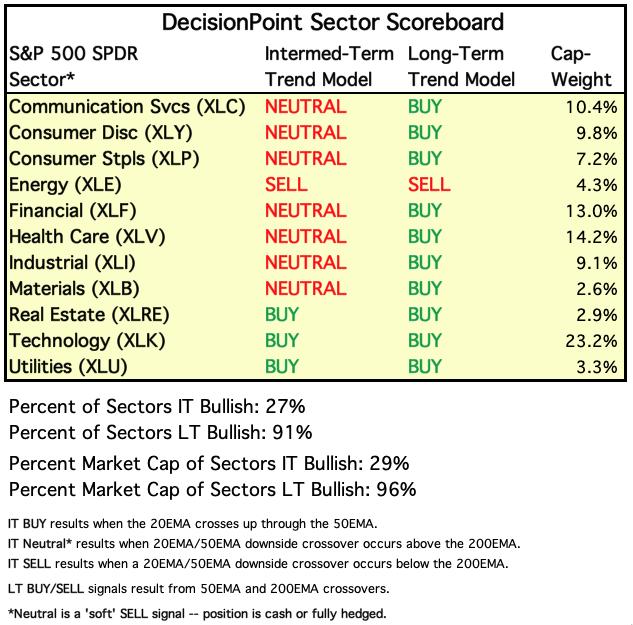
SECTORS
SIGNALS:
Each S&P 500 Index component stock is assigned to one, and only one, of 11 major sectors. This is a snapshot of the Intermediate-Term (Silver Cross) and Long-Term (Golden Cross) Trend Model signal status for those sectors.
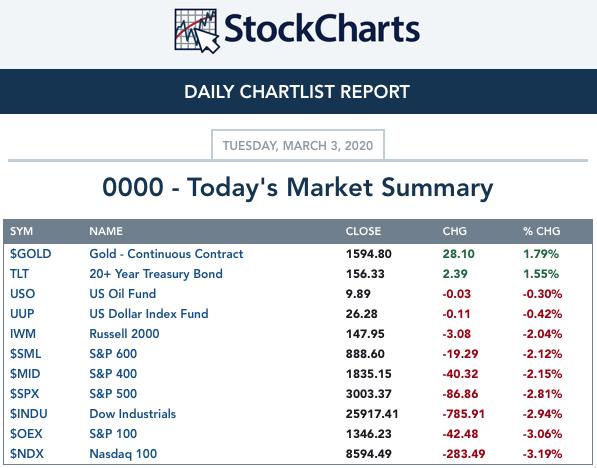
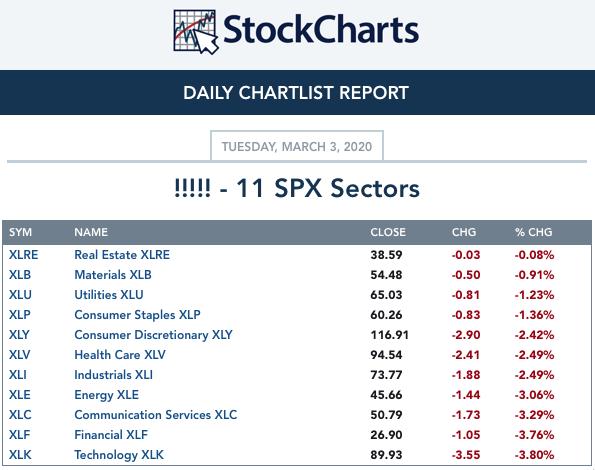
TODAY'S RESULTS:
One WEEK Results:
STOCKS
IT Trend Model: NEUTRAL as of 2/28/2020
LT Trend Model: BUY as of 2/26/2019
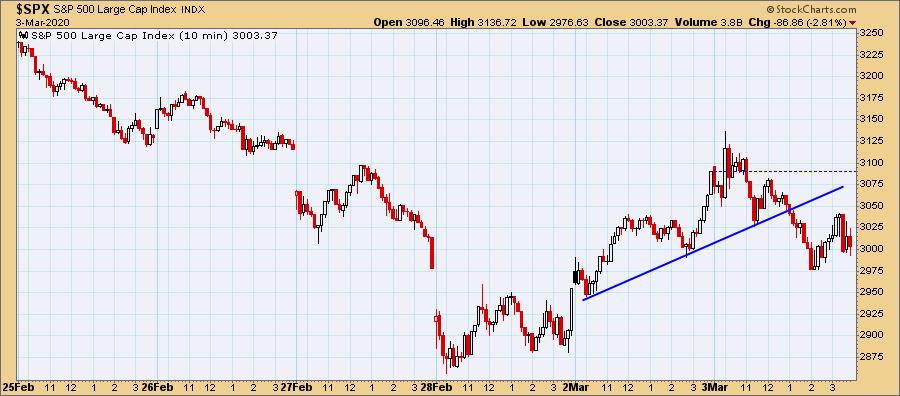
SPY Daily Chart: If you look at the sector "leaders" today, they are in the defensive areas. I suspect this will continue, especially if we are in the midst of a secular bear market. It shows you that even the areas that generally show strength in a bear market are being dragged into the mud with the rest. This is a show of intense weakness and is driven by emotion--fear. Today and yesterday's highs never really broke the steep declining trend on price. Total volume contracted on today's drop which could be considered a 'positive', but it's still way above its 250-EMA. That's still climactic.
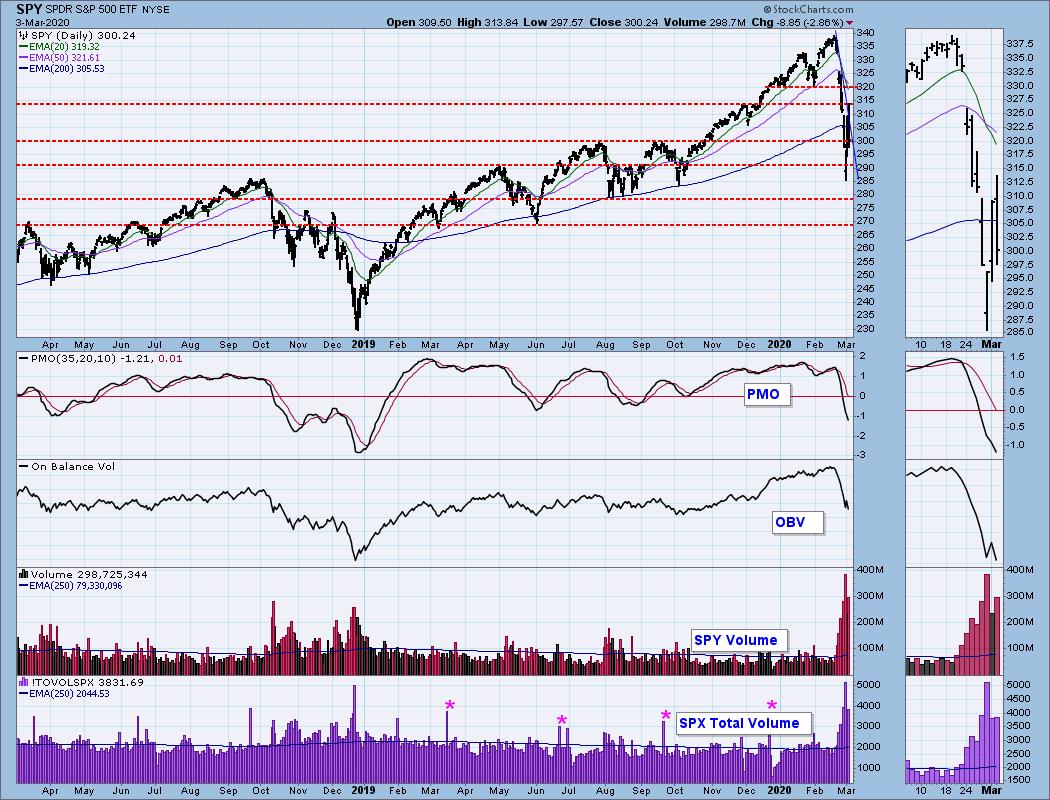
Climactic Market Indicators: The PMO is now oversold. Breadth readings were especially negative today on a hefty decline. We could be looking at a selling exhaustion, but with the VIX readings so high, I wouldn't count on it.
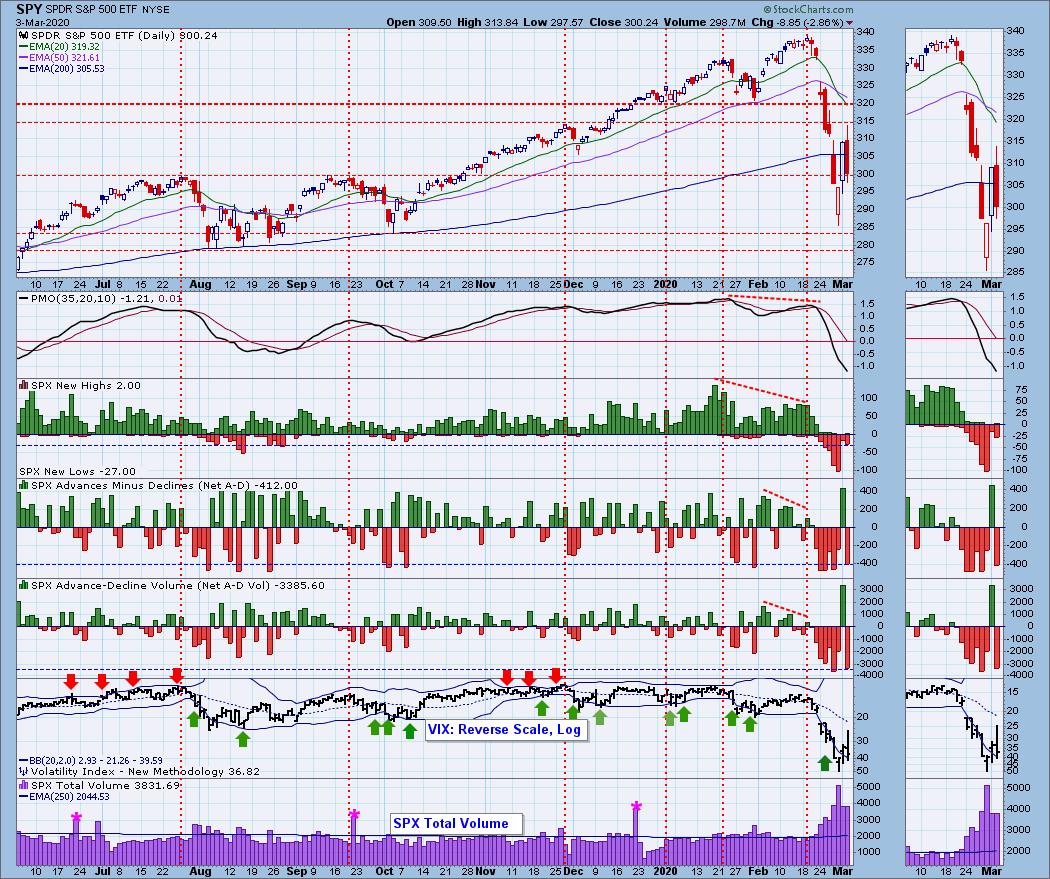
Short-Term Market Indicators: The ST trend is DOWN and the market condition is EXTREMELY OVERSOLD based upon the Swenlin Trading Oscillator (STO) readings. The STOs are certainly encouraging right now, but I don't see any support for a rally given that only 4% of SPX stocks are showing positive momentum and price above the 20-EMA.
Intermediate-Term Market Indicators: The Silver Cross Index (% of SPX stocks 20EMA > 50EMA) and the Golden Cross Index (percent of SPX stocks 50EMA > 200EMA) continue to dive even after yesterday's big rally. The SCI is now oversold, but darn it! The GCI is still about Neutral and certainly not oversold. More damage needs to be done unfortunately.
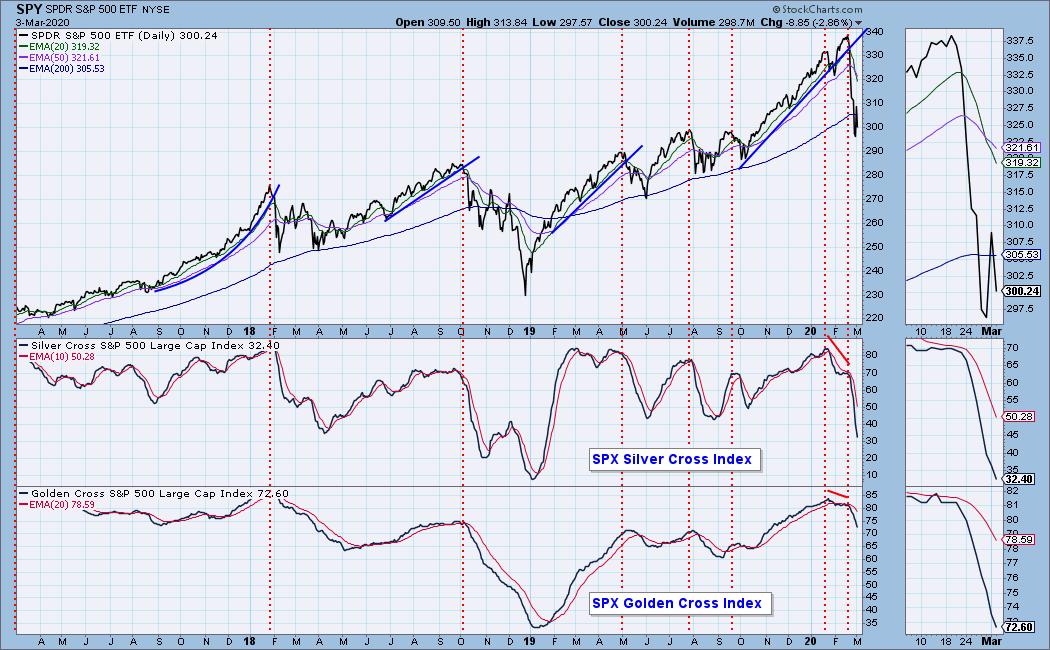
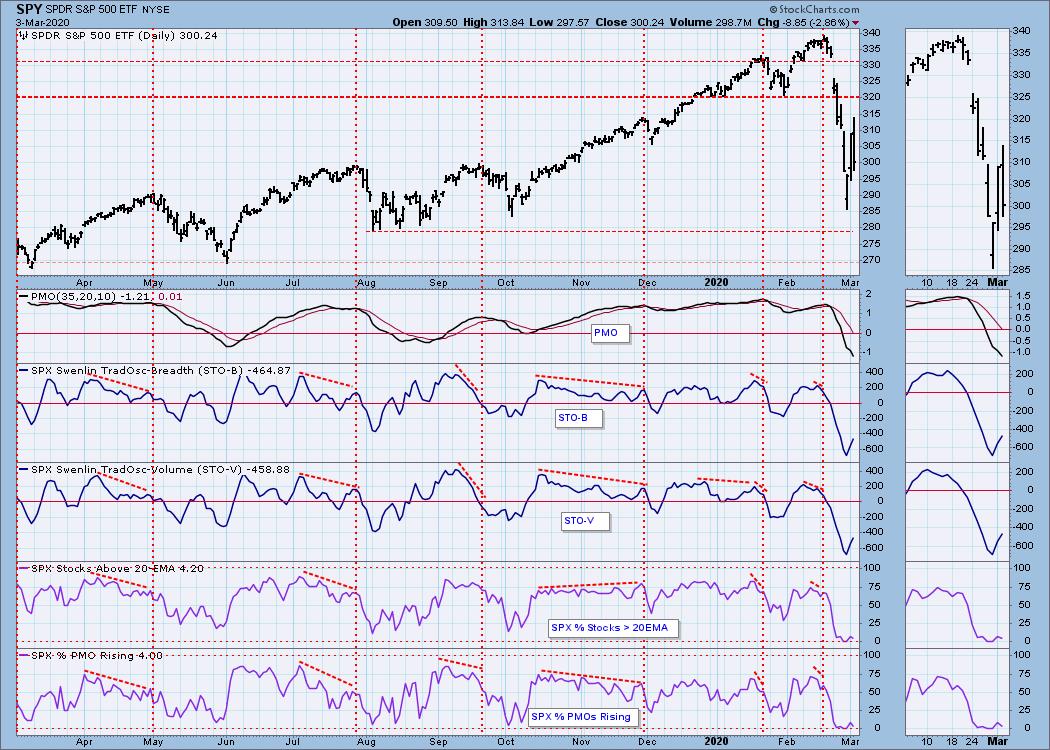
The IT trend is DOWN when measured by the green rising trendline and the market condition is EXTREMELY OVERSOLD based upon the ITBM and ITVM readings, OVERSOLD based on the PMO and the Silver Cross/Golden Cross Index readings. Oversold extremes are being reached on the ITBM and ITVM, but they have yet to change course in a meaningful way.
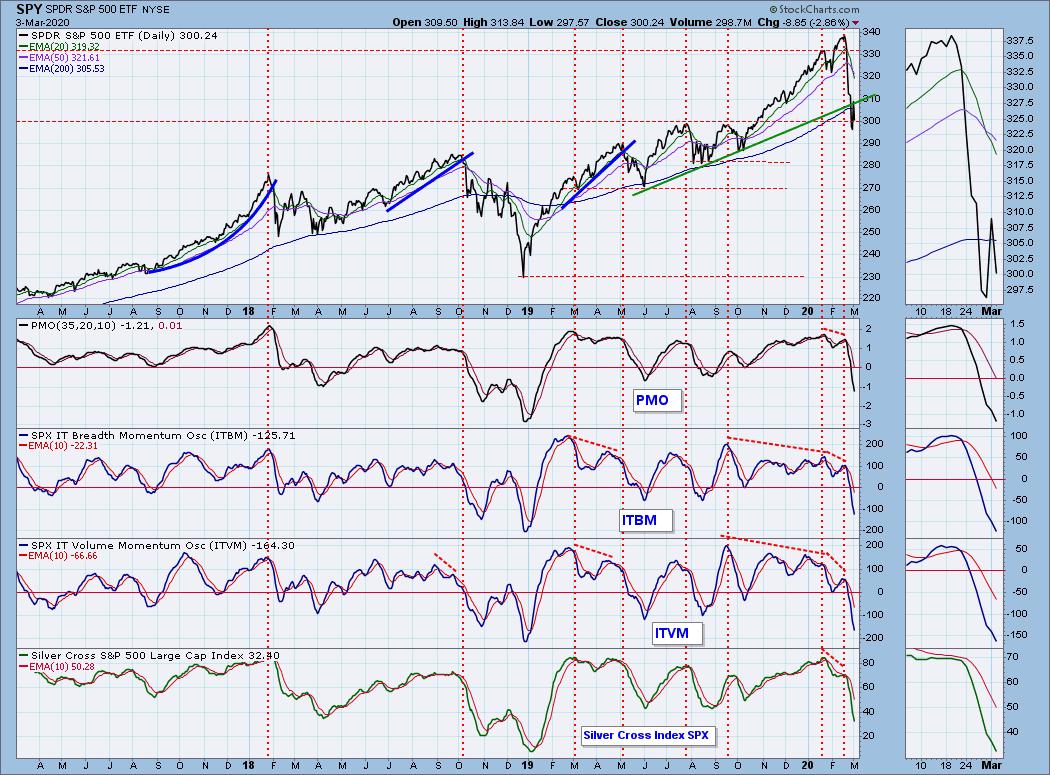
CONCLUSION: The ST and IT trends are DOWN. Market condition based on ST and IT indicators is VERY OVERSOLD. It is encouraging to see oversold indicators, but as the DP Faithful are likely tired of hearing, this is not a solid foundation! Look at what happened after yesterday's giddy mood and historic point gain. Strap in, preserve some profits (or prevent more losses) so you'll be ready when we finally do have a solid bottom on the horizon. I can't wait for the day I can be unabashedly bullish :)
(Not a Diamonds subscriber? Add it to your DP Alert subscription and get a discount! Contact support@decisionpoint.com for your limited time coupon code!)
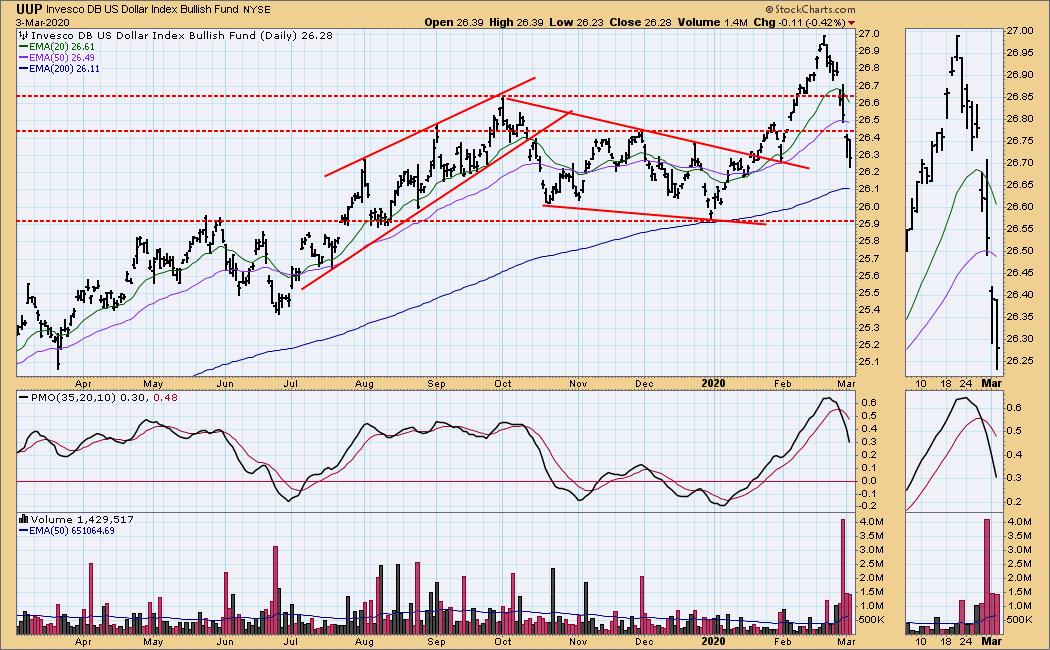
DOLLAR (UUP)
IT Trend Model: BUY as of 1/22/2020
LT Trend Model: BUY as of 5/25/2018
UUP Daily Chart: The PMO is highly bearish and price just broke below the low from the last day in January. The 200-EMA could provide some much needed support as it did in December of last year. Volume did pullback, but it is still in climactic territory.
GOLD
IT Trend Model: BUY as of 12/26/2019
LT Trend Model: BUY as of 1/8/2019
GOLD Daily Chart: Gold caught up today. A depressed Dollar helped but according to Kitco.com, it was mainly due to a preponderance of buyers and not the Dollar that made the difference today.
The PMO has quickly reversed direction and the discounts on PHYS are reaching highs we have seen in some time. This is typically bullish for Gold. I would look for higher prices. This is probably the one area besides Bonds where we see more upside potential.
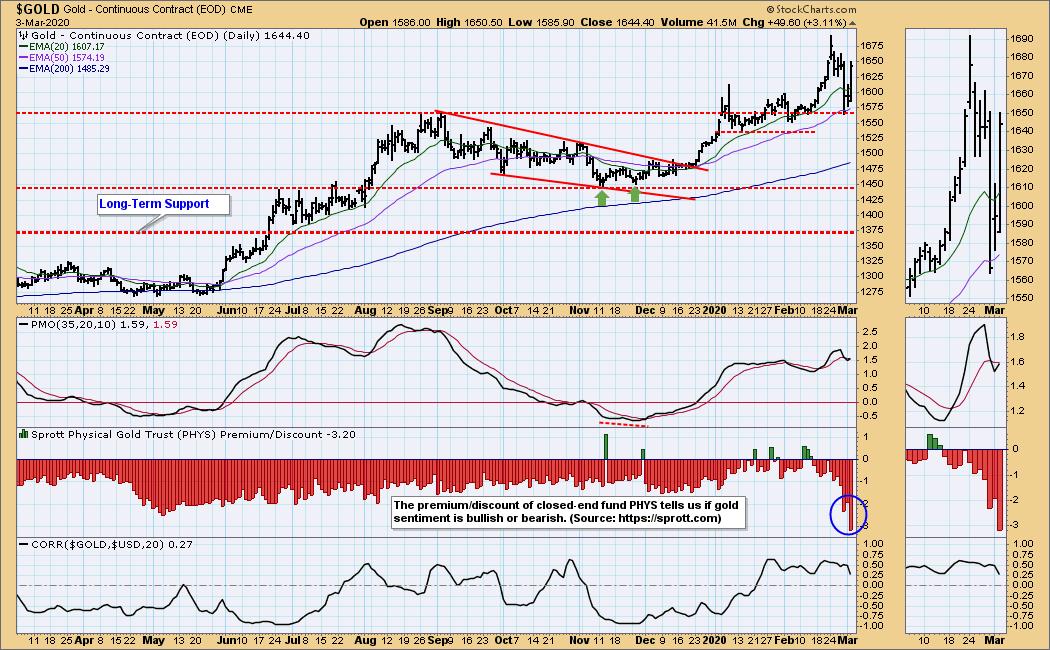
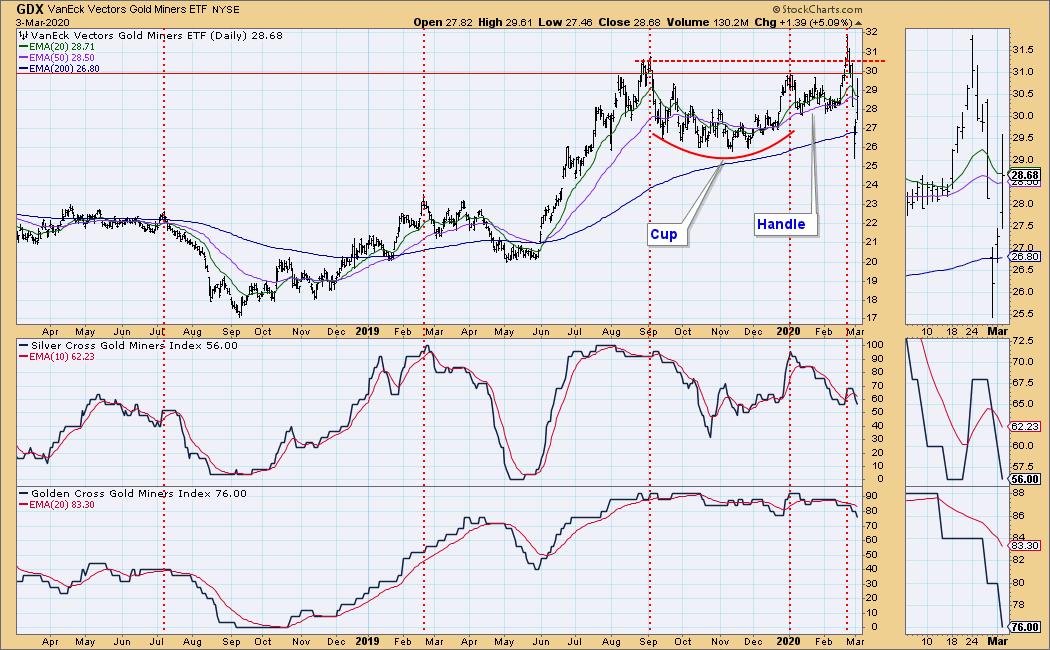
GOLD MINERS Golden and Silver Cross Indexes: Gold Miners were one of the big winners on the day. Problem: The SCI and GCI both declined. Rallies should be supported by these numbers at least staying the same. Today is a negative divergence we should keep an eye on. Miners are more susceptible to market machinations. Gold doing well will help, but the overall market's volatility could make this a rocky ride.
CRUDE OIL (USO)
IT Trend Model: Neutral as of 1/27/2020
LT Trend Model: BUY as of 12/16/2019
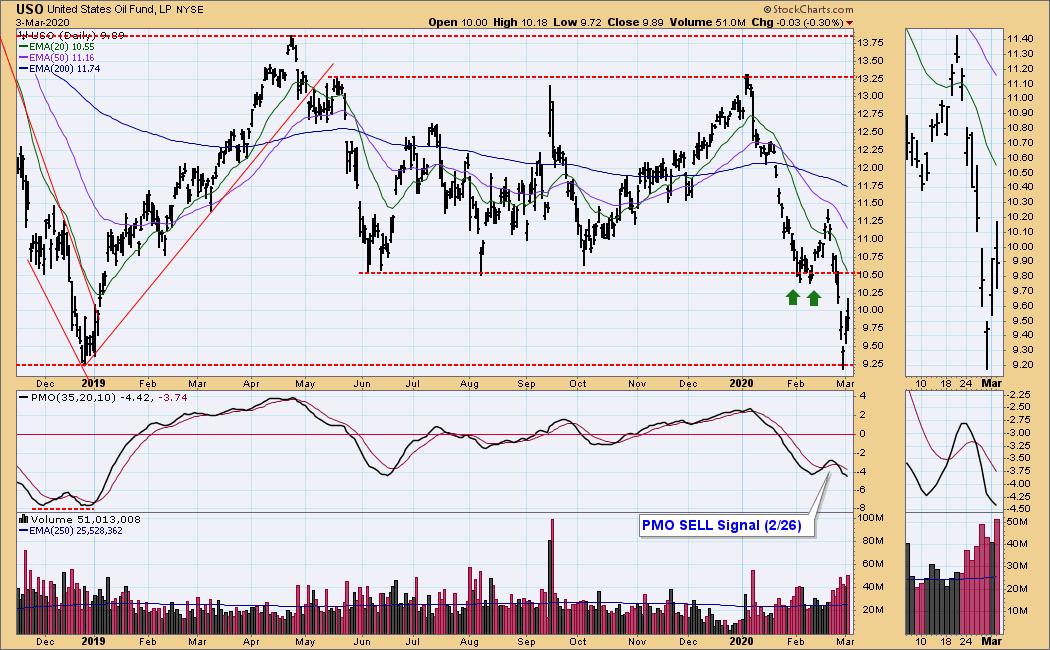
USO Daily Chart: The PMO is still declining. I do think this test of support is constructive. These oversold conditions could see higher prices for Oil, but in a bear market (as Oil is in, 50-EMA<200-EMA), we have to expect bearish conclusions. Overhead resistance at $10.50 could upset the current attempt at a rally.
BONDS (TLT)
IT Trend Model: BUY as of 1/22/2020
LT Trend Model: BUY as of 1/2/2019
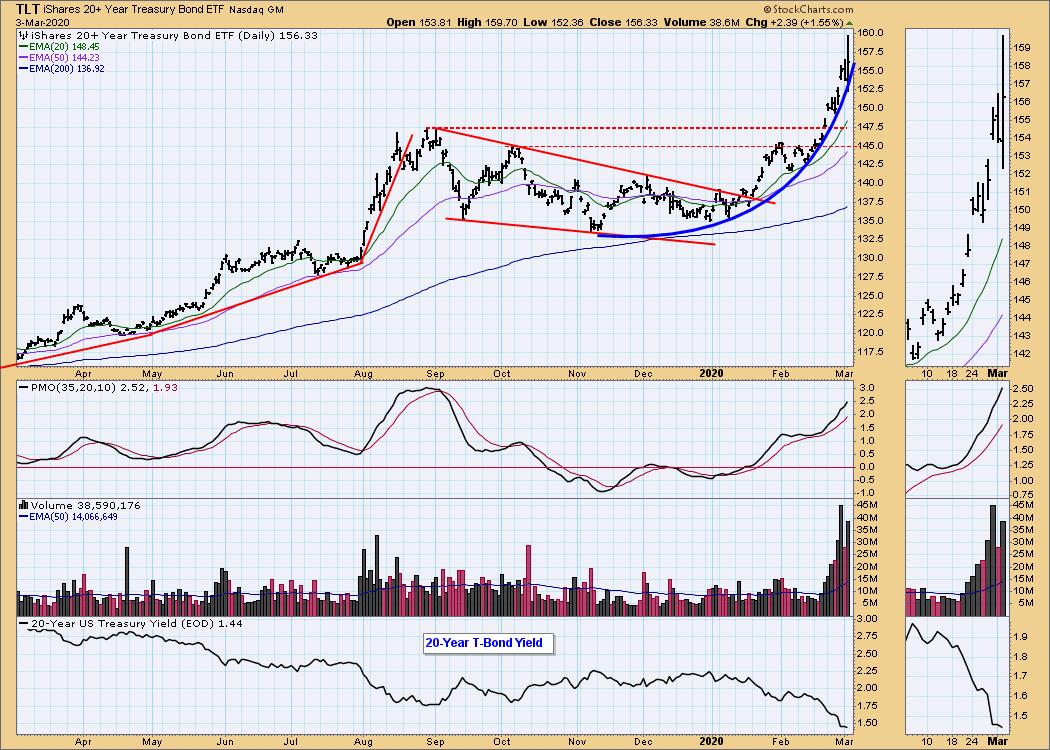
TLT Daily Chart: Bonds have become a hideout and investors are willing to take lower yields for that safety. However, keep an eye on this one. We have a parabolic move that is unsustainable and with the current accumulation and overbought PMO, I would be thinking about what the big money managers will do at the first sign of reduced fear and that likely will be a flight from Bonds. At this point, it seems no one can get enough.
Have you subscribed the DecisionPoint Diamonds yet? DP does the work for you by providing handpicked stocks/ETFs from exclusive DP scans! Add it with a discount! Contact support@decisionpoint.com for more information!
Technical Analysis is a windsock, not a crystal ball.
Happy Charting! - Erin
Email: erin@decisionpoint.com

Erin Swenlin will be presenting at the The MoneyShow Las Vegas May 11-13, 2020! You'll have an opportunity to meet Erin and discuss the latest DecisionPoint news and Diamond Scans. Claim your FREE pass here! You can watch online with this pass too!!
NOTE: The signal status reported herein is based upon mechanical trading model signals, specifically, the DecisionPoint Trend Model. They define the implied bias of the price index based upon moving average relationships, but they do not necessarily call for a specific action. They are information flags that should prompt chart review. Further, they do not call for continuous buying or selling during the life of the signal. For example, a BUY signal will probably (but not necessarily) return the best results if action is taken soon after the signal is generated. Additional opportunities for buying may be found as price zigzags higher, but the trader must look for optimum entry points. Conversely, exit points to preserve gains (or minimize losses) may be evident before the model mechanically closes the signal.
Helpful DecisionPoint Links (Can Be Found on DecisionPoint.com Links Page):
DecisionPoint Shared ChartList and DecisionPoint Chart Gallery
Price Momentum Oscillator (PMO)
Swenlin Trading Oscillators (STO-B and STO-V)