
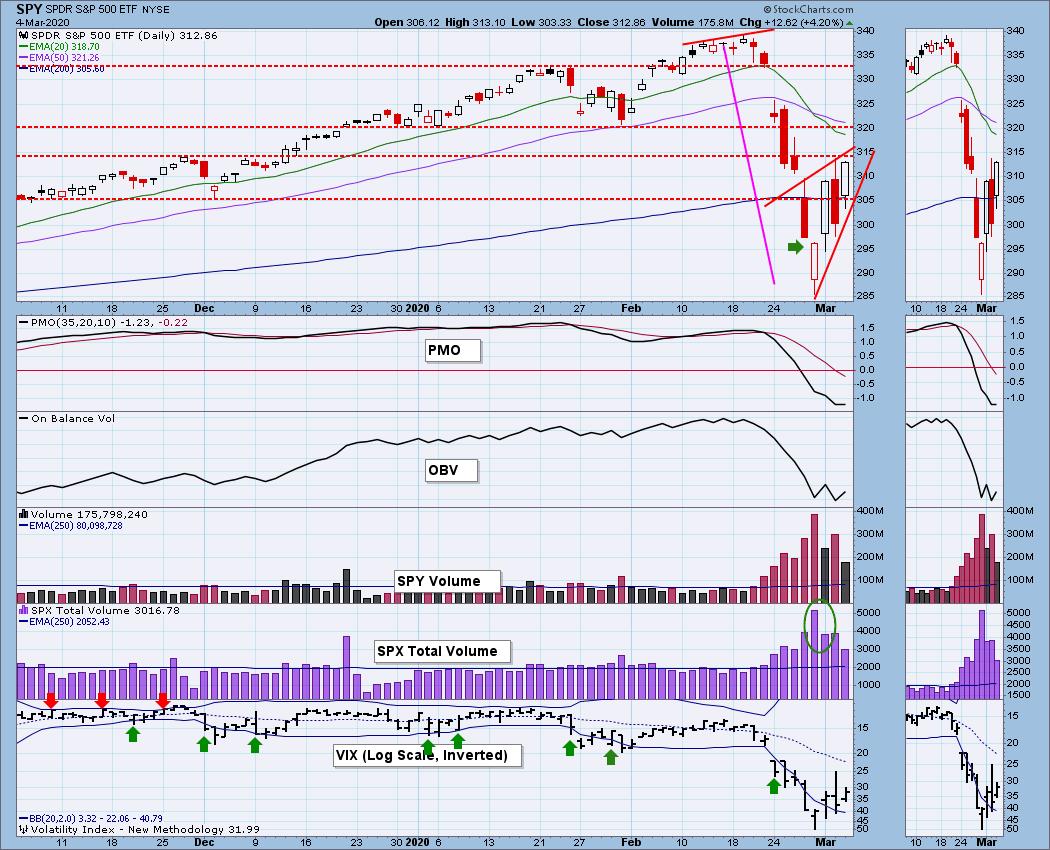
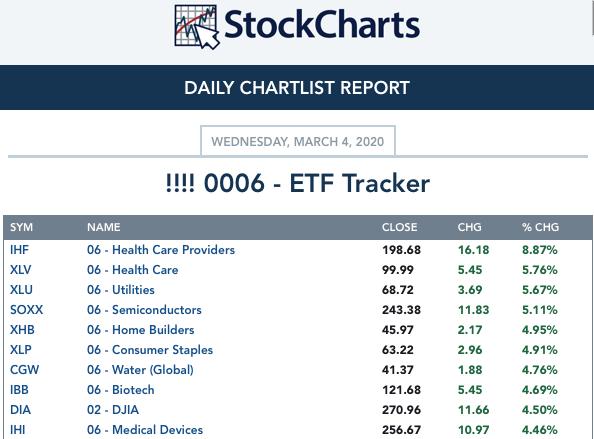
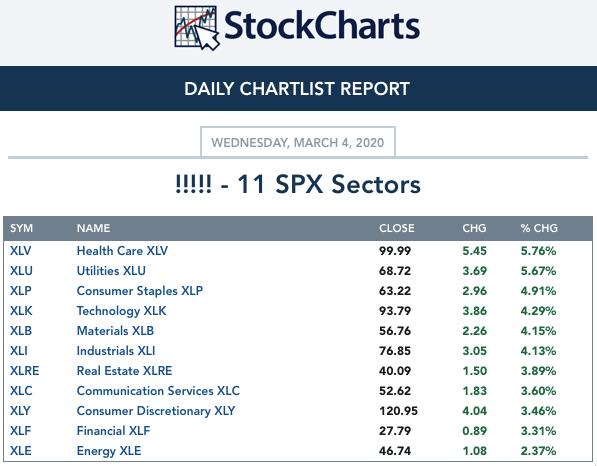
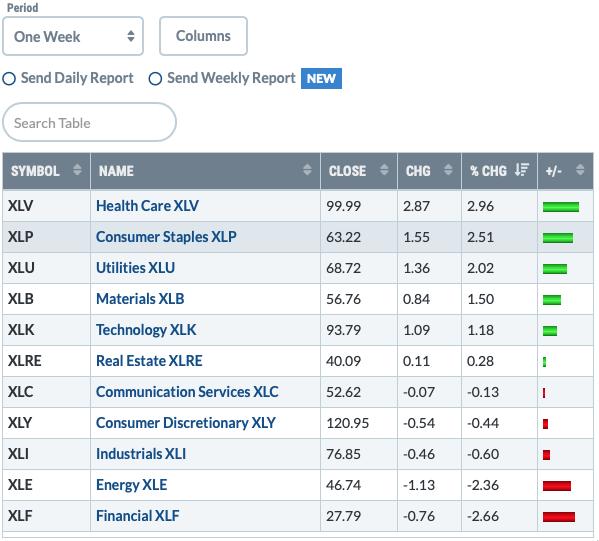
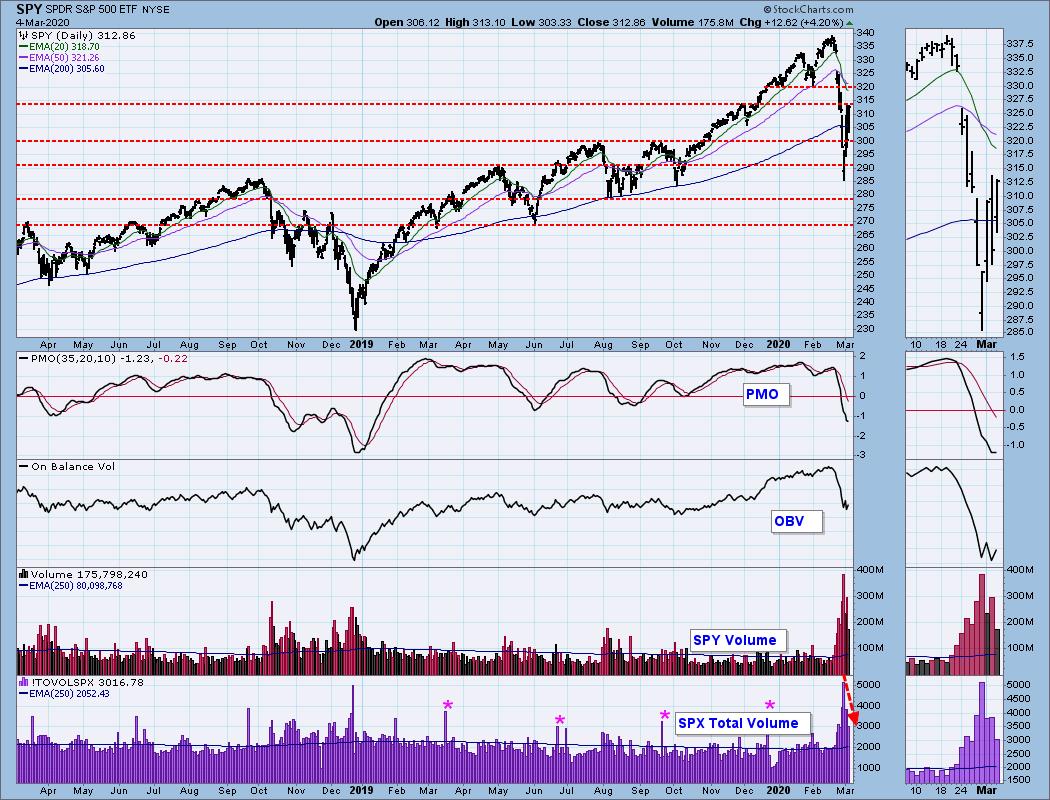
When I woke this morning and opened up my charts, I thought, "This is one crazy market!" While we have established a very short-term rising trend, we have also formed a bearish rising wedge and a possible bearish reverse flag formation. I also have heartburn over the fact that on both big rally days, volume fell. It is still well above its 250-EMA, but all I sense is a selling frenzy followed by reactionary rallies. On a day where we gained 4.2% on the SPY, I would expect to see higher volume rather than less volume. Notice that the OBV bottoms are in decline. If we see a decline tomorrow of any kind, the OBV will set a top that is lower than the previous. I want more upside volume. Also note that the three leading sectors today were the defensive Healthcare, Consumer Staples and Utilities. Rallies out of corrections that come on the back of defensive areas suggest thin ice.
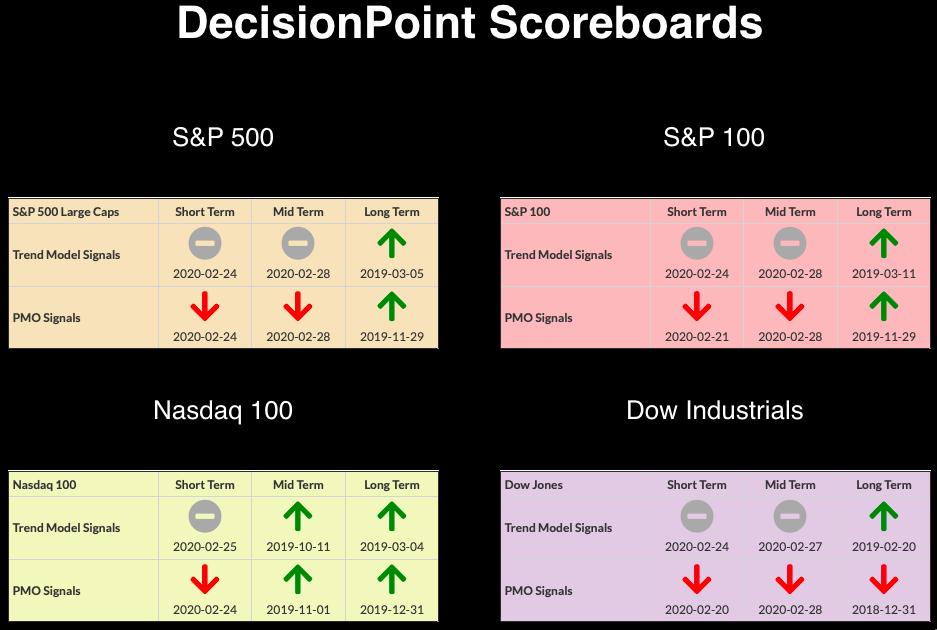
CURRENT BROAD MARKET DP Signals:
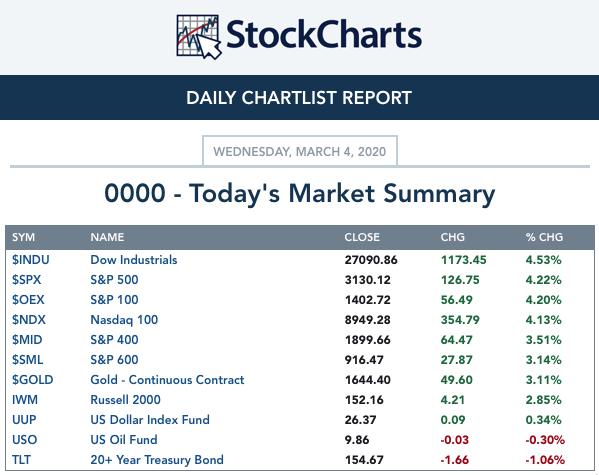
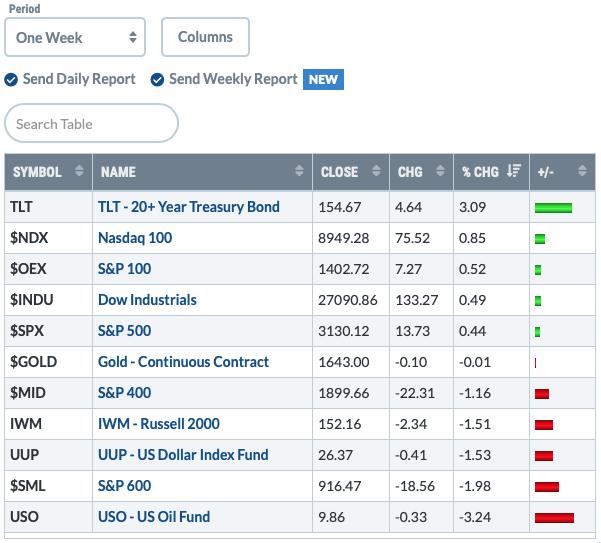
Past WEEK Results:
Top 10 from ETF Tracker:
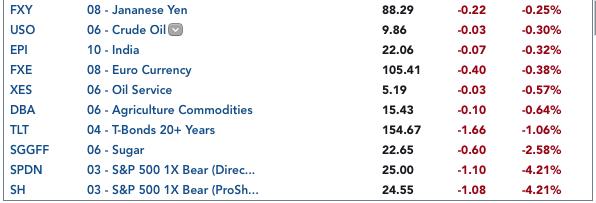
Bottom 10 from ETF Tracker:
On Friday, the DecisionPoint Alert Weekly Wrap presents an assessment of the trend and condition of the stock market (S&P 500), the U.S. Dollar, Gold, Crude Oil, and Bonds. Monday through Thursday the DecisionPoint Alert daily report is abbreviated and covers changes for the day.
Watch the latest episode of DecisionPoint on StockCharts TV's YouTube channel here!
SECTORS
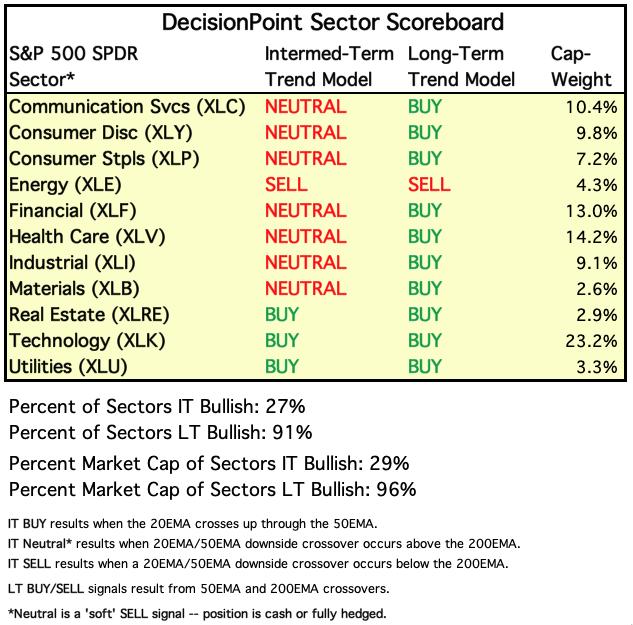
SIGNALS:
Each S&P 500 Index component stock is assigned to one, and only one, of 11 major sectors. This is a snapshot of the Intermediate-Term (Silver Cross) and Long-Term (Golden Cross) Trend Model signal status for those sectors.
TODAY'S RESULTS:
One WEEK Results:
STOCKS
IT Trend Model: NEUTRAL as of 2/28/2020
LT Trend Model: BUY as of 2/26/2019
SPY Daily Chart: This is a deep correction and I'm not convinced that it is over. I pointed out total volume in my opening. Looking at corrections in the past, I suspect we will see something like the end of 2018. We had two deep corrections and on the one in November, many thought it was over. Then December hit. Let's see increasing volume and an OBV with rising bottoms.
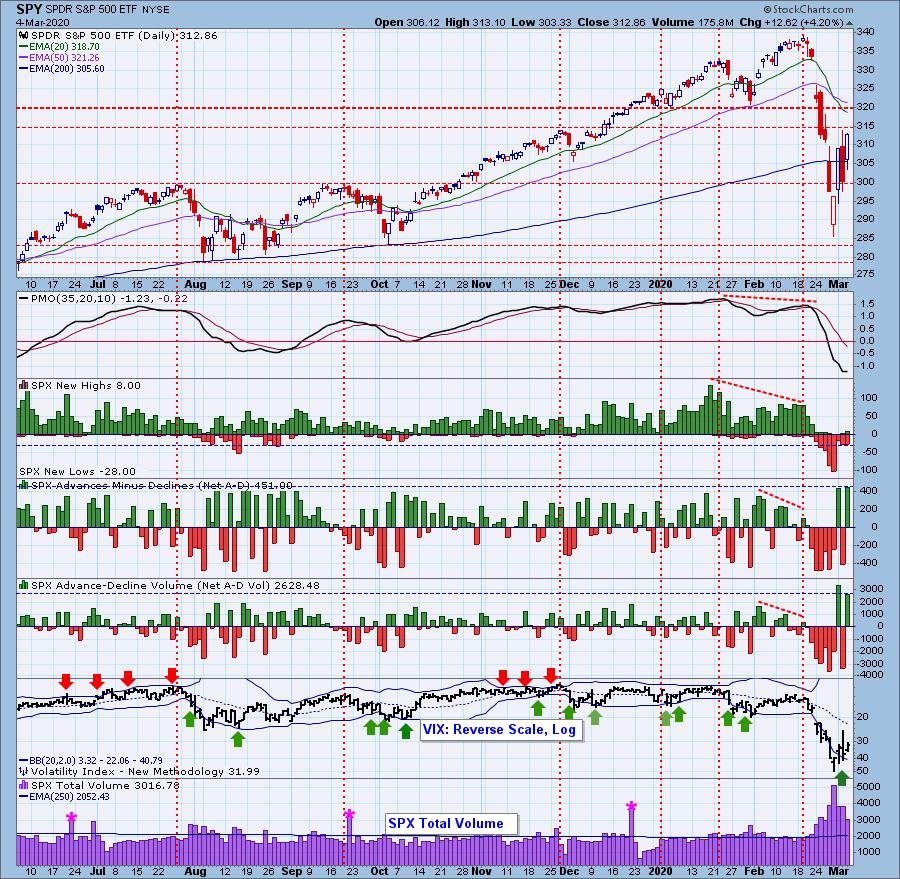
Climactic Market Indicators: More climactic readings. With one day up and one day down, it is not easy to decipher whether we are looking at an exhaustion or initiation. With the VIX reading above 30, we could see more of the same. Although breadth was positive, I do note that Net A-D Volume came in lower. Again, volume is my sticking point.
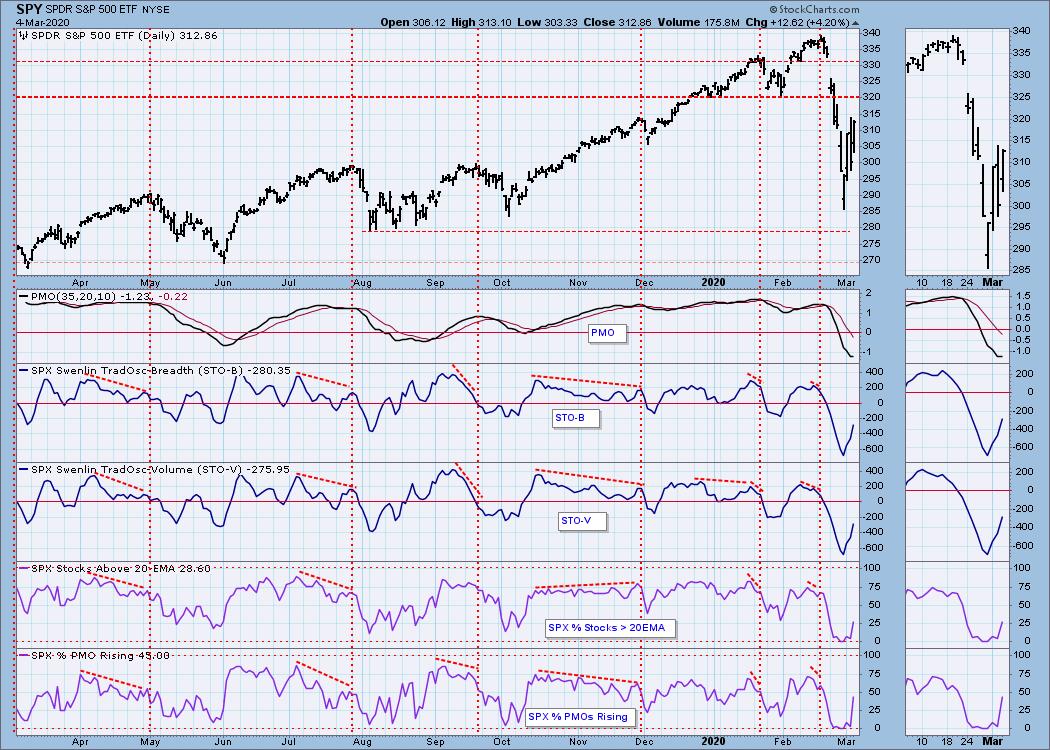
Short-Term Market Indicators: The ST trend is UP and the market condition is SOMEWHAT OVERSOLD based upon the Swenlin Trading Oscillator (STO) readings. The only reason I state that the trend is up is because we are seeing a rising bottoms trendline. I don't think it is good news that the STOs are almost in Neutral. If they continue to move quickly higher, they will be overbought in no time. We are seeing more participation based on %PMOs Rising and %Stocks Above 20-EMA which is encouraging as they come out of deeply oversold territory.
Intermediate-Term Market Indicators: The Silver Cross Index (% of SPX stocks 20EMA > 50EMA) and the Golden Cross Index (percent of SPX stocks 50EMA > 200EMA) continue to move lower even while we are seeing a short-term rising trend develop. The GCI is not nearly oversold enough.
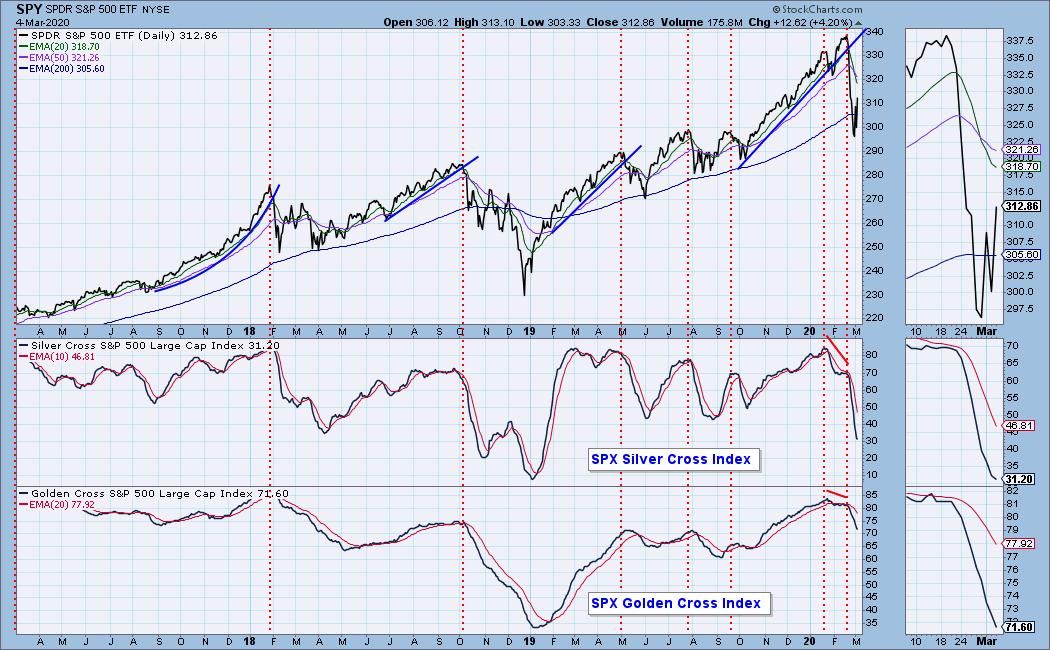
The IT trend is back UP when measured by the green rising trendline and the market condition is EXTREMELY OVERSOLD based upon the ITBM and ITVM readings, OVERSOLD based on the PMO and the Silver Cross/Golden Cross Index readings. We are beginning to see deceleration on these indicators, but I generally don't consider us being 'out of the woods' until I see an upside crossover on those indicators.
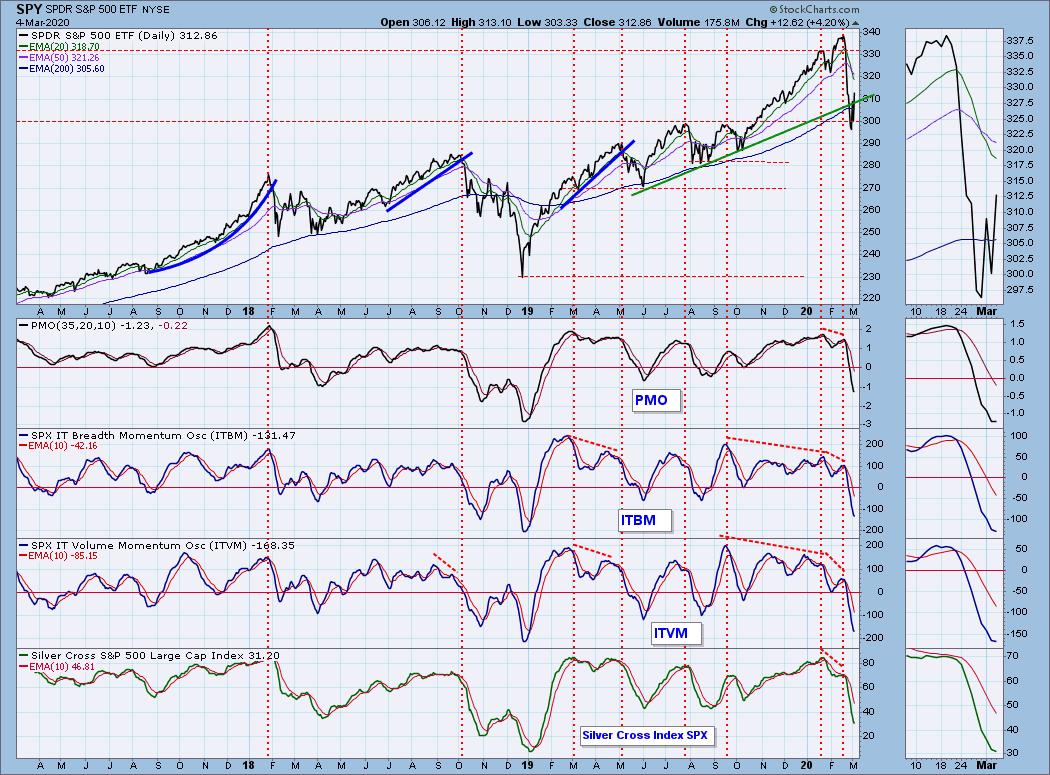
CONCLUSION: The ST and IT trends are back UP. Market condition based on ST and IT indicators is OVERSOLD. The coronavirus isn't yet contained and could still cause terrible damage. I doubt the market has hit its low for the year. With volatility so crazy, this isn't the best time to try and bottom pick. While the trend is technically back up, the short-term trend is very steep and highly unsustainable. Pair that with the bearish rising wedge or reverse flag, we should expect lower prices.
(Not a Diamonds subscriber? Add it to your DP Alert subscription and get a discount! Contact support@decisionpoint.com for your limited time coupon code!)
DOLLAR (UUP)
IT Trend Model: BUY as of 1/22/2020
LT Trend Model: BUY as of 5/25/2018
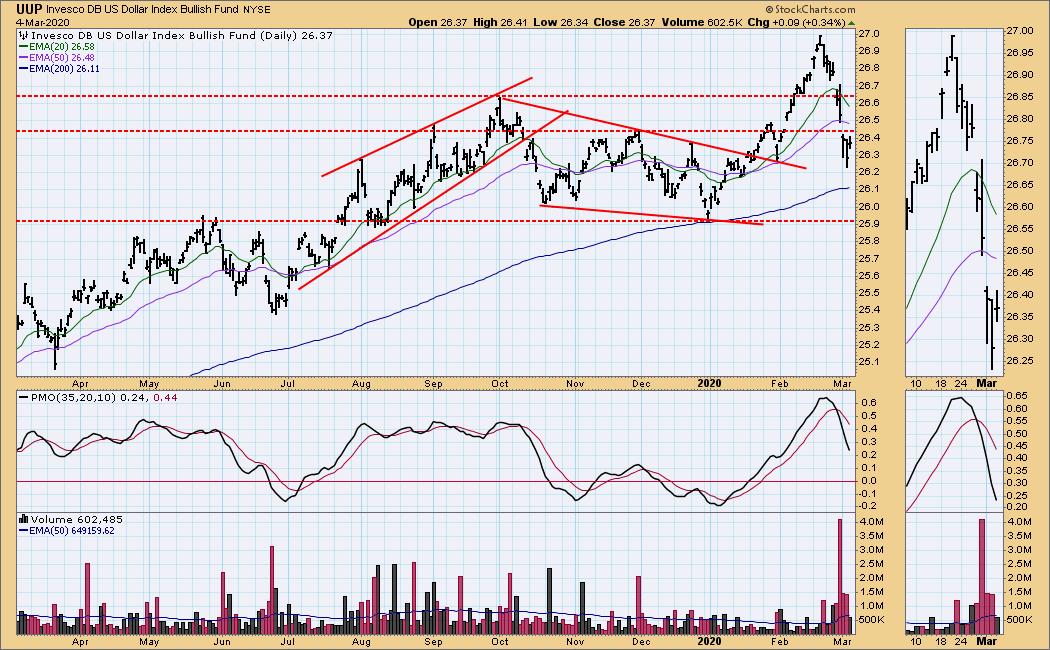
UUP Daily Chart: The Dollar had a good day, but the PMO is so negative, I'm still expecting another down leg to test the 200-EMA at a minimum.
GOLD
IT Trend Model: BUY as of 12/26/2019
LT Trend Model: BUY as of 1/8/2019
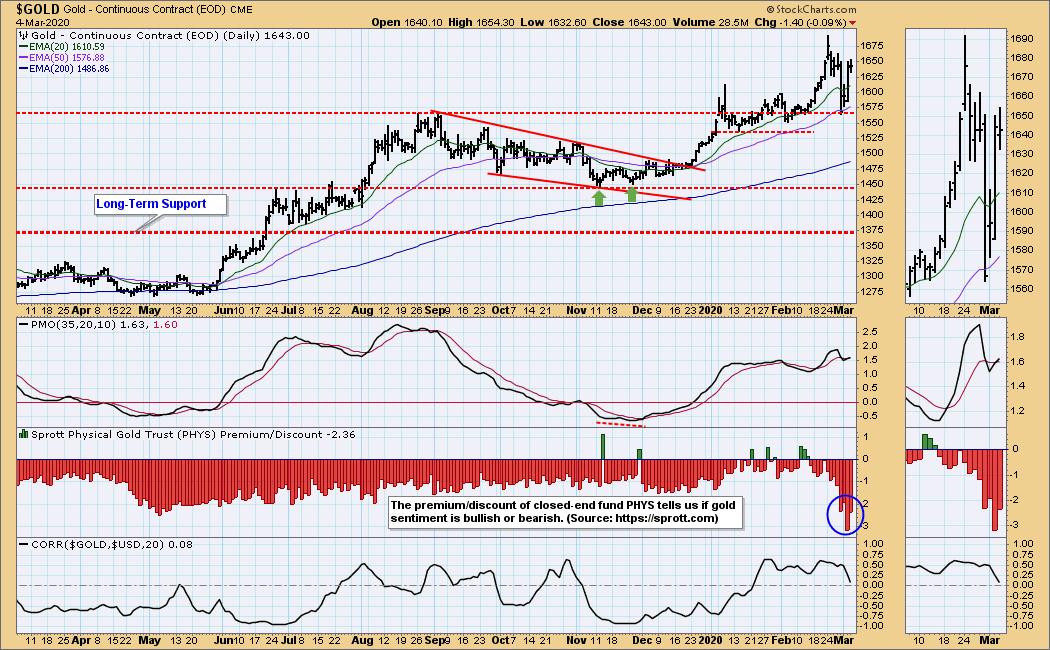
GOLD Daily Chart: Gold was down slightly, but given the 0.34% rise in the Dollar, I think it escaped a deeper decline. The new PMO BUY signal does suggest higher prices to come. Discounts remain very high and that is bullish for Gold.
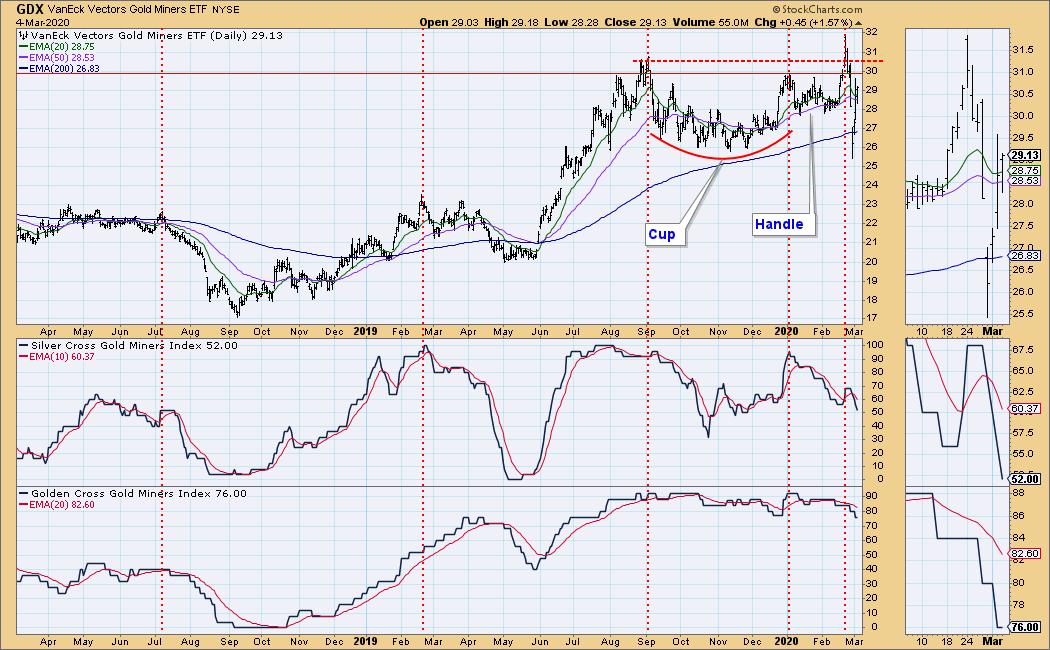
GOLD MINERS Golden and Silver Cross Indexes: Gold Miners was a winner today. Problem: The SCI and GCI both continued to decline. I mentioned yesterday that Miners are more susceptible to market moves. Gold was down but note that Miners had a great day. I believe a good portion of that move can be chalked up to winners across the market today. I still don't like the negative divergence of prices moving up over 1.5% and yet seeing fewer stocks with their 20-EMAs > 50-EMAs (Silver Cross Index).
CRUDE OIL (USO)
IT Trend Model: Neutral as of 1/27/2020
LT Trend Model: BUY as of 12/16/2019
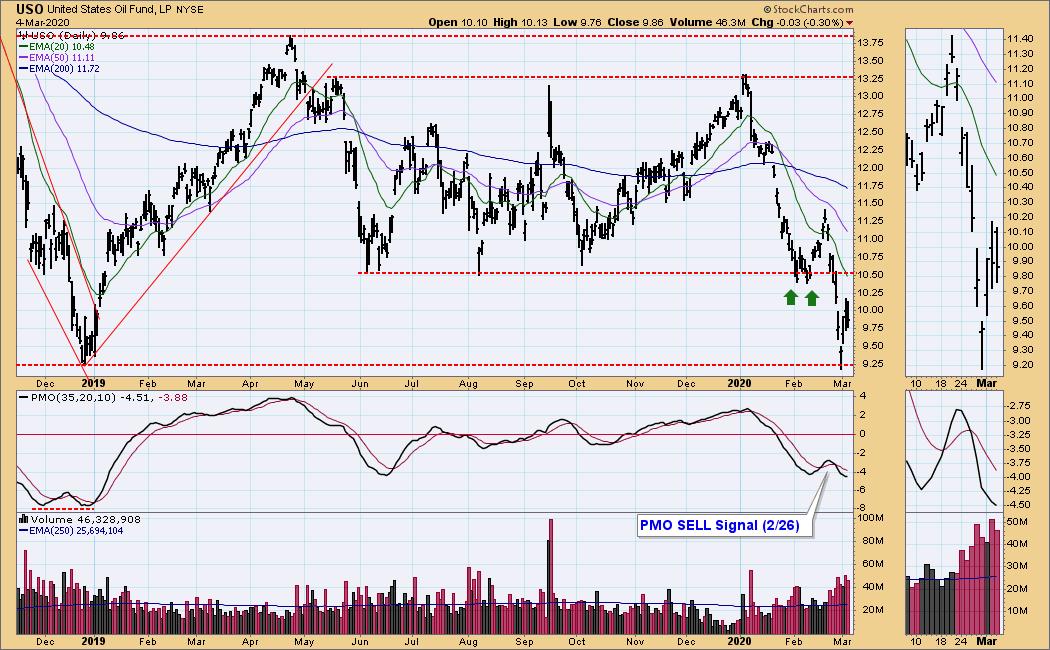
USO Daily Chart: PMO is still declining and USO was down today. The bounce off support looks a lot like the broad market's bounce. The amount of distribution on USO is characterized by the many red volume bars and their rising trend. I believe this is a dead cat bounce that will not be able to overcome resistance at $10.50.
BONDS (TLT)
IT Trend Model: BUY as of 1/22/2020
LT Trend Model: BUY as of 1/2/2019
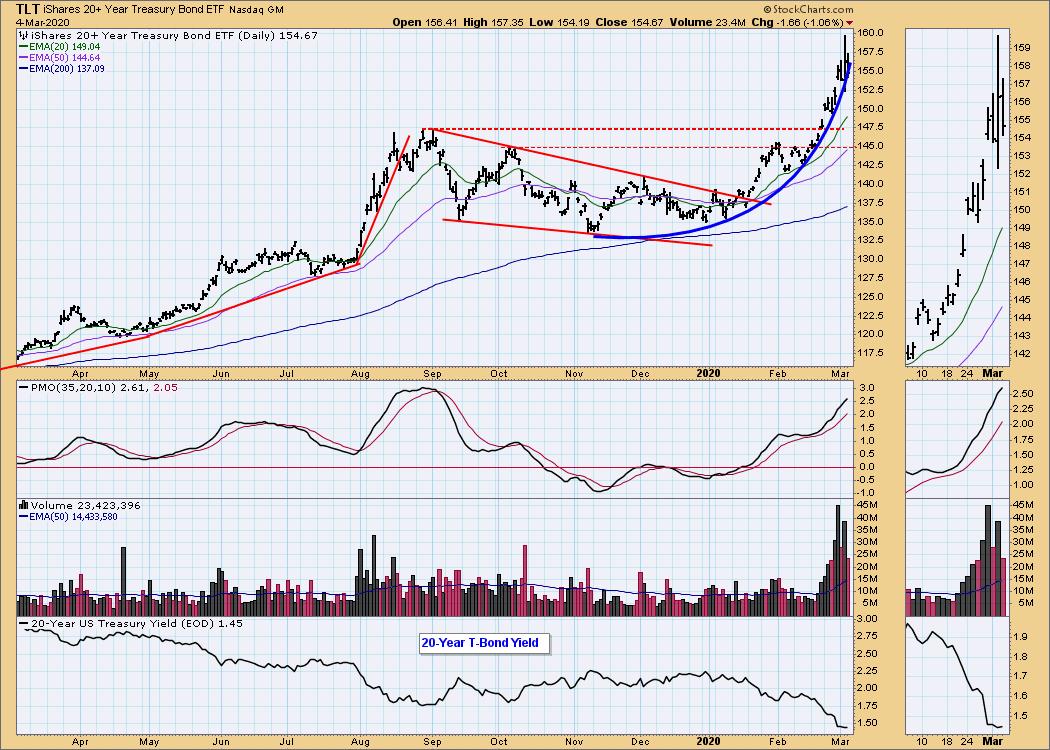
TLT Daily Chart: We are still looking at a parabolic move on Bonds. It has been the chosen area of safety by investors. Today we finally saw TLT pull back. The PMO is overbought and the parabola is still in play. If we get to a point where the flight to safety is overcome by diminishing of volatility, that parabola will likely break down quickly and painfully.
Have you subscribed the DecisionPoint Diamonds yet? DP does the work for you by providing handpicked stocks/ETFs from exclusive DP scans! Add it with a discount! Contact support@decisionpoint.com for more information!
Technical Analysis is a windsock, not a crystal ball.
Happy Charting! - Erin
Email: erin@decisionpoint.com
Erin Swenlin will be presenting at the The MoneyShow Las Vegas May 11-13, 2020! You'll have an opportunity to meet Erin and discuss the latest DecisionPoint news and Diamond Scans. Claim your FREE pass here! You can watch online with this pass too!!
NOTE: The signal status reported herein is based upon mechanical trading model signals, specifically, the DecisionPoint Trend Model. They define the implied bias of the price index based upon moving average relationships, but they do not necessarily call for a specific action. They are information flags that should prompt chart review. Further, they do not call for continuous buying or selling during the life of the signal. For example, a BUY signal will probably (but not necessarily) return the best results if action is taken soon after the signal is generated. Additional opportunities for buying may be found as price zigzags higher, but the trader must look for optimum entry points. Conversely, exit points to preserve gains (or minimize losses) may be evident before the model mechanically closes the signal.
Helpful DecisionPoint Links (Can Be Found on DecisionPoint.com Links Page):
DecisionPoint Shared ChartList and DecisionPoint Chart Gallery
Price Momentum Oscillator (PMO)
Swenlin Trading Oscillators (STO-B and STO-V)
