
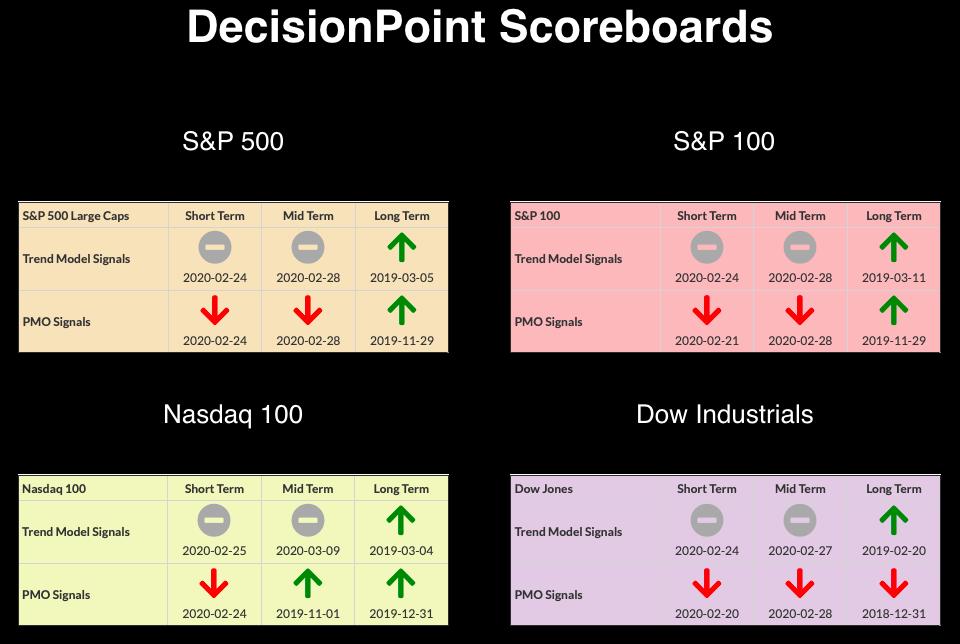
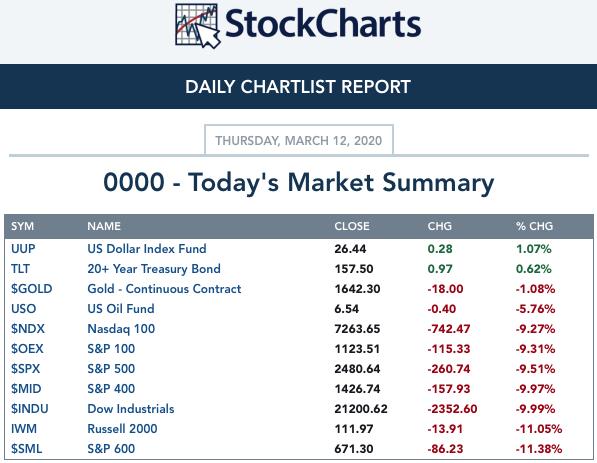
There's much to talk about! We had three new Long-Term Trend Model SELL signals (XLF, XLI and IWM), small- and mid-caps are being crushed, money mangers have reduced exposure to next to nothing and we had another historic drop in the Dow and S&P 500 (among others). Support levels continue to be destroyed and the end really doesn't seem in sight. How bad was it? Only ONE stock in the S&P 500 closed higher (OXY). Let that sink in...ONE.
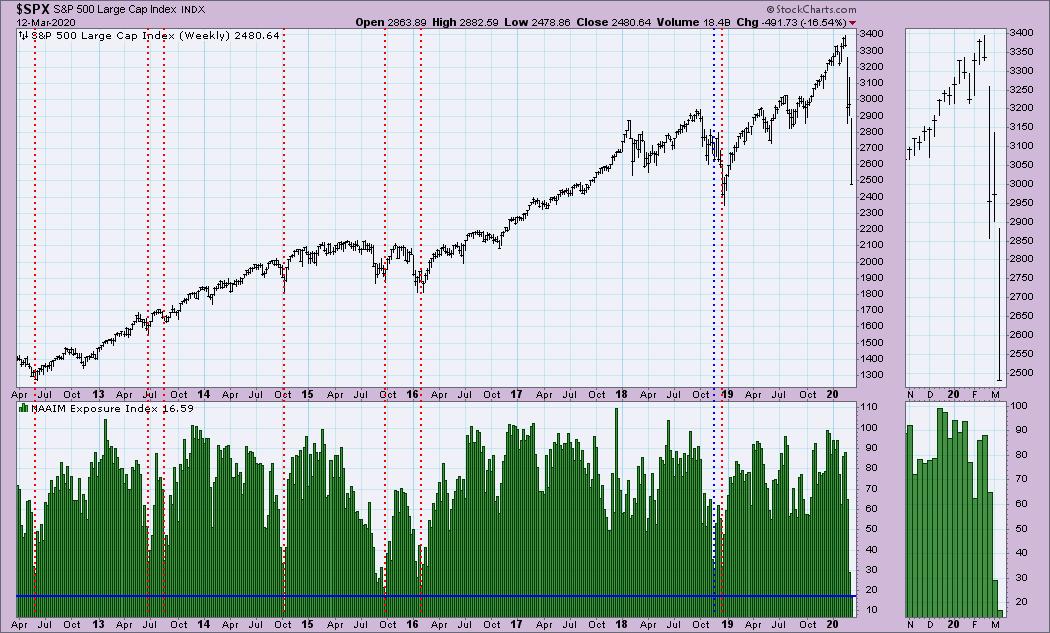
Look at the pullback on National Association of Active Money Managers (NAAIM). They aren't shorting, they are divesting. The good news is that generally when some of these levels are reached it does mark a solid bottom as noted by the red dotted lines. However, I see the end of 2018 the first major drop in exposure had only a temporary effect. It didn't take long before exposure pulled back again and THEN we had a rebound. I'm not hanging my hat on oversold conditions, even here. In bear markets, oversold conditions can stretch and persist.
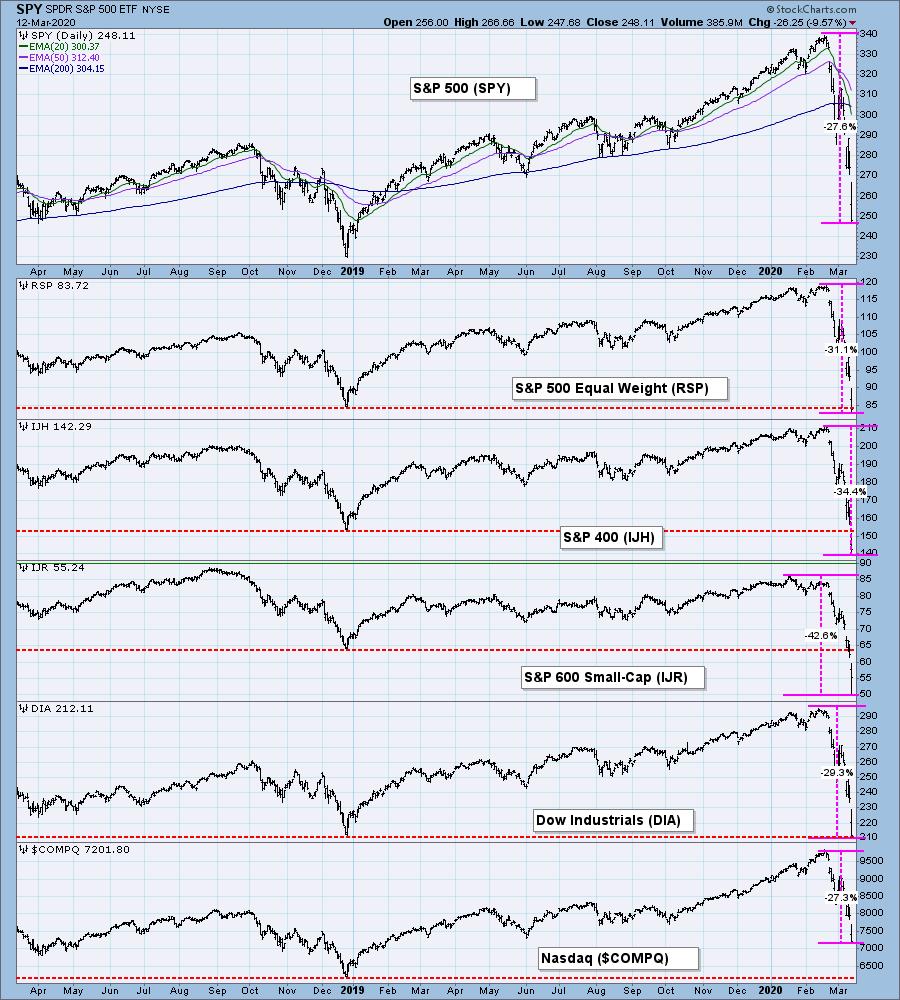
Below is a chart that shows us the broad market price action. Note that many have already dropped below support at the 2018 low and are continuing their spiral downward. Small and mid-caps are being decimated.
CURRENT BROAD MARKET DP Signals:
TODAY'S Broad Market Action:
Past WEEK Results: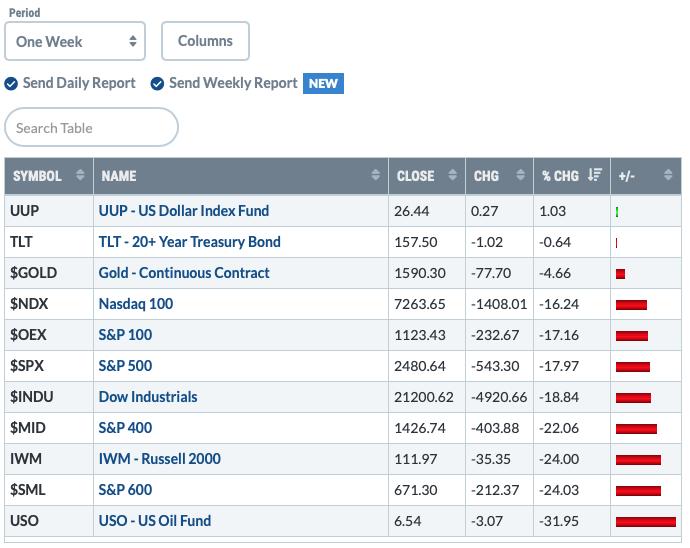
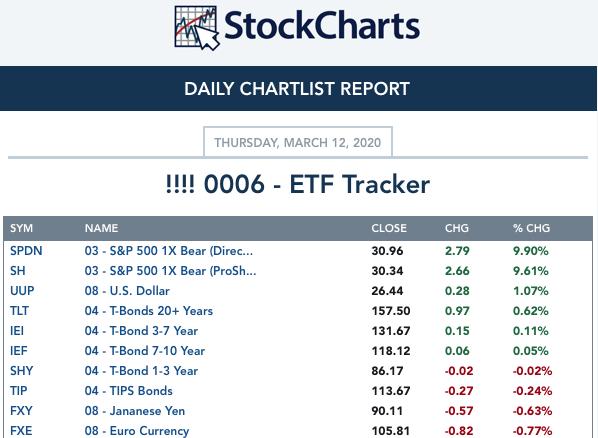
Top 10 from ETF Tracker:
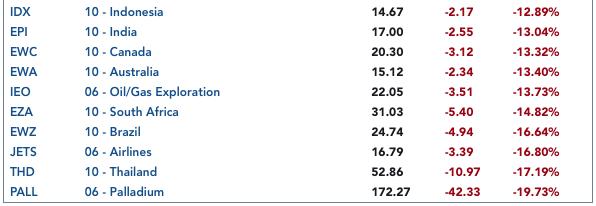
Bottom 10 from ETF Tracker:
On Friday, the DecisionPoint Alert Weekly Wrap presents an assessment of the trend and condition of the stock market (S&P 500), the U.S. Dollar, Gold, Crude Oil, and Bonds. Monday through Thursday the DecisionPoint Alert daily report is abbreviated and covers changes for the day.
Watch the latest episode of DecisionPoint on StockCharts TV's YouTube channel here!
SECTORS
SIGNALS:
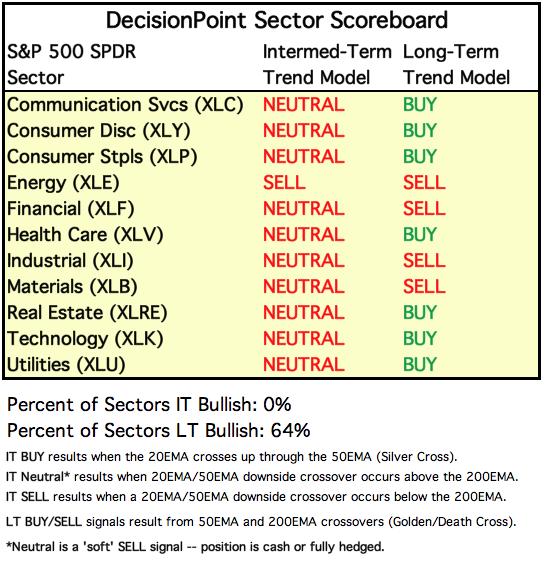
Each S&P 500 Index component stock is assigned to one, and only one, of 11 major sectors. This is a snapshot of the Intermediate-Term (Silver Cross) and Long-Term (Golden Cross) Trend Model signal status for those sectors.
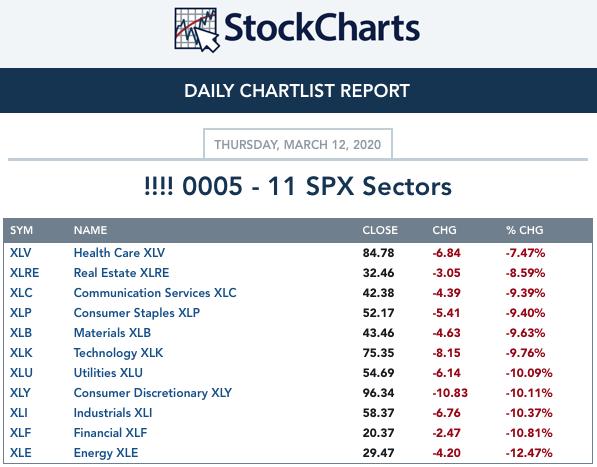
TODAY'S RESULTS:
One WEEK Results: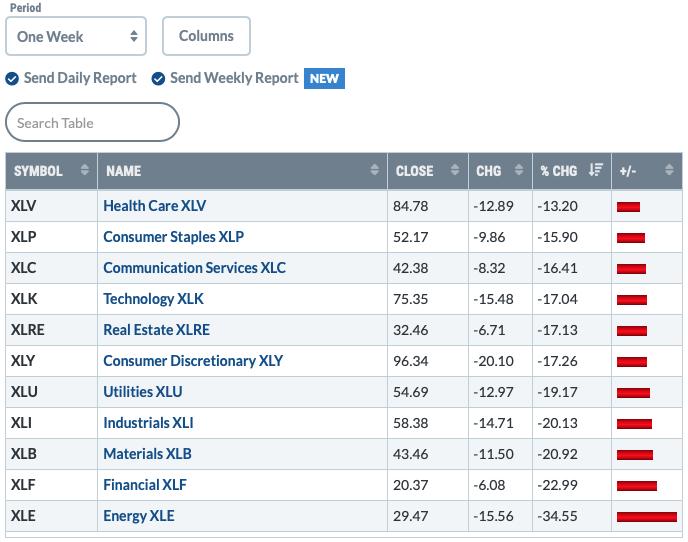
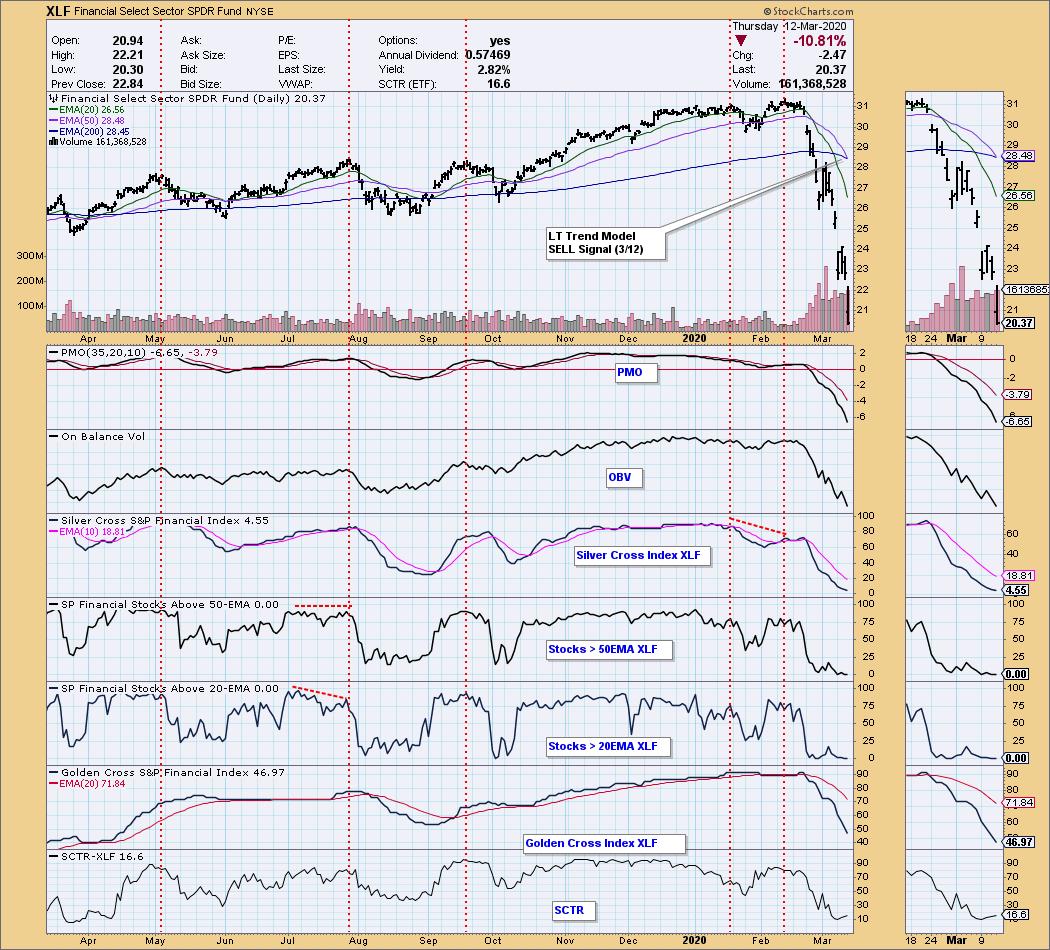
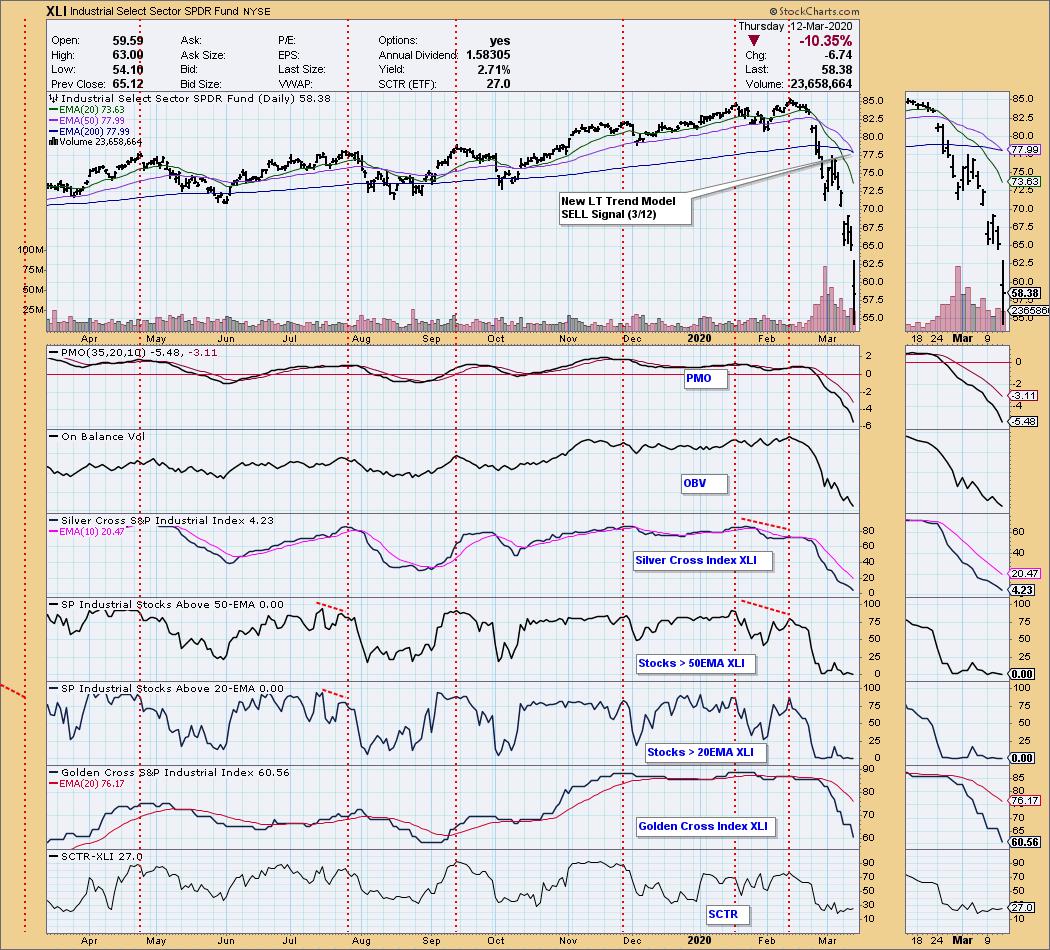
Both XLF and XLI generated Long-Term Trend Model SELL signal when their 50-EMA crossed below their 200-EMA. The damage continues and we should see more LT Trend Model SELL signals very soon as prices are well-below 200-EMAs on the remaining sectors.
STOCKS
IT Trend Model: NEUTRAL as of 2/28/2020
LT Trend Model: BUY as of 2/26/2019
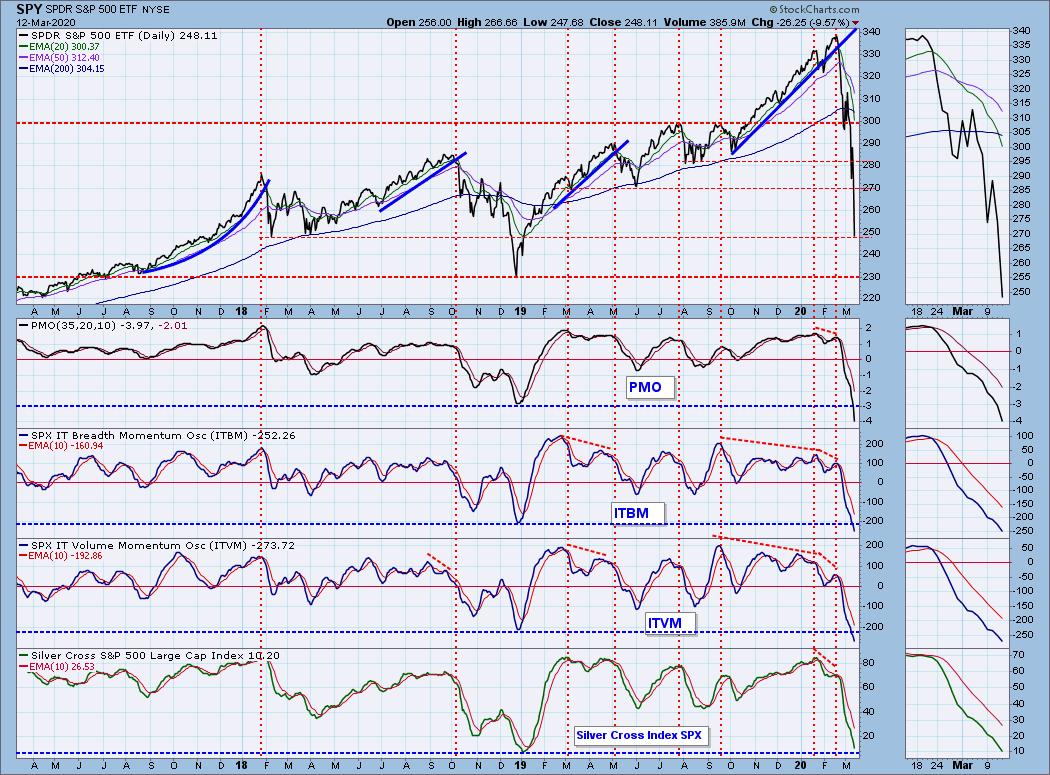
SPY Daily Chart: Another major area of support was sliced through with prices closing near the lows for the day. Panic has set in. The markets HATE the unknown and the financial effects on the country is quite unknown. With self-quarantines and school closings many will be stuck at home. I recommend catching up on back issues of our reports and binging on StockCharts TV. It's a learning opportunity that is being forced so take advantage. Total volume today was higher than we've seen with this bear market. It would be great to see an historic rally, but the ground does not seem fertile...more like barren. The VIX (new methodology) has hit an historic high and I believe it will move even higher.
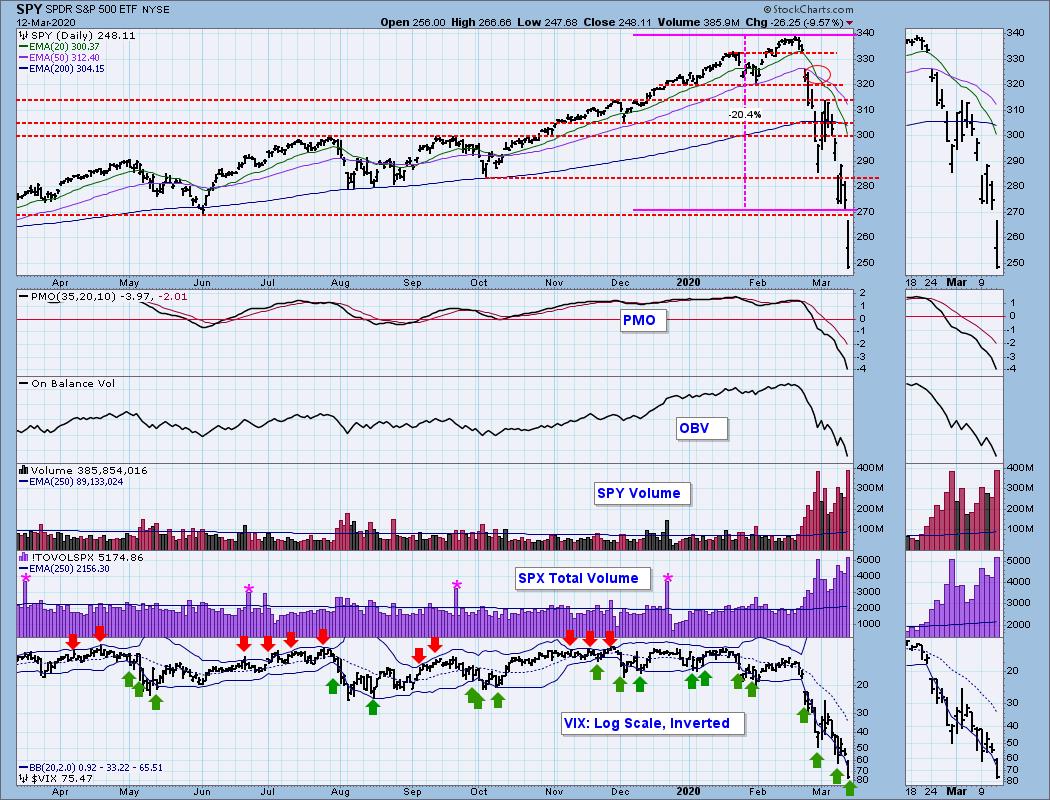
Climactic Market Indicators: Climactic readings continue to stretch. I would love to say this is a selling exhaustion, but the selling doesn't seem exhausted. After breaking down through another technical support level, this is more like a selling initiation.
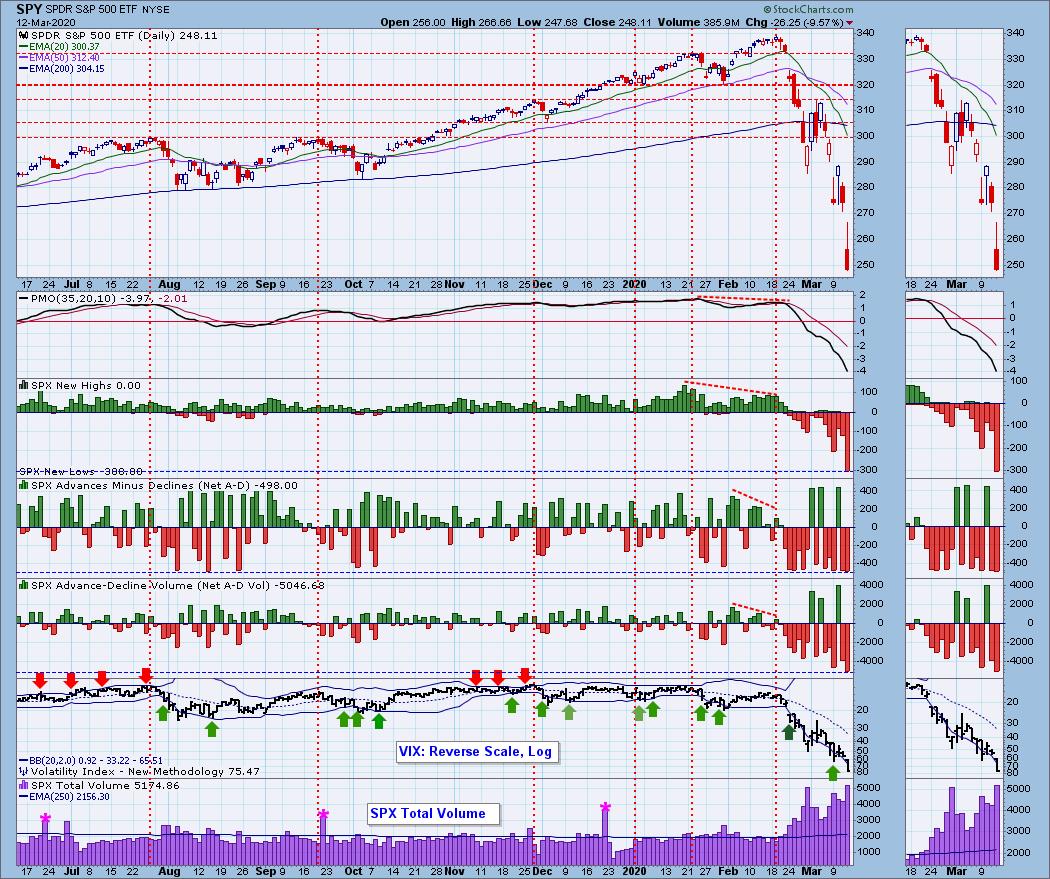
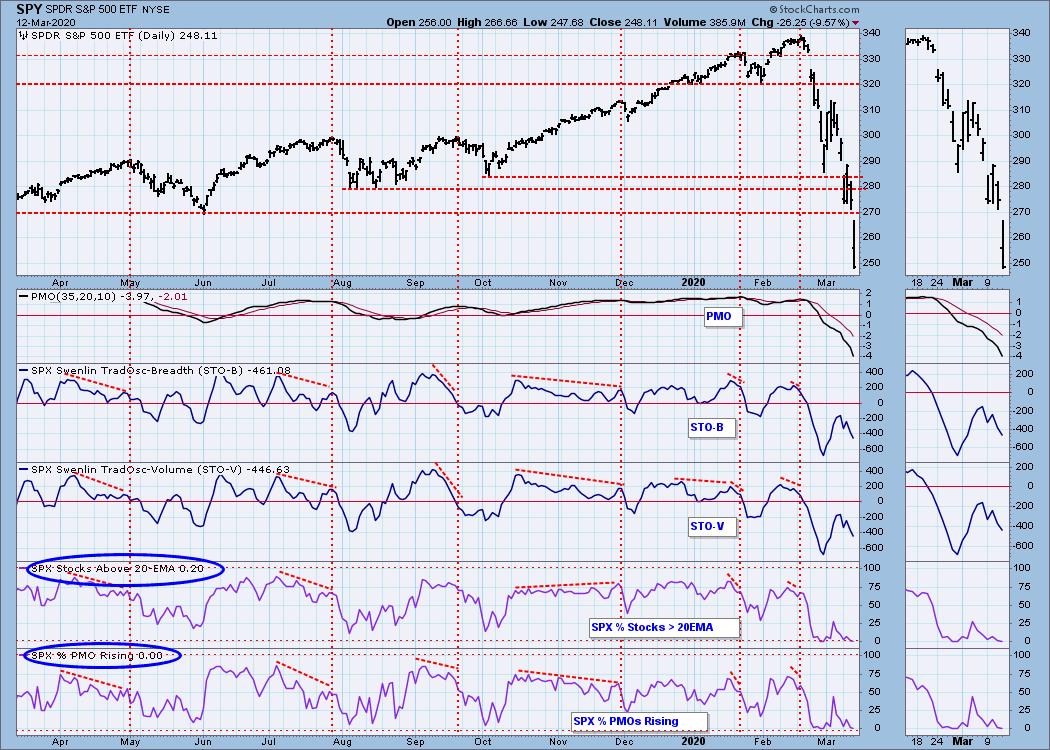
Short-Term Market Indicators: The ST trend is DOWN and the market condition is OVERSOLD based upon the Swenlin Trading Oscillator (STO) readings. Readings are getting ready to move into oversold extremes.
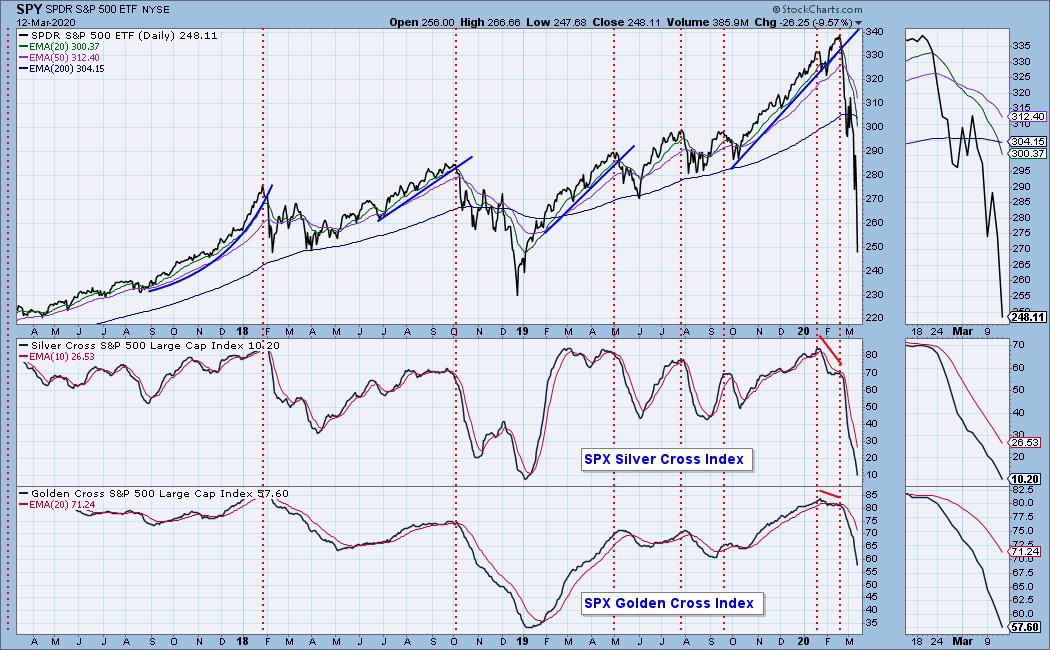
Intermediate-Term Market Indicators: The Silver Cross Index (% of SPX stocks 20EMA > 50EMA) and the Golden Cross Index (percent of SPX stocks 50EMA > 200EMA) are declining. The SCI is now at the levels we saw near the 2018 low. The GCI however could still fall further.
The IT trend is DOWN and the market condition is EXTREMELY OVERSOLD based upon all of the readings on the indicators below. We are looking at levels we have not seen on our IT indicators since
To put these readings in perspective, you'll note that we haven't seen these low readings since 2008 bear market lows and the 2002 bear market lows. I would like to caveat... these are oscillators so they have to oscillate. If we see them bottom, we would still want to take that with a grain of salt.
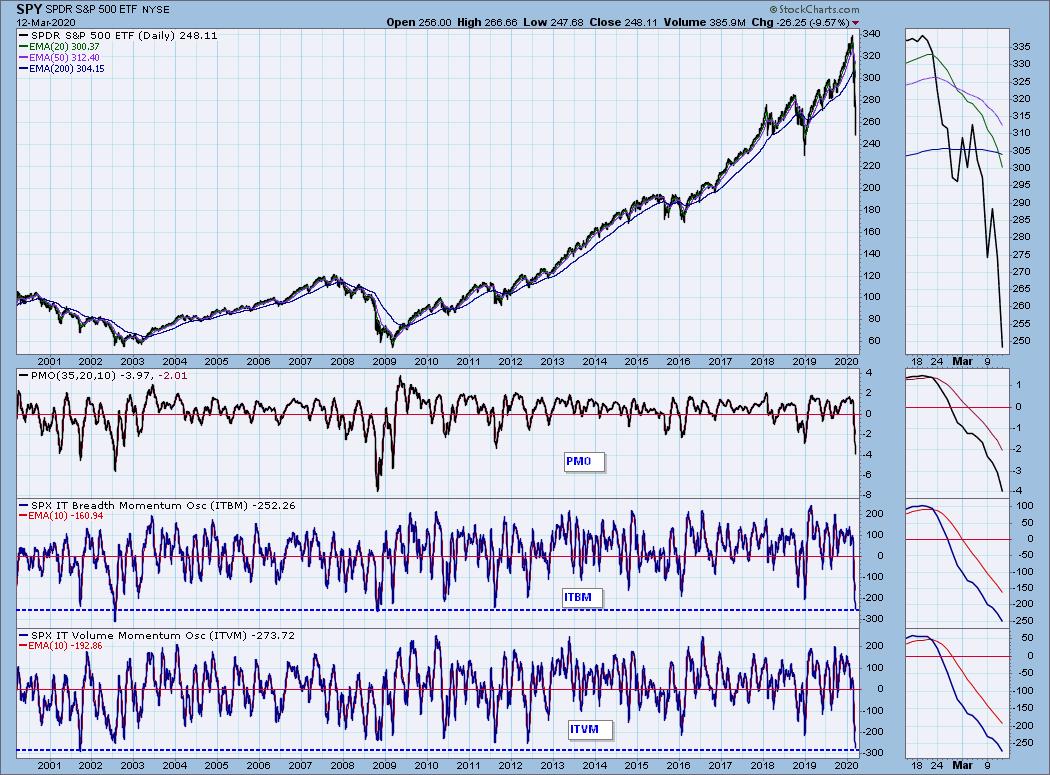
CONCLUSION: The ST and IT trends are DOWN. Market condition based on ST and IT indicators is VERY OVERSOLD. No one wants to use the word "crash" but given this is the swiftest decline into a bear market, I think I'm justified. Until the 'unknown' becomes more known, there is more follow-through on this crash.
(Not a Diamonds subscriber? Add it to your DP Alert subscription and get a discount! Contact support@decisionpoint.com for your limited time coupon code!)
DOLLAR (UUP)
IT Trend Model: NEUTRAL as of 3/9/2020
LT Trend Model: BUY as of 5/25/2018
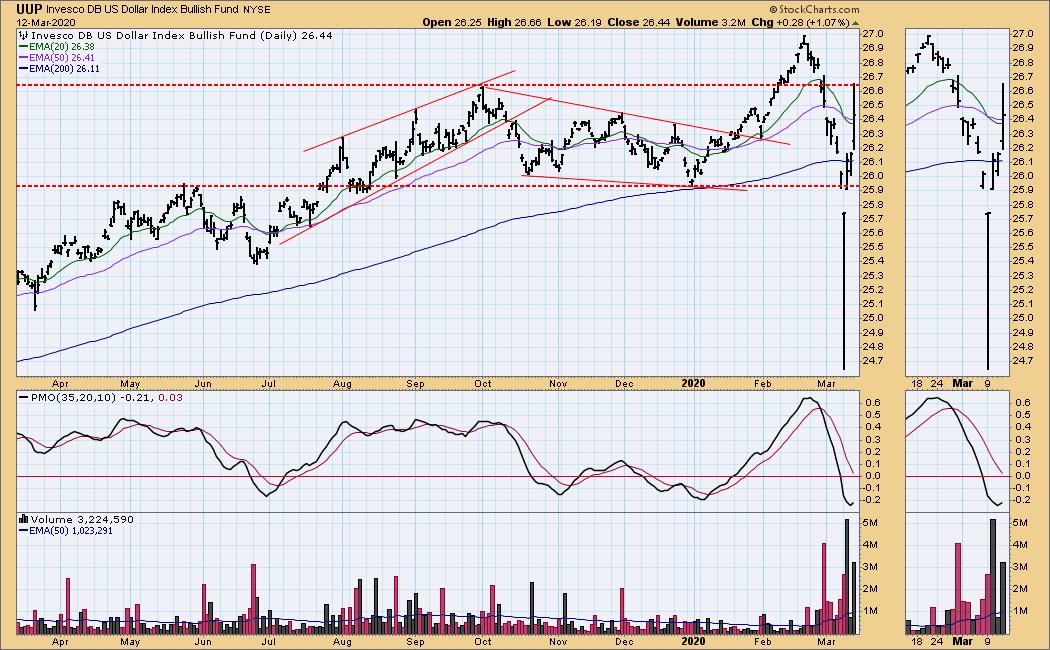
UUP Daily Chart: The Dollar hit overhead resistance at the October top and was stopped. The PMO is bottoming in oversold territory, so the technical expectation is a breakout.
GOLD
IT Trend Model: BUY as of 12/26/2019
LT Trend Model: BUY as of 1/8/2019
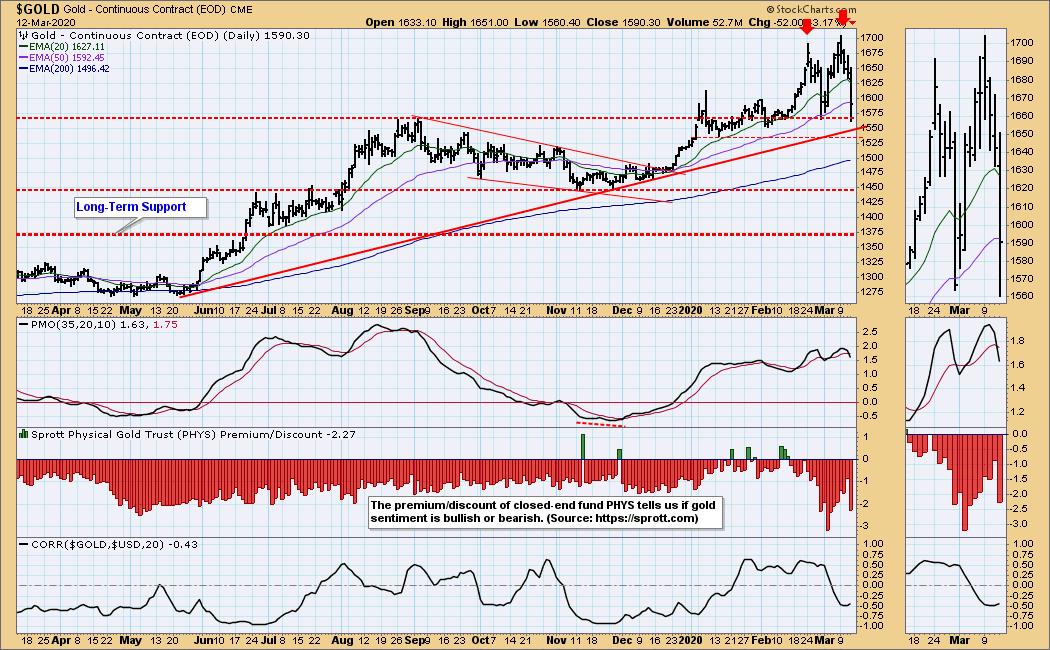
GOLD Daily Chart: We now have a double-top on Gold. It technically executed on the low today, but it is far from a decisive breakdown. The intermediate-term rising trend is now in play. I note that the confirmation line of this double-top pattern is at the August top. If we do get a resolution to the downside, the minimum downside target would put us around 1450 where we do have strong support. I don't think we will have to move that low before a reversal. The question is whether Gold is going to be considered a good place to be as this bear market continues on.
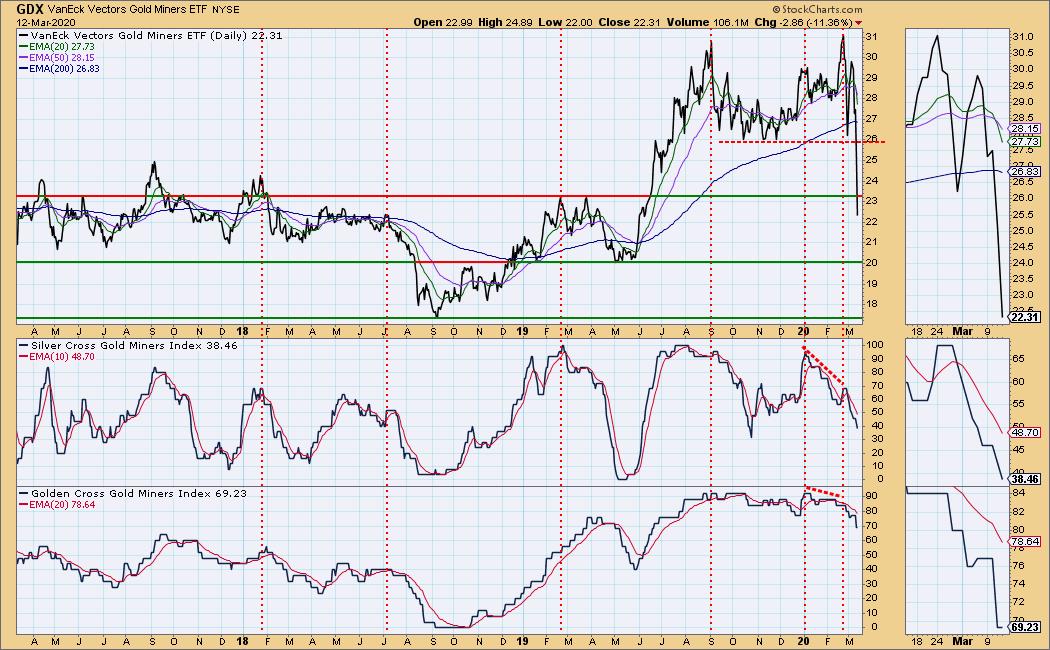
GOLD MINERS Golden and Silver Cross Indexes: More support levels being broken. Next up is $20. The SCI and GCI could certainly move more oversold, so I'd expect lower prices to continue.
CRUDE OIL (USO)
IT Trend Model: Neutral as of 1/27/2020
LT Trend Model: SELL as of 2/3/2020
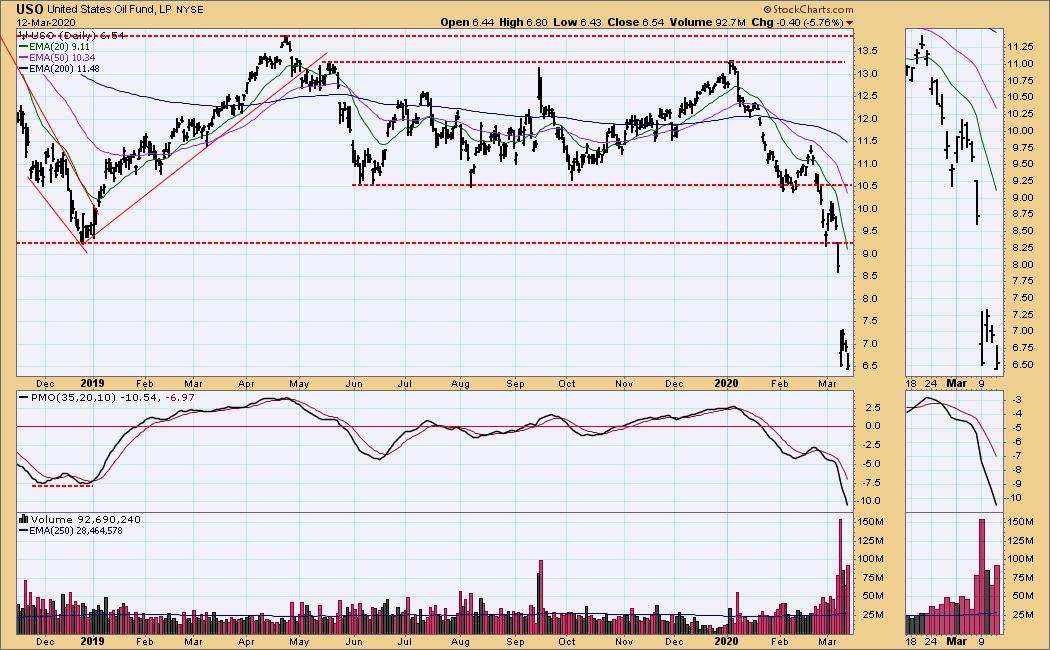
USO Daily Chart: Oil continues to struggle. I don't see any respite in sight. The PMO is continuing to free fall.
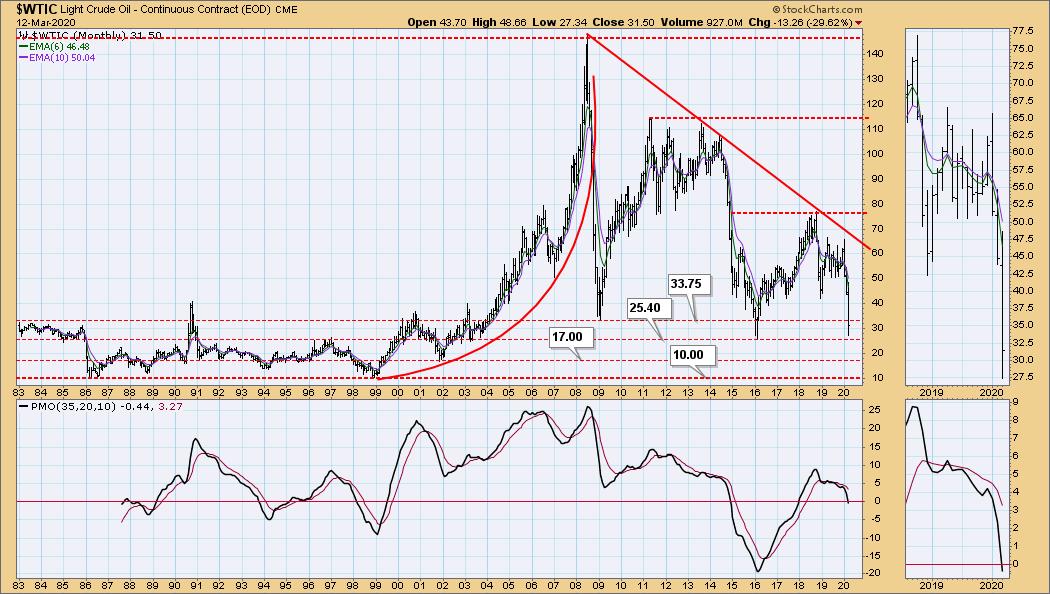
Carl's chart from yesterday's article (FREE!) shows the various support levels for WTIC. Solvency could become an issue for many smaller shale and fracking businesses. I heard that $30/barrel was about breakeven for many of them.
BONDS (TLT)
IT Trend Model: BUY as of 1/22/2020
LT Trend Model: BUY as of 1/2/2019
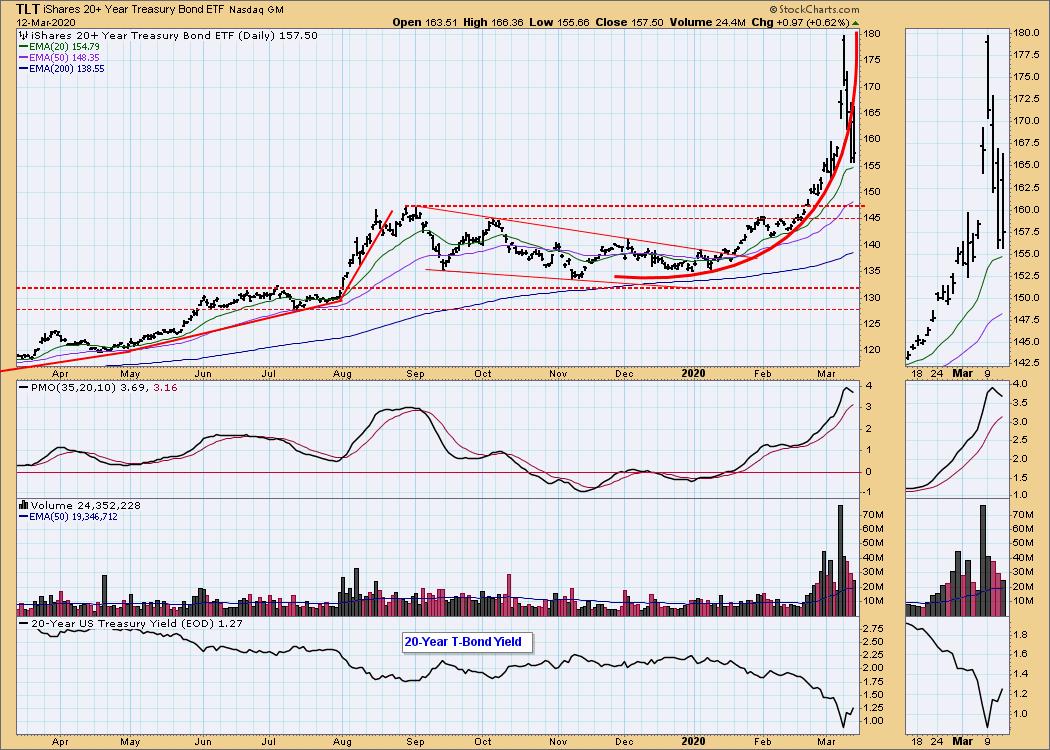
TLT Daily Chart: Bonds were one of the few winners on the day, but with a topping PMO and a parabolic breakdown, I would expect to see TLT come down and test the August top.
Have you subscribed the DecisionPoint Diamonds yet? DP does the work for you by providing handpicked stocks/ETFs from exclusive DP scans! Add it with a discount! Contact support@decisionpoint.com for more information!
Technical Analysis is a windsock, not a crystal ball.
Happy Charting! - Erin
Email: erin@decisionpoint.com
Erin Swenlin will be presenting at the The MoneyShow Las Vegas May 11-13, 2020! You'll have an opportunity to meet Erin and discuss the latest DecisionPoint news and Diamond Scans. Claim your FREE pass here! You can watch online with this pass too!!
NOTE: The signal status reported herein is based upon mechanical trading model signals, specifically, the DecisionPoint Trend Model. They define the implied bias of the price index based upon moving average relationships, but they do not necessarily call for a specific action. They are information flags that should prompt chart review. Further, they do not call for continuous buying or selling during the life of the signal. For example, a BUY signal will probably (but not necessarily) return the best results if action is taken soon after the signal is generated. Additional opportunities for buying may be found as price zigzags higher, but the trader must look for optimum entry points. Conversely, exit points to preserve gains (or minimize losses) may be evident before the model mechanically closes the signal.
Helpful DecisionPoint Links (Can Be Found on DecisionPoint.com Links Page):
DecisionPoint Shared ChartList and DecisionPoint Chart Gallery
Price Momentum Oscillator (PMO)
Swenlin Trading Oscillators (STO-B and STO-V)
