
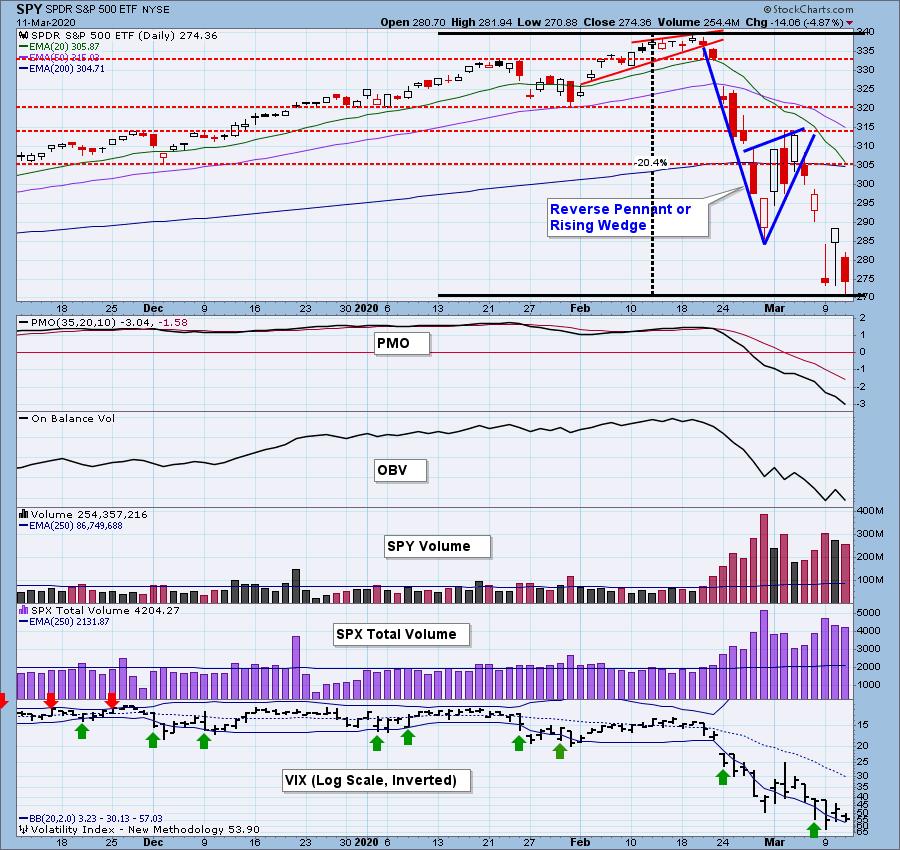
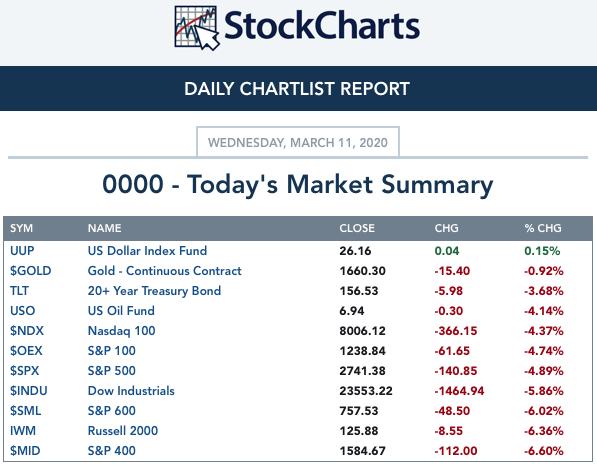
It is now official. We have entered a bear market. Our Long-Term Trend Model hasn't had the 50/200-EMA negative crossover, but it's filled the percentage requirement. Volume was still at 'panic' level, but we did see it pull back just a bit. We'll look at a longer-term chart later to distinguish support levels for this bear market. I was on "The Final Bar" on StockCharts TV today and I gave viewers a look at where we see the market going longer-term. Dave Keller, the host, thanked me at the end of my presentation, but admitted he wished I'd had better news.
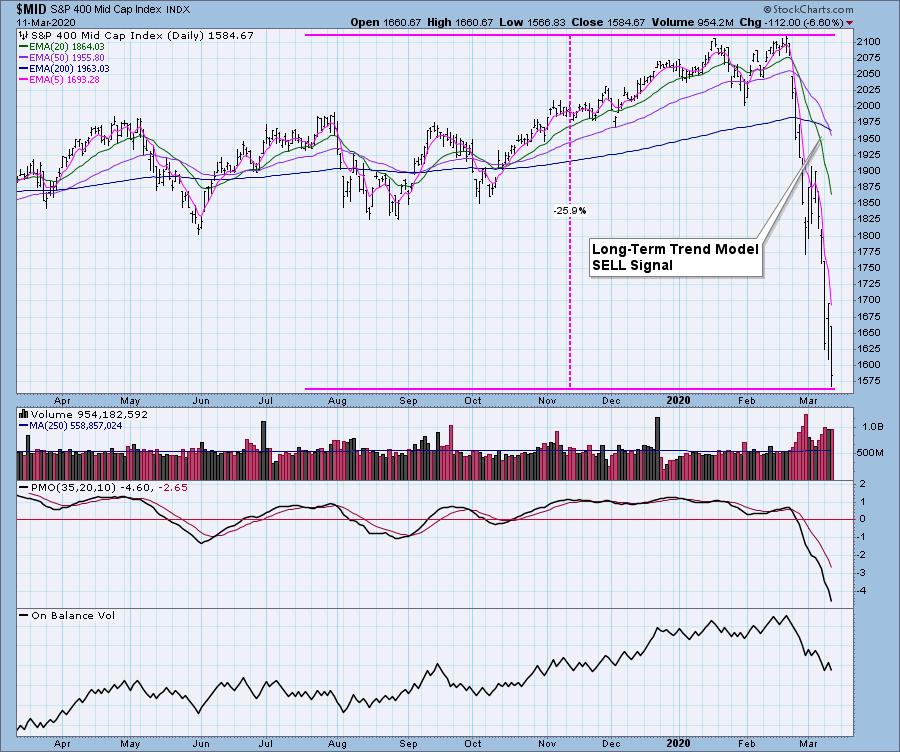
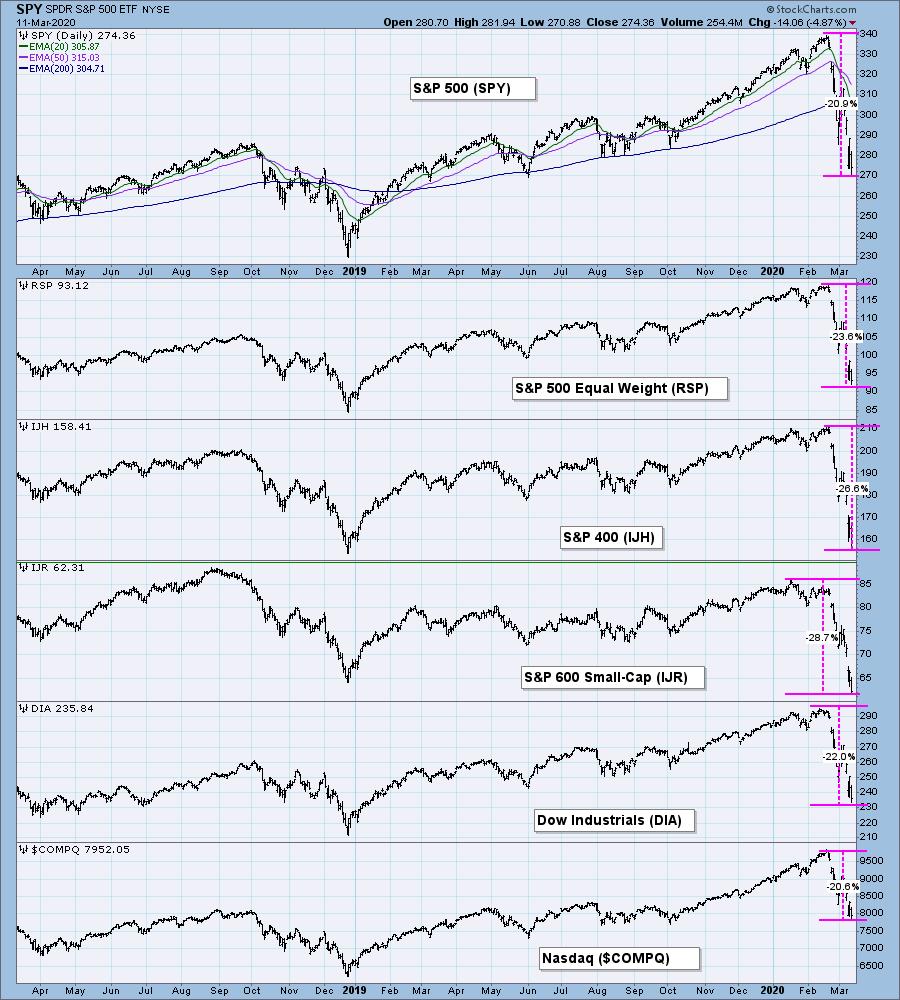
With a 50/200-EMA negative crossover, the S&P 400 has triggered a Long-Term Trend Model SELL signal. When stacked up against the other broad market indexes, it is has been hit hardest with the exception being the S&P 600 as you can see in the second chart below.
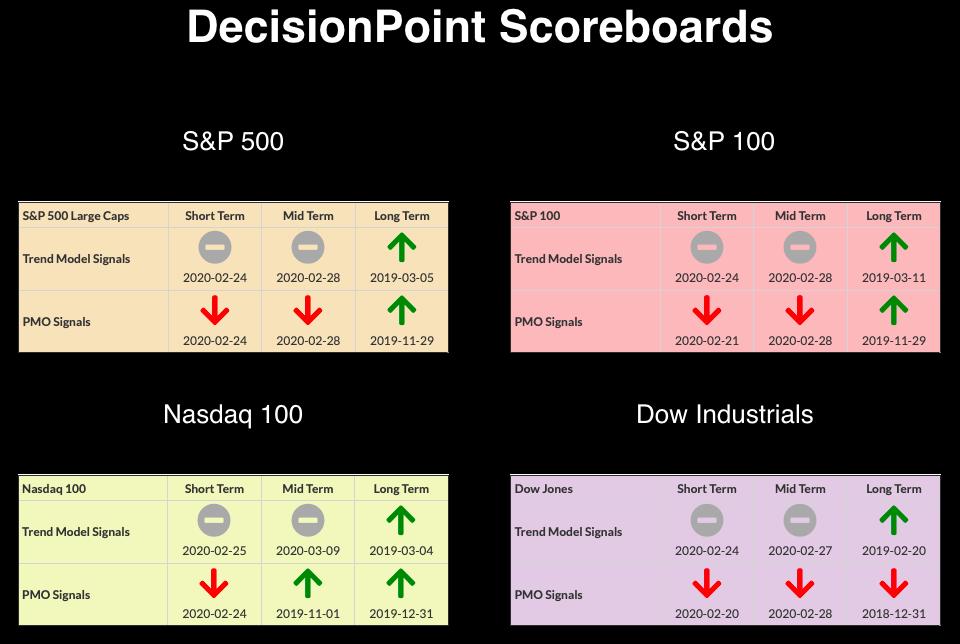
CURRENT BROAD MARKET DP Signals:
TODAY'S Broad Market Action:
Past WEEK Results: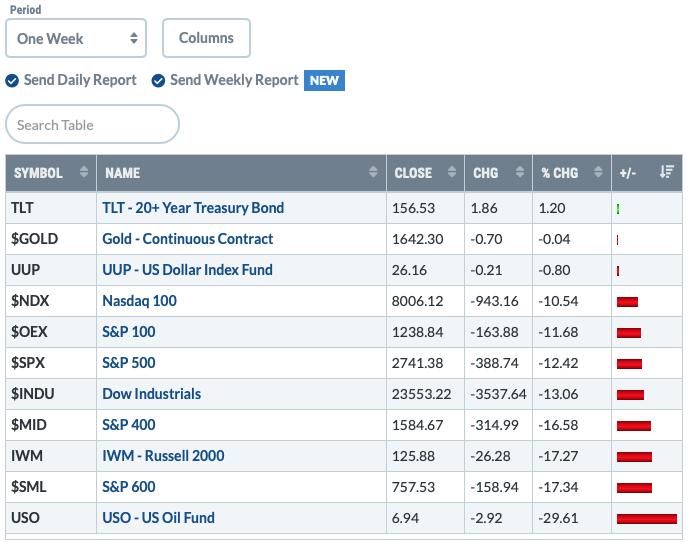
Top 10 from ETF Tracker:
Bottom 10 from ETF Tracker:
On Friday, the DecisionPoint Alert Weekly Wrap presents an assessment of the trend and condition of the stock market (S&P 500), the U.S. Dollar, Gold, Crude Oil, and Bonds. Monday through Thursday the DecisionPoint Alert daily report is abbreviated and covers changes for the day.
Watch the latest episode of DecisionPoint on StockCharts TV's YouTube channel here!
SECTORS
SIGNALS:
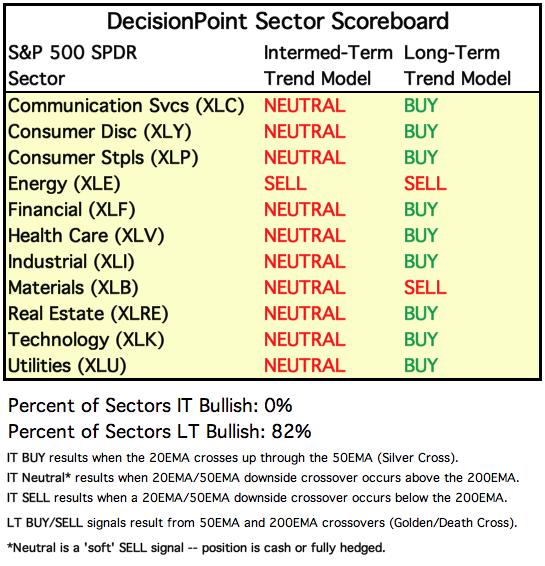
Each S&P 500 Index component stock is assigned to one, and only one, of 11 major sectors. This is a snapshot of the Intermediate-Term (Silver Cross) and Long-Term (Golden Cross) Trend Model signal status for those sectors.
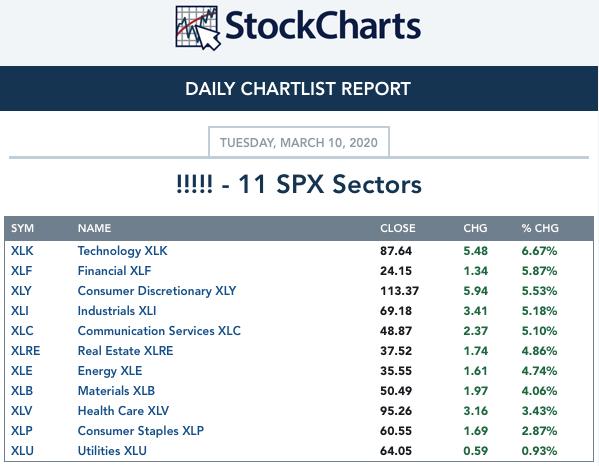
TODAY'S RESULTS:
One WEEK Results: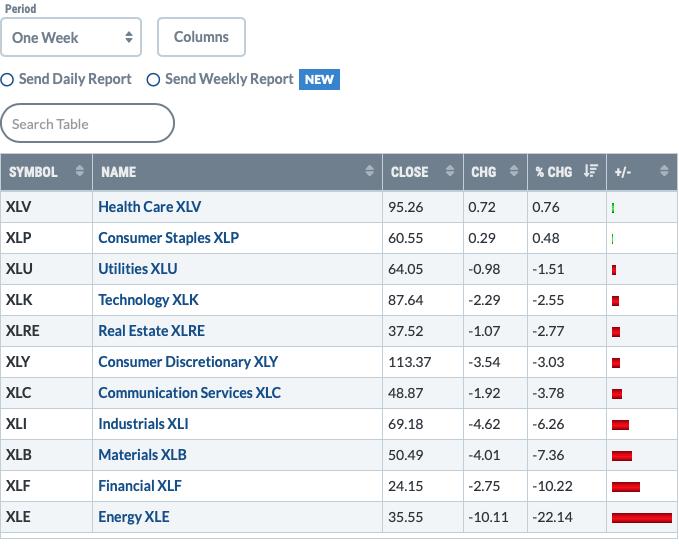
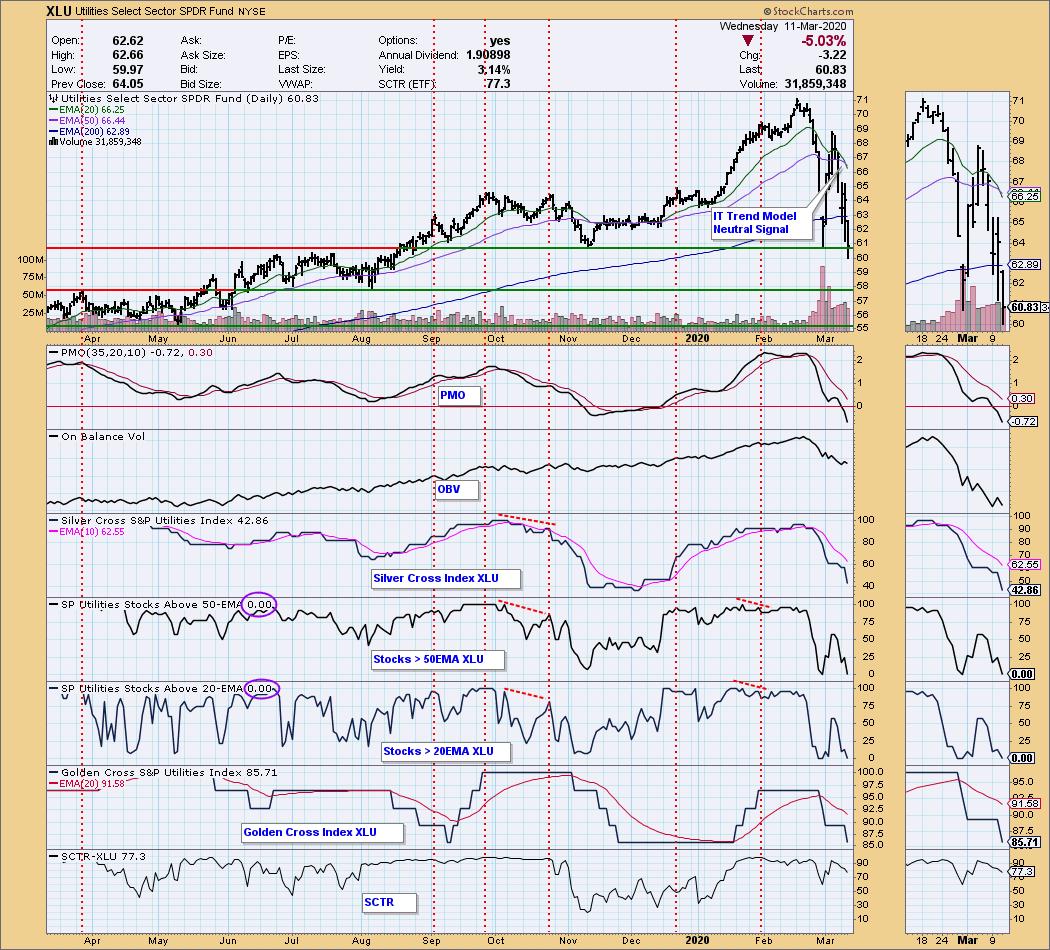
The last sector to lose its IT Trend Model BUY signal was Utilities. It's been one of the better performers in this bear market environment, but 'better performer' means its losses are less than the others. Today's drop brought price below important support at just under $61 with a close right on that support line. What is most important to note is that ZERO stocks in this sector have price above the 20-EMA OR the 50-EMA. If that continues, we will see the Golden Cross and Silver Cross Indexes plummet soon. Remember a "Silver Cross" is a 20-EMA above the 50-EMA and the "Golden Cross" is a 50/200-EMA positive crossover.
STOCKS
IT Trend Model: NEUTRAL as of 2/28/2020
LT Trend Model: BUY as of 2/26/2019
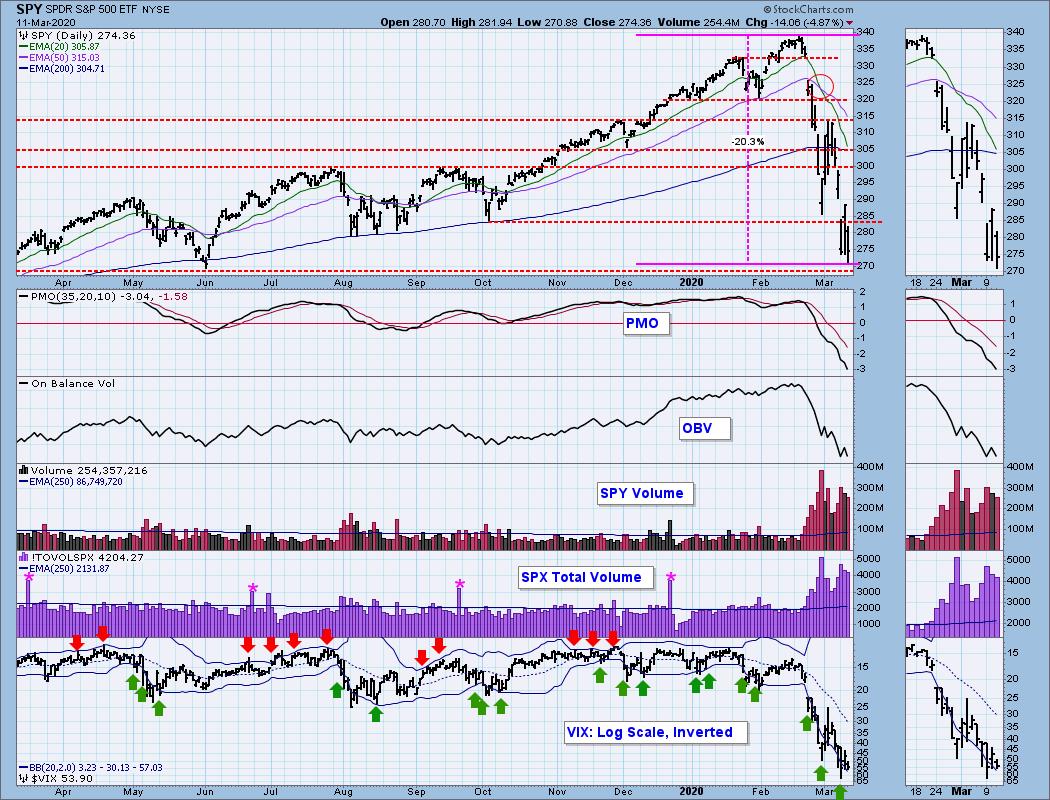
SPY Daily Chart: We are now testing the lows for the year. I do not think this is it. We could see some more volatility that would take the market sideways in a similar fashion as August.
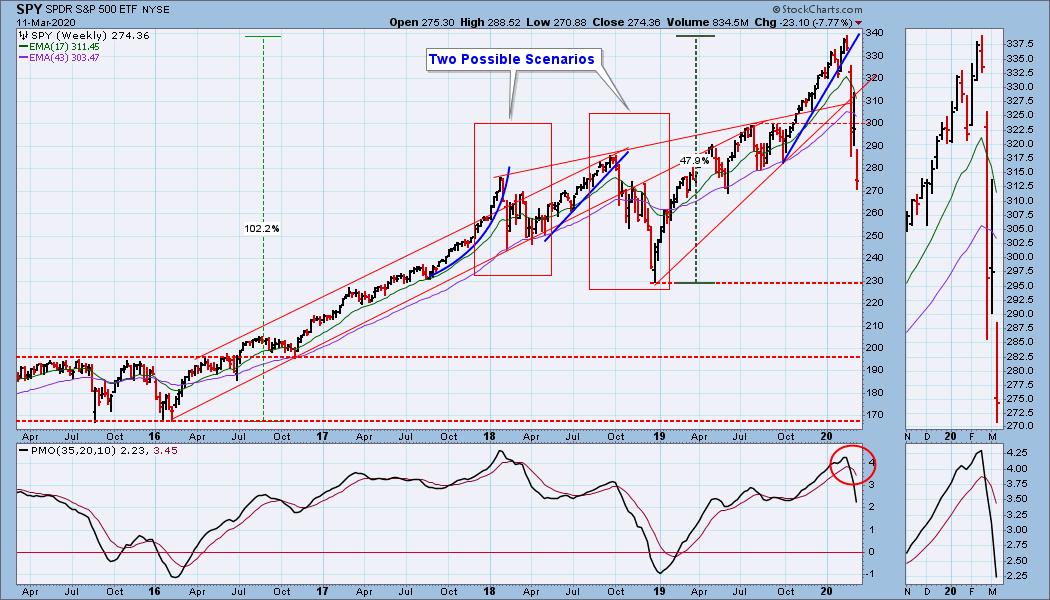
I think a weekly chart is needed so we can see the possible support levels for this bear market. Carl's chart below suggests support at $230 or possibly even a drop to $200. As I told Dave Keller today, I wouldn't expect that kind of drop this week (although we've sure seen some crazy market action), but it is a reasonable target for this bear market. Carl and I are leaning toward a scenario like the one in late 2018: an initial drop, sideways action to work it out and then another decline to the final low.
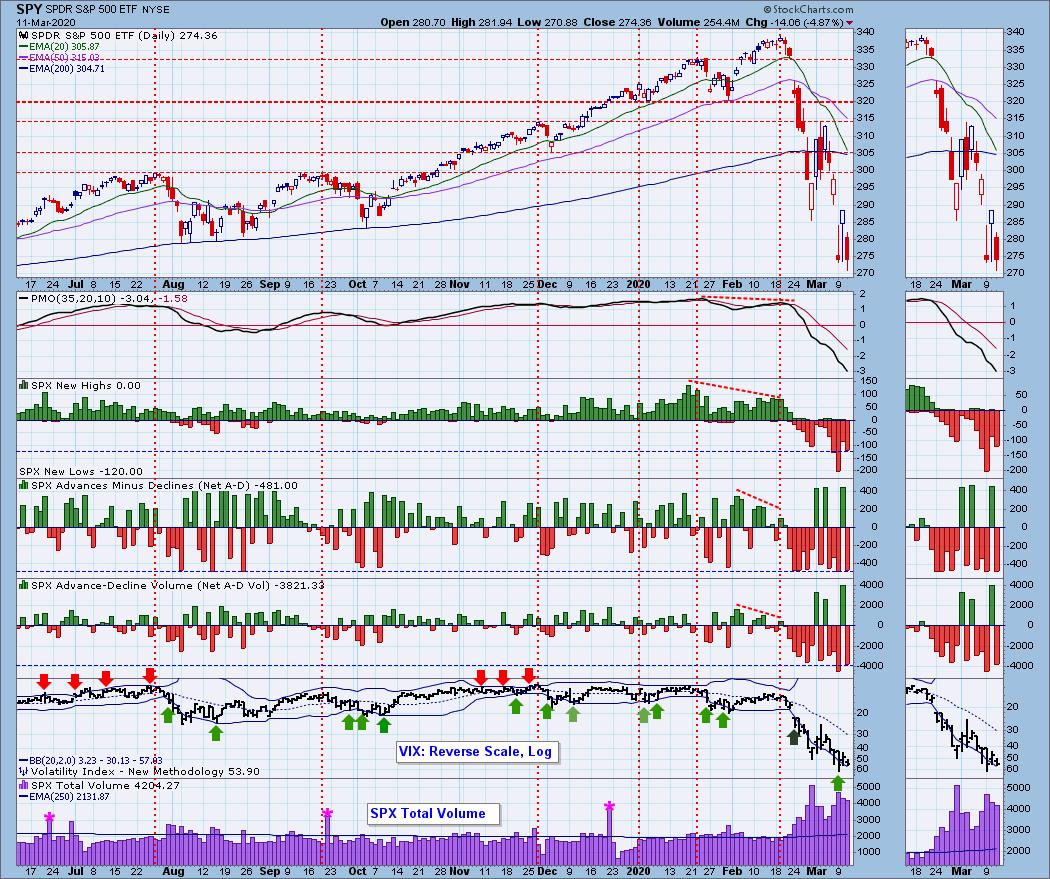
Climactic Market Indicators: More climactic readings, this time to the negative side. All of these indicators came in on the oversold side. Under 'normal' conditions, I would look at this as a selling initiation, but as of late with prices up one day and down the next, my confidence level is low given the extreme volatility readings. Everything looks so oversold, you would think that we are at a bottom, but many thought that last week and here we are.
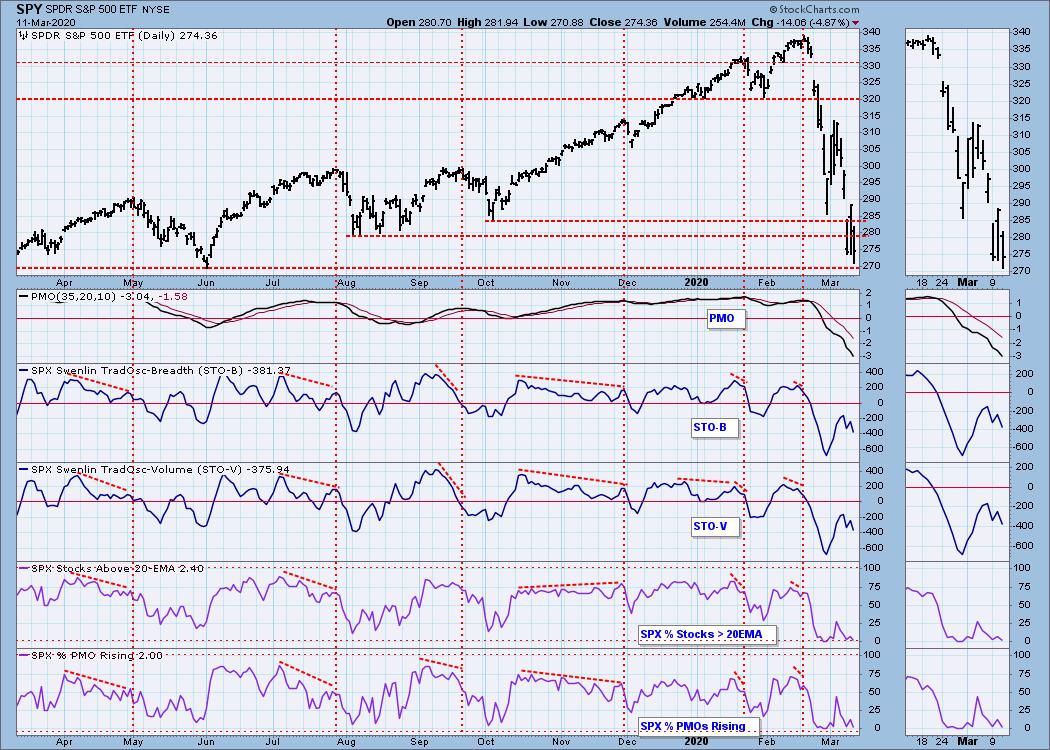
Short-Term Market Indicators: The ST trend is DOWN and the market condition is OVERSOLD based upon the Swenlin Trading Oscillator (STO) readings. We had another top under the zero line and below the previous top. Couldn't get much more bearish.
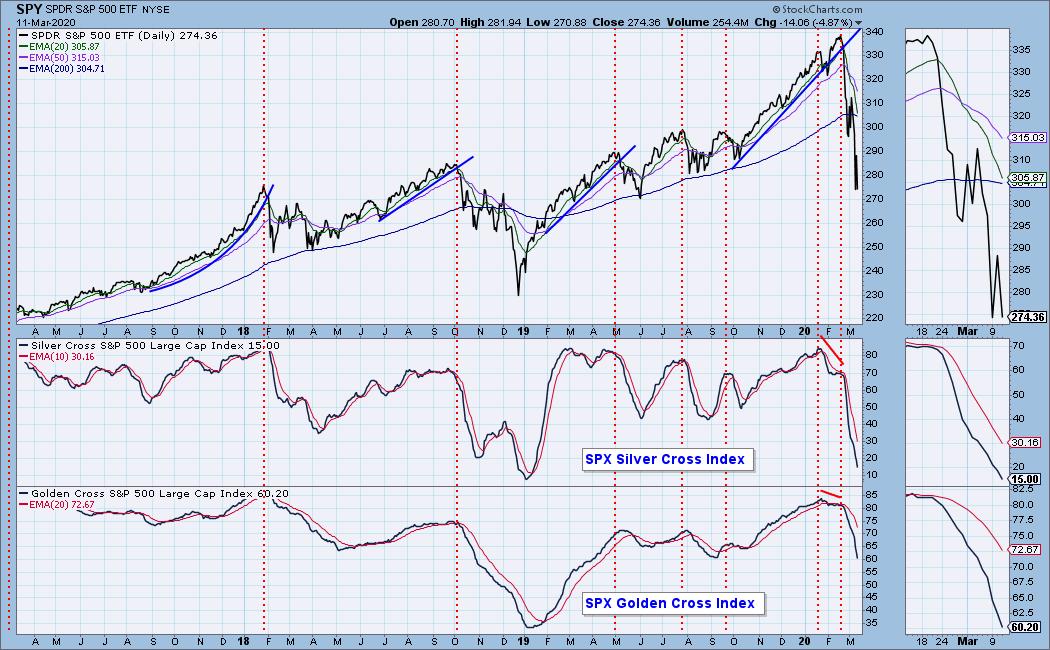
Intermediate-Term Market Indicators: The Silver Cross Index (% of SPX stocks 20EMA > 50EMA) and the Golden Cross Index (percent of SPX stocks 50EMA > 200EMA) are declining. Monday's comments still apply : "The SCI is now very oversold but has not hit its lows. The GCI is now hitting oversold territory, but it has more room to fall. With a very strong bull market rally, many stocks, like the market, have 50-EMAs well-above their 200-EMAs so it will take a bit longer to see the GCI hit the oversold levels we want."
The IT trend is DOWN and the market condition is VERY OVERSOLD based upon all of the readings on the indicators below. Yesterday's comments still apply: "Extremely oversold indicators are here and we are finally seeing the readings we did back at the end of 2018. They are beginning to decelerate but I'm way more interested in where they bottom." One thing I do note is that the $245 level is a possible support level for a turnaround or least a place where we will get sideways consolidation.
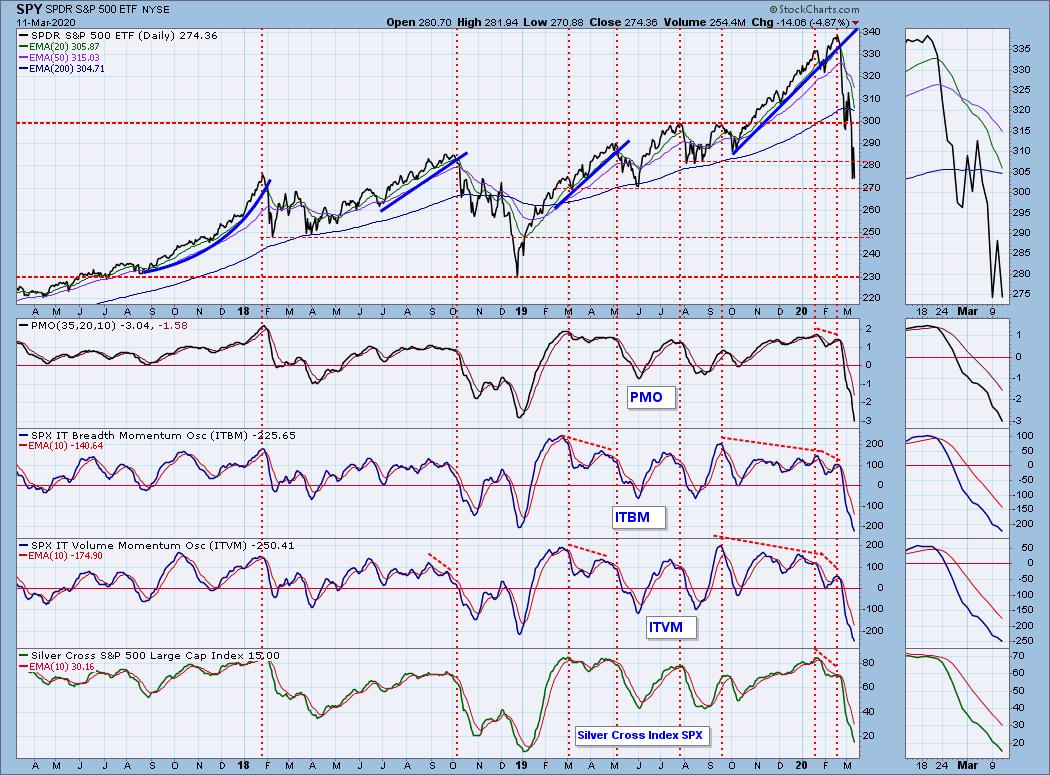
CONCLUSION: The ST and IT trends are DOWN. Market condition based on ST and IT indicators is VERY OVERSOLD. The magic "20%" number was reached today on the SPY that declared it was in a bear market. Many of the indexes and sectors had already hit the magic number, the SPY lagged. The important support levels to watch are $250 and $230. I think we will see a bounce at $270 simply because it is a "mental" or "sentiment" area of support given the world just called this a "bear market" based on percentage.
(Not a Diamonds subscriber? Add it to your DP Alert subscription and get a discount! Contact support@decisionpoint.com for your limited time coupon code!)
DOLLAR (UUP)
IT Trend Model: NEUTRAL as of 3/9/2020
LT Trend Model: BUY as of 5/25/2018
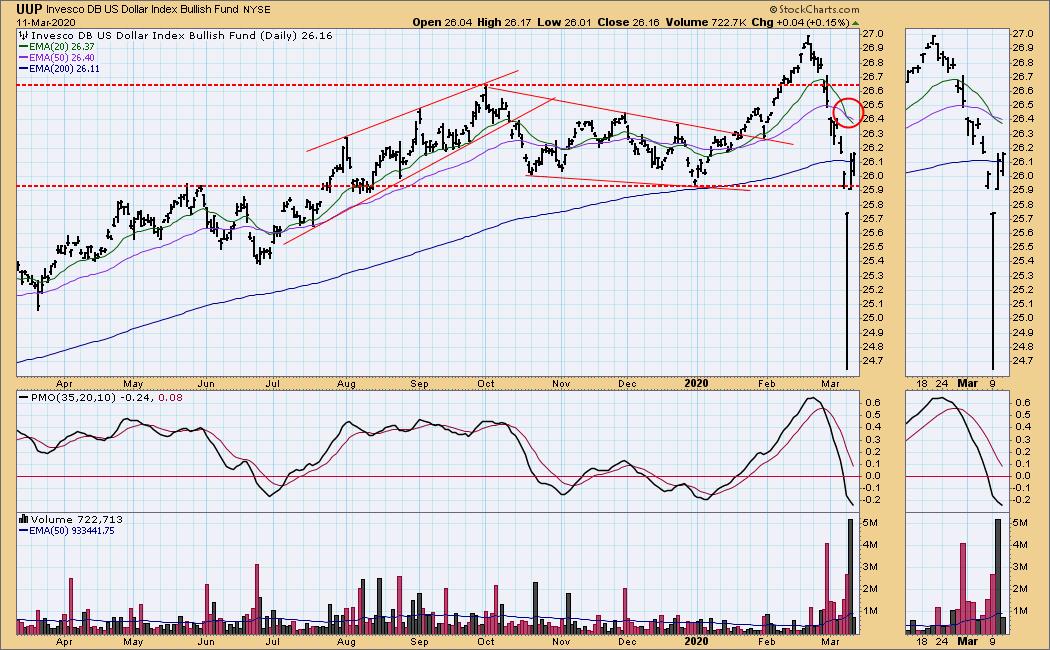
UUP Daily Chart: The Dollar was the one of a few winners today. We are beginning to see some deceleration in oversold territory by the PMO and price closed above the 200-EMA. We finally got an IT Trend Model Neutral signal, so I would expect to see the 20-EMA as a difficult hurdle for UUP.
GOLD
IT Trend Model: BUY as of 12/26/2019
LT Trend Model: BUY as of 1/8/2019
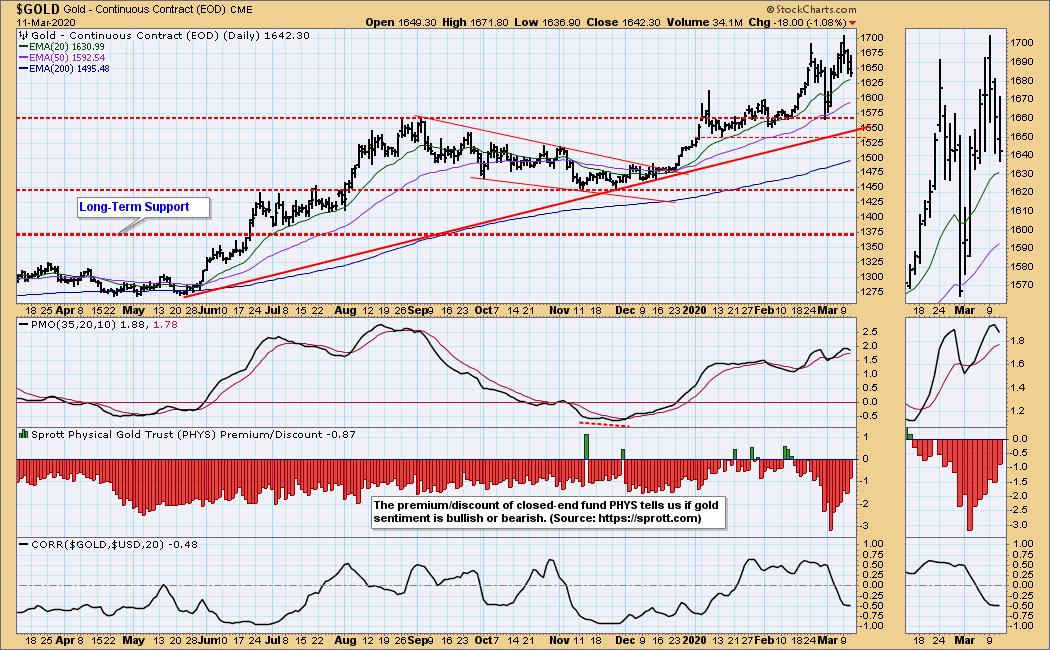
GOLD Daily Chart: I do not like the double-top that is forming on Gold. The PMO has topped as well. Discounts are pulling back which means sentiment is getting less bearish and with sentiment being a contrarian indicator, that's not a good thing. I'm not ready to throw in the towel on Gold (I still own it), we may see a pullback to 1600, but this still is generally a place many people hedge in bear market environments.
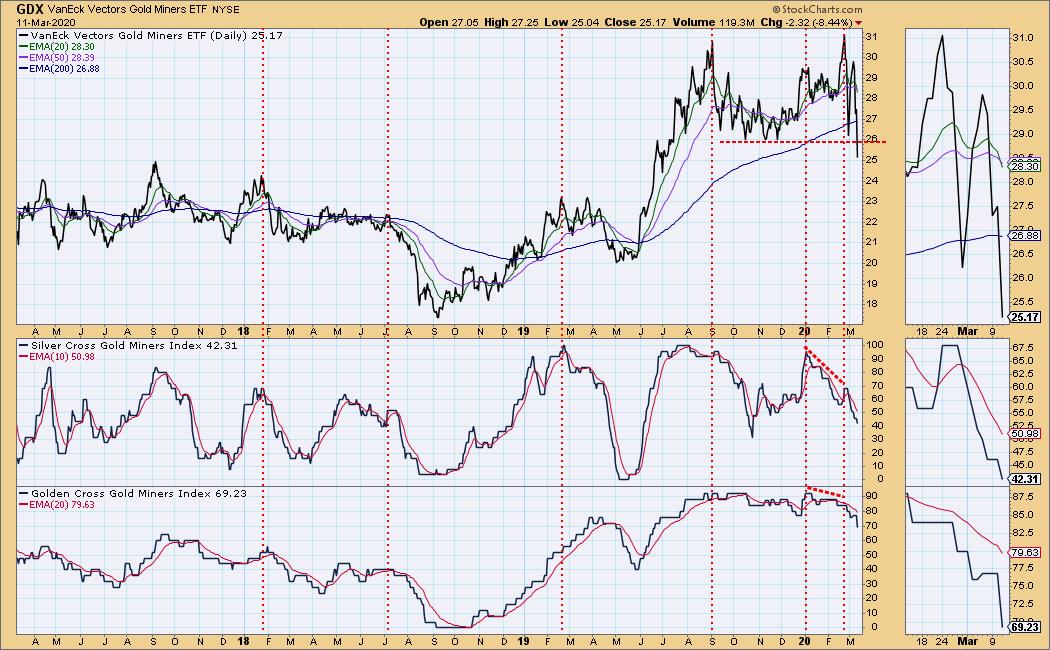
GOLD MINERS Golden and Silver Cross Indexes: Important support was broken. Not only did we see the decimation of the 200-EMA, we lost support at the late 2019 lows. The SCI and GCI indexes aren't that oversold so we could certainly see continued decline alongside a bear market.
CRUDE OIL (USO)
IT Trend Model: Neutral as of 1/27/2020
LT Trend Model: SELL as of 2/3/2020
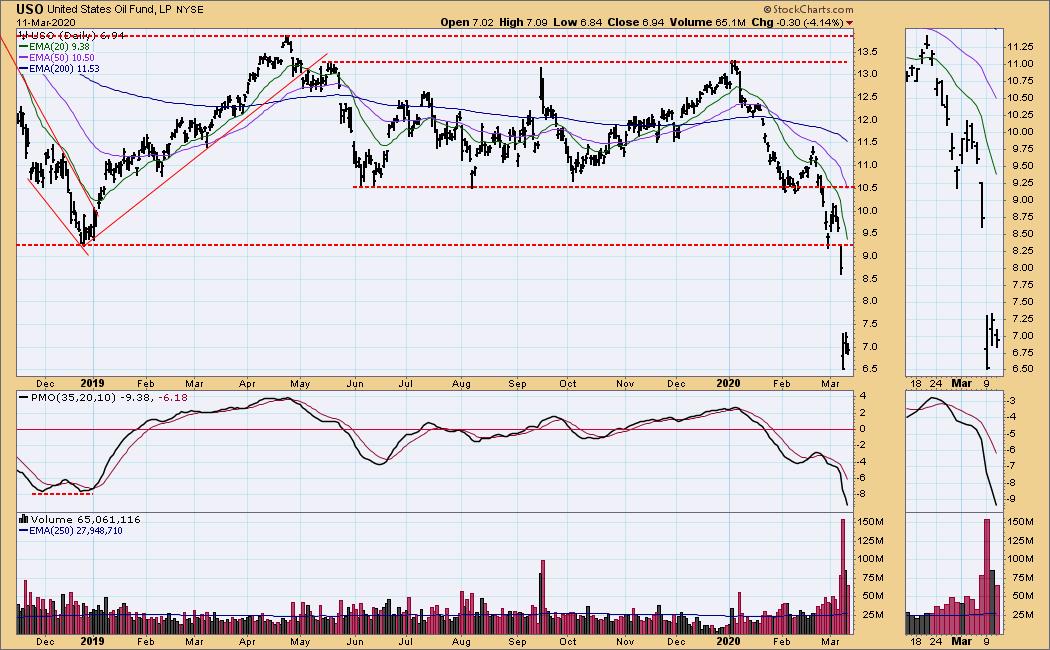
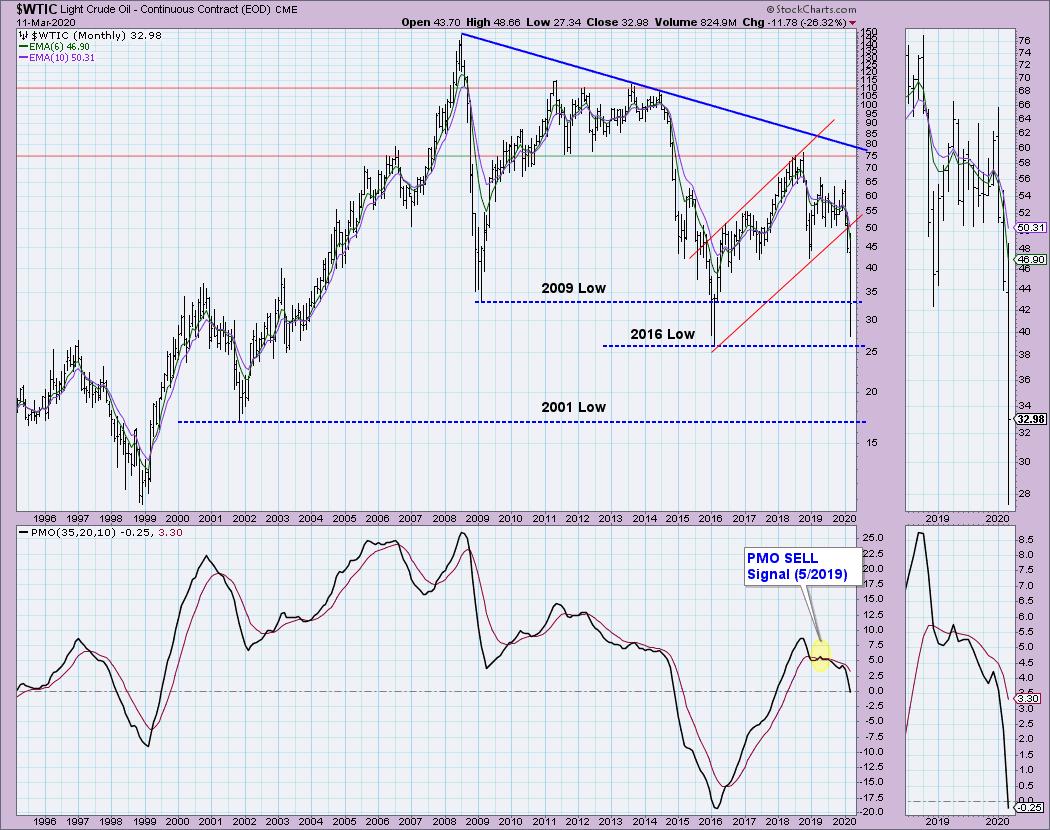
USO Daily Chart: Carl wrote an excellent piece in the free area of our website, so here's a link to his article.
BONDS (TLT)
IT Trend Model: BUY as of 1/22/2020
LT Trend Model: BUY as of 1/2/2019
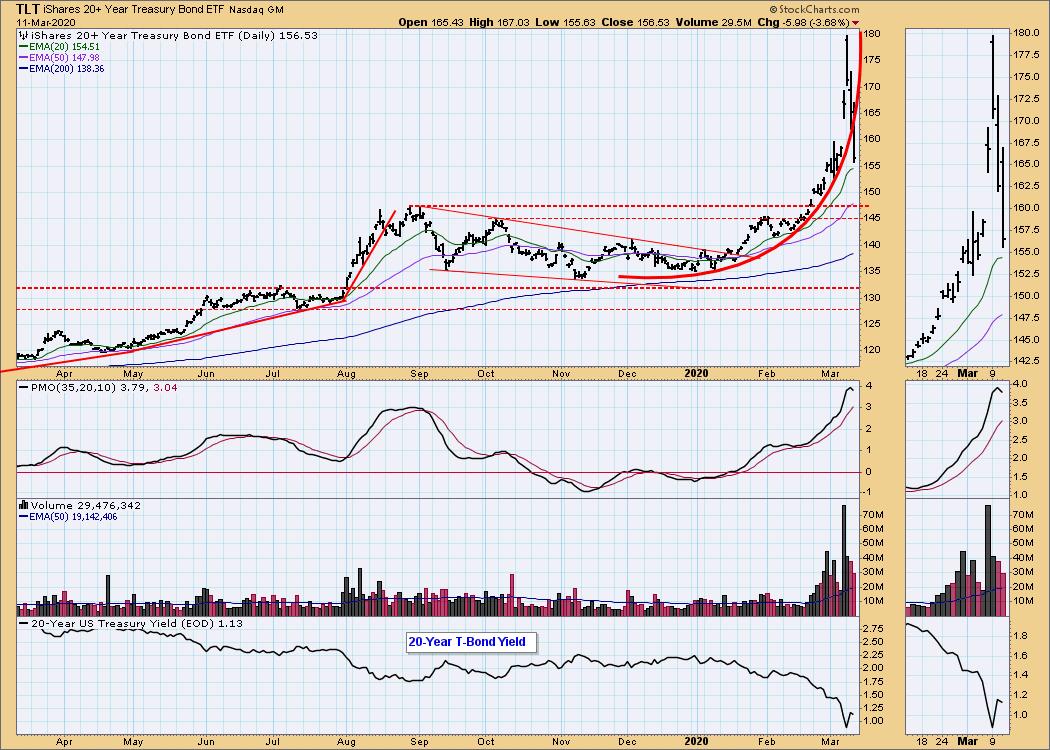
TLT Daily Chart: The parabolic pattern has resolved as expected with a quick decline back toward the last basing pattern. That could mean best case, a move to the August top.
Have you subscribed the DecisionPoint Diamonds yet? DP does the work for you by providing handpicked stocks/ETFs from exclusive DP scans! Add it with a discount! Contact support@decisionpoint.com for more information!
Technical Analysis is a windsock, not a crystal ball.
Happy Charting! - Erin
Email: erin@decisionpoint.com
Erin Swenlin will be presenting at the The MoneyShow Las Vegas May 11-13, 2020! You'll have an opportunity to meet Erin and discuss the latest DecisionPoint news and Diamond Scans. Claim your FREE pass here! You can watch online with this pass too!!
NOTE: The signal status reported herein is based upon mechanical trading model signals, specifically, the DecisionPoint Trend Model. They define the implied bias of the price index based upon moving average relationships, but they do not necessarily call for a specific action. They are information flags that should prompt chart review. Further, they do not call for continuous buying or selling during the life of the signal. For example, a BUY signal will probably (but not necessarily) return the best results if action is taken soon after the signal is generated. Additional opportunities for buying may be found as price zigzags higher, but the trader must look for optimum entry points. Conversely, exit points to preserve gains (or minimize losses) may be evident before the model mechanically closes the signal.
Helpful DecisionPoint Links (Can Be Found on DecisionPoint.com Links Page):
DecisionPoint Shared ChartList and DecisionPoint Chart Gallery
Price Momentum Oscillator (PMO)
Swenlin Trading Oscillators (STO-B and STO-V)
