
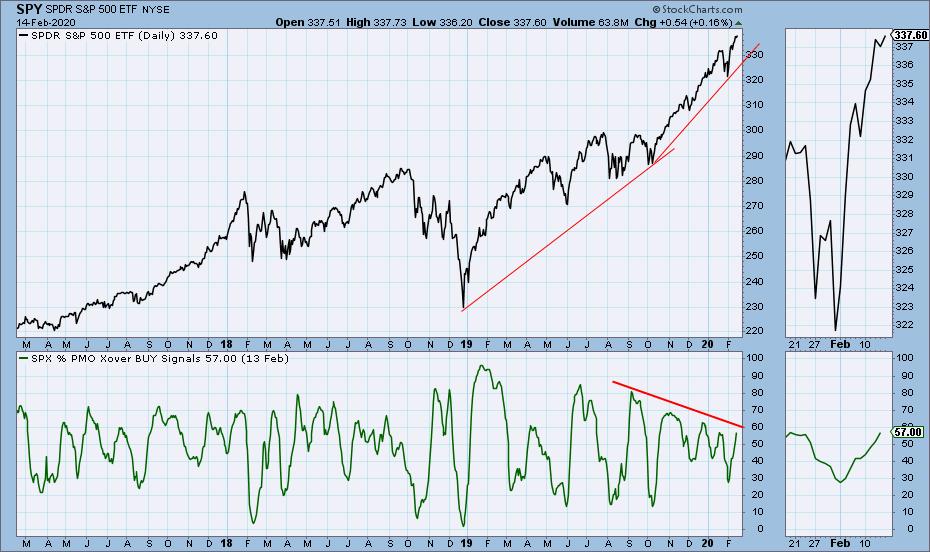
Here is a chart showing the percentage of S&P 500 stocks whose PMO has crossed up through the 10EMA, generating a PMO crossover BUY signal. Note how the SPY rising trend line accelerated out of the October 2019 price low, and at the same time the indicator made a series of lower highs. This is another demonstration of how S&P 500 component stock participation is narrowing as the index moves higher.
The DecisionPoint Alert Weekly Wrap presents an end-of-week assessment of the trend and condition of the Stock Market, the U.S. Dollar, Gold, Crude Oil, and Bonds. The DecisionPoint Alert daily report (Monday through Thursday) is abbreviated and gives updates on the Weekly Wrap assessments.
Watch the latest episode of DecisionPoint on StockCharts TV's YouTube channel here!
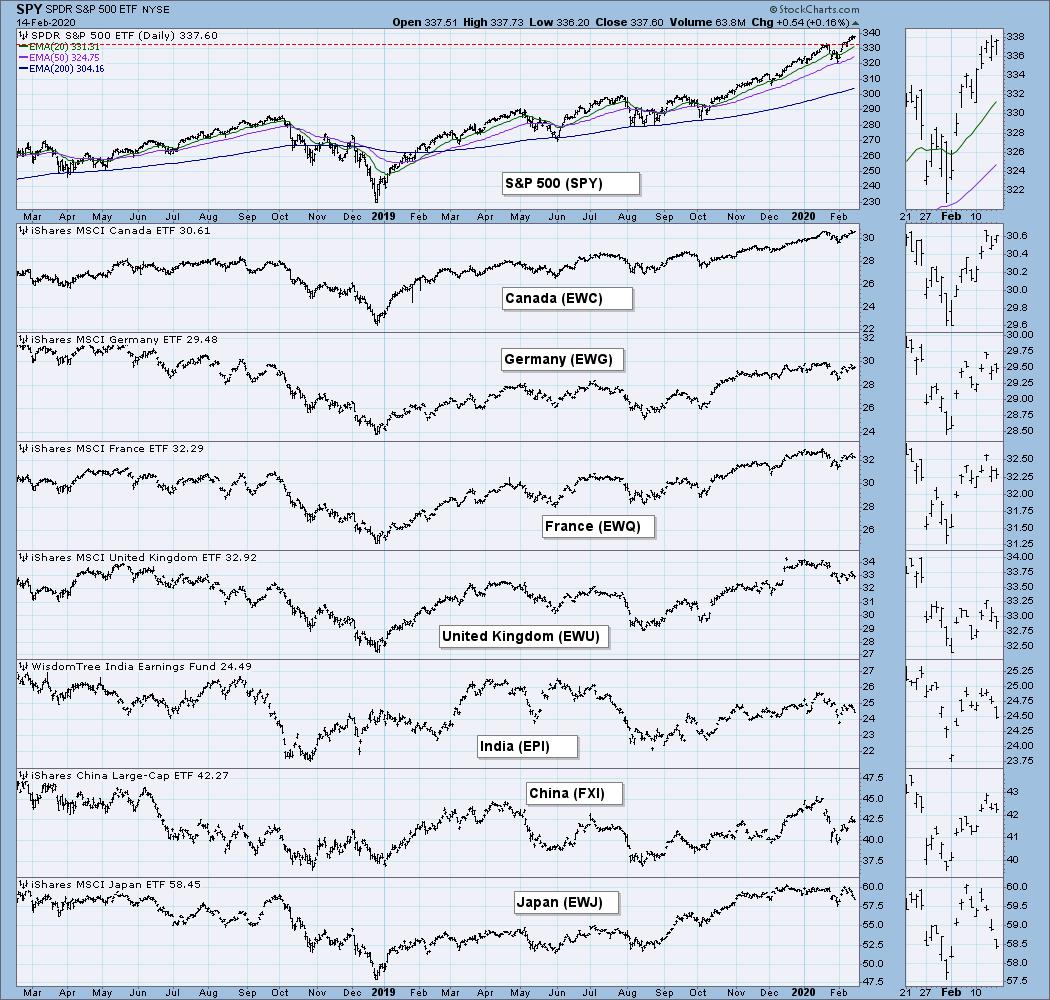
GLOBAL MARKETS
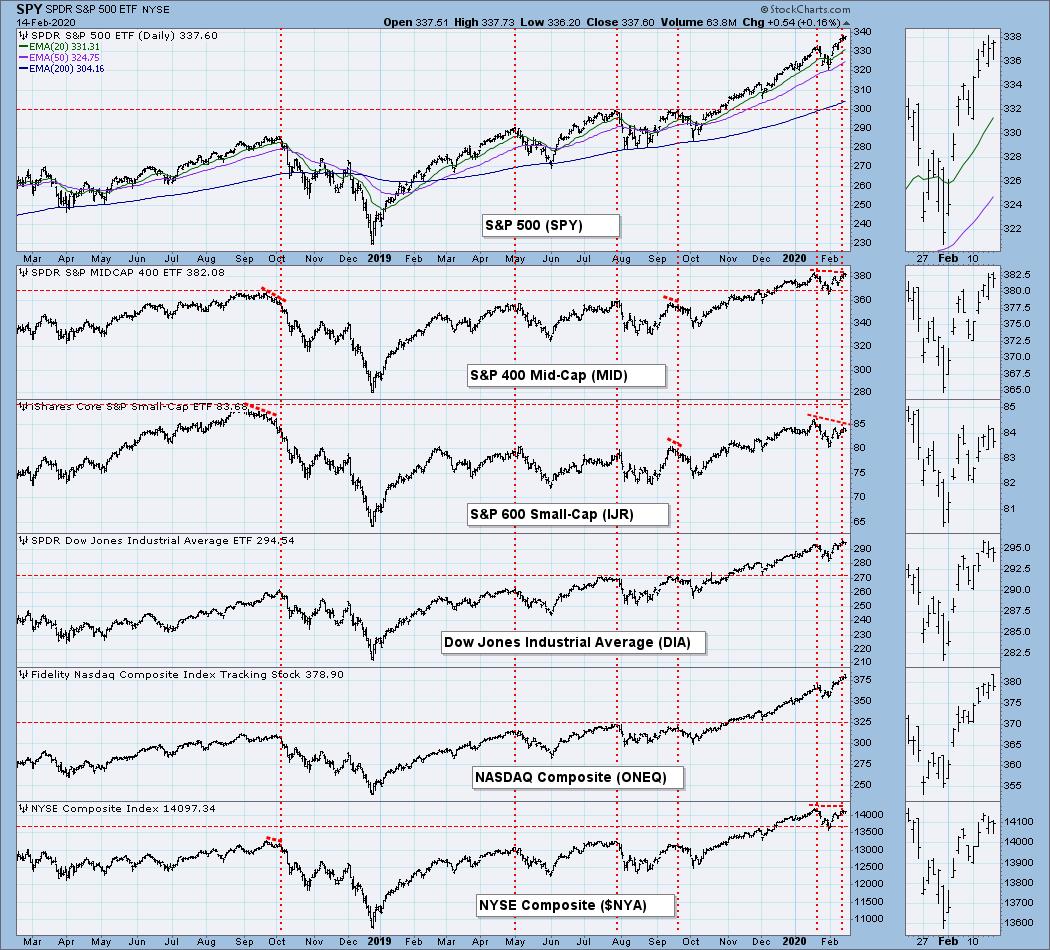
BROAD MARKET INDEXES
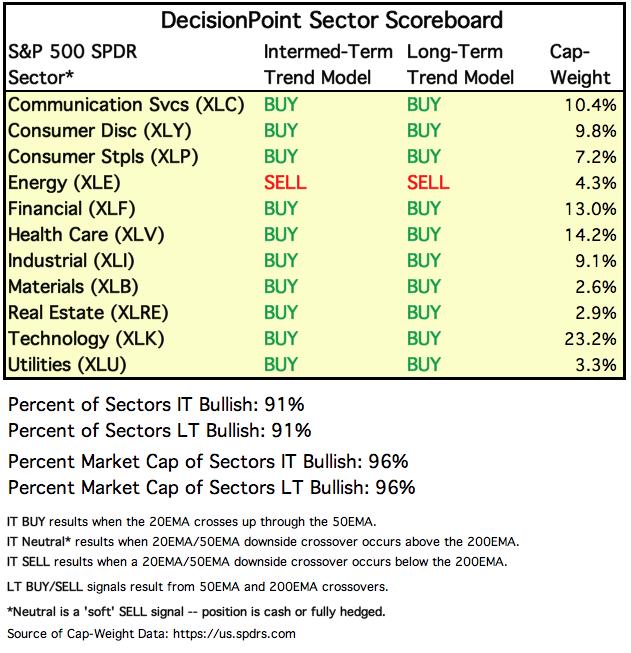
SECTORS
Each S&P 500 Index component stock is assigned to one, and only one, of 11 major sectors. This is a snapshot of the Intermediate-Term (Silver Cross) and Long-Term (Golden Cross) Trend Model signal status for those sectors.
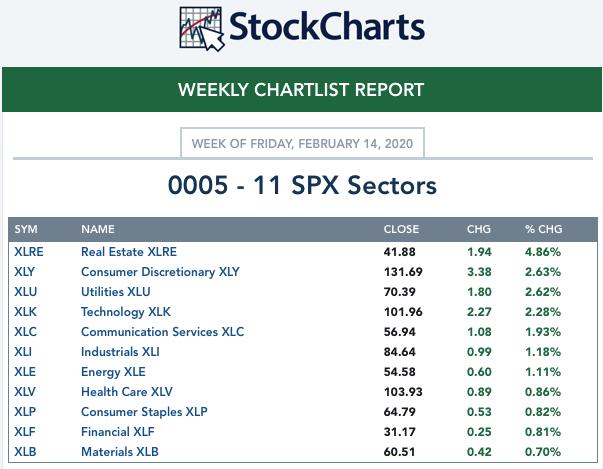
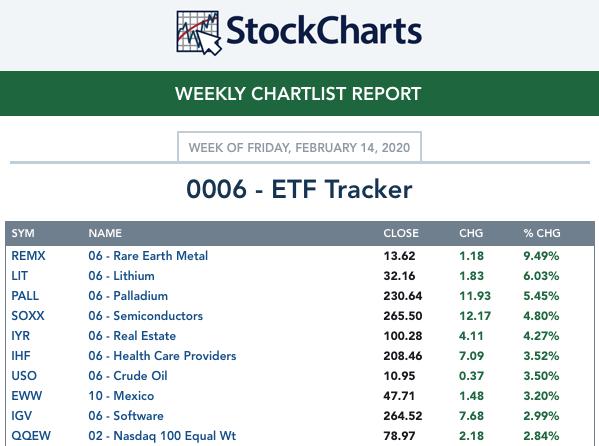
ETF TRACKER: This is a list of about 100 ETFs intended to track a wide range of U.S. market indexes, sectors, global indexes, interest rates, currencies, and commodities. StockCharts.com subscribers can acquire it in the DecisionPoint Trend and Condition ChartPack.
Top 10 . . .
. . . and bottom 10: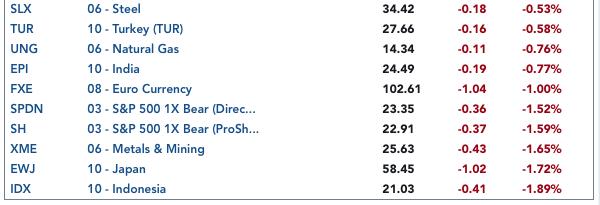
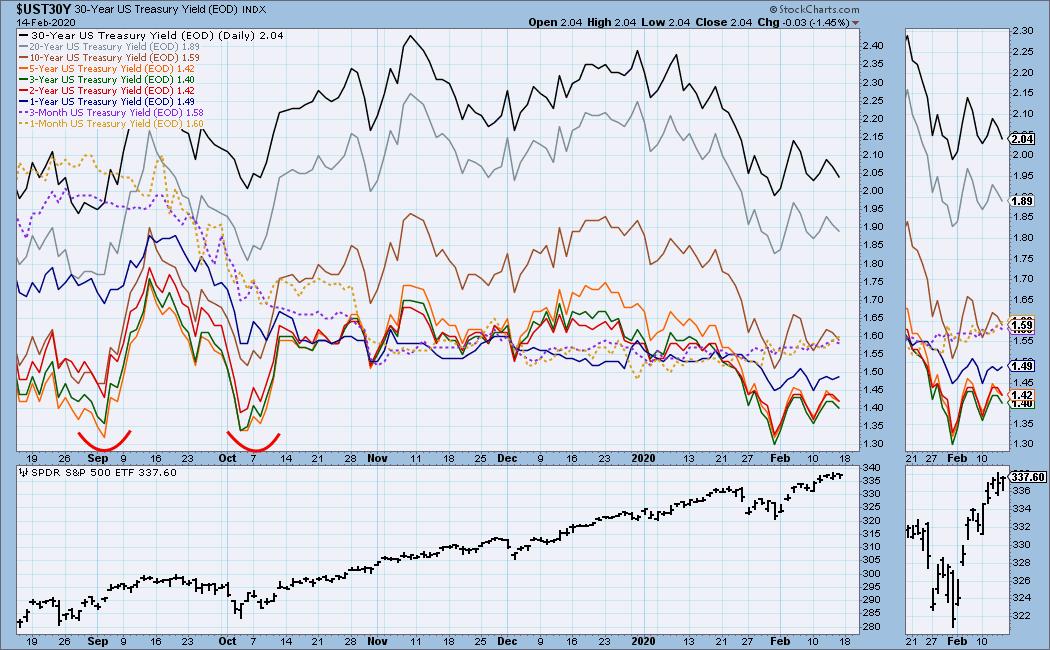
INTEREST RATES
This chart is included so we can monitor rate inversions. In normal circumstances the longer money is borrowed the higher the interest rate that must be paid. When rates are inverted, the reverse is true.
STOCKS
IT Trend Model: BUY as of 9/6/2019
LT Trend Model: BUY as of 2/26/2019
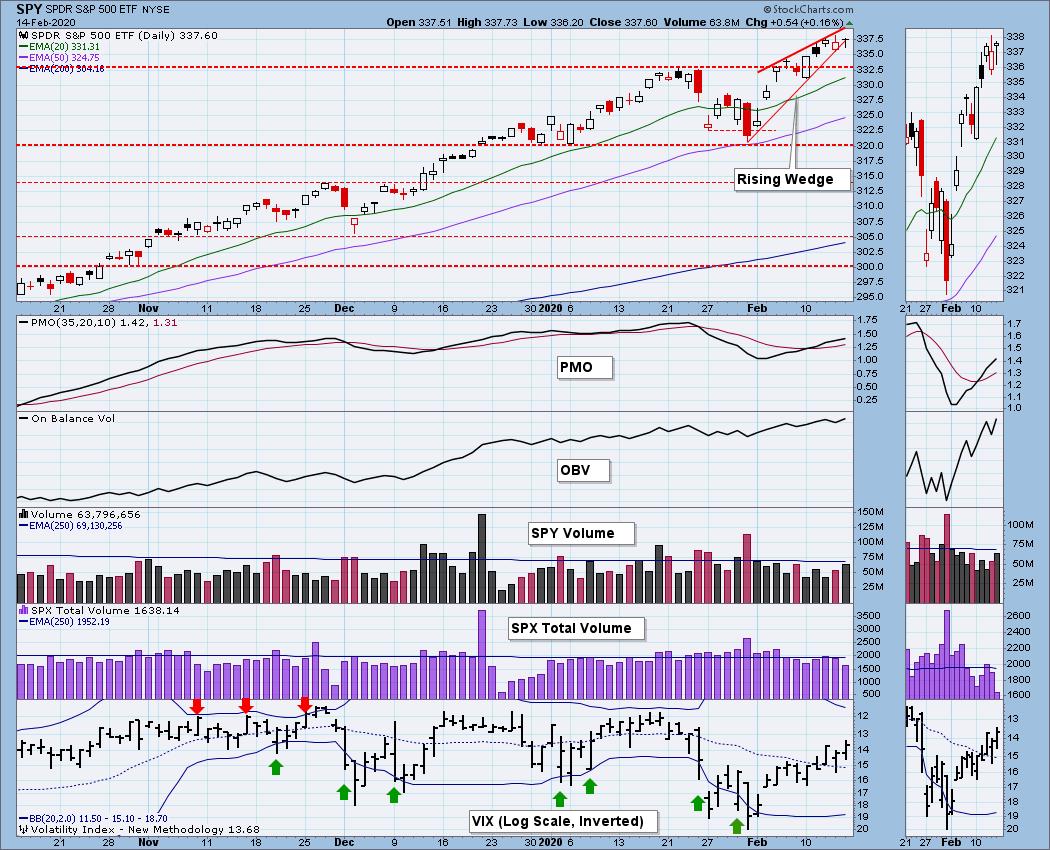
SPY Daily Chart: SPY has been moving higher within a short-term rising wedge pattern, which technically we expect to resolve downward. As you can see, the rising trend line was violated today, but not in a decisive move down, so I consider this to be a flabby resolution, which doesn't prove the rule.
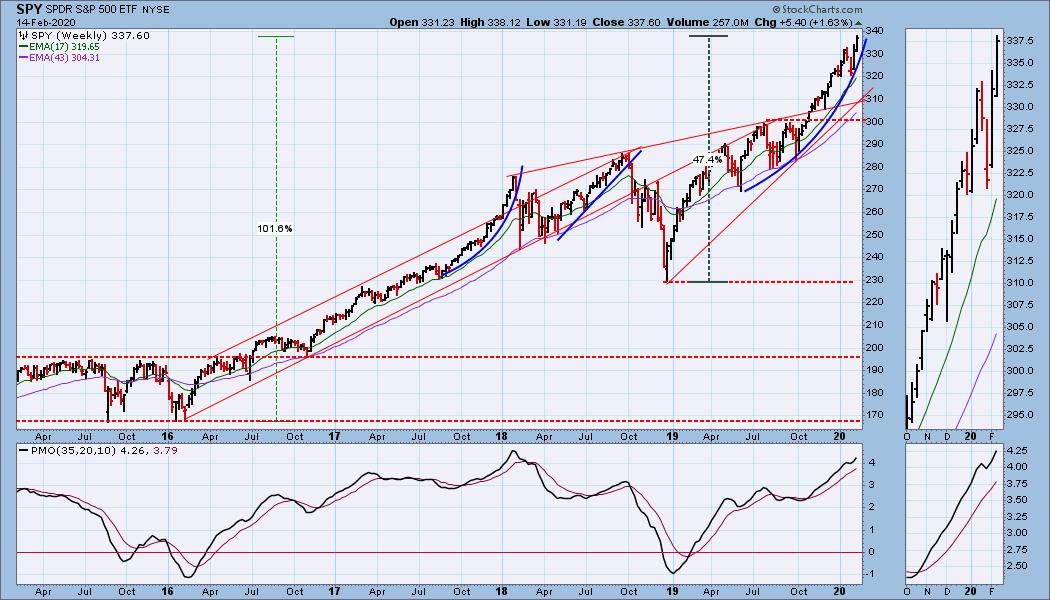
SPY Weekly Chart: There was a small decline two weeks ago that penetrated the parabolic I had drawn. With the market making new highs this week, it was necessary to move the line to the left, and anticipate the parabolic breakdown at sometime in the future.
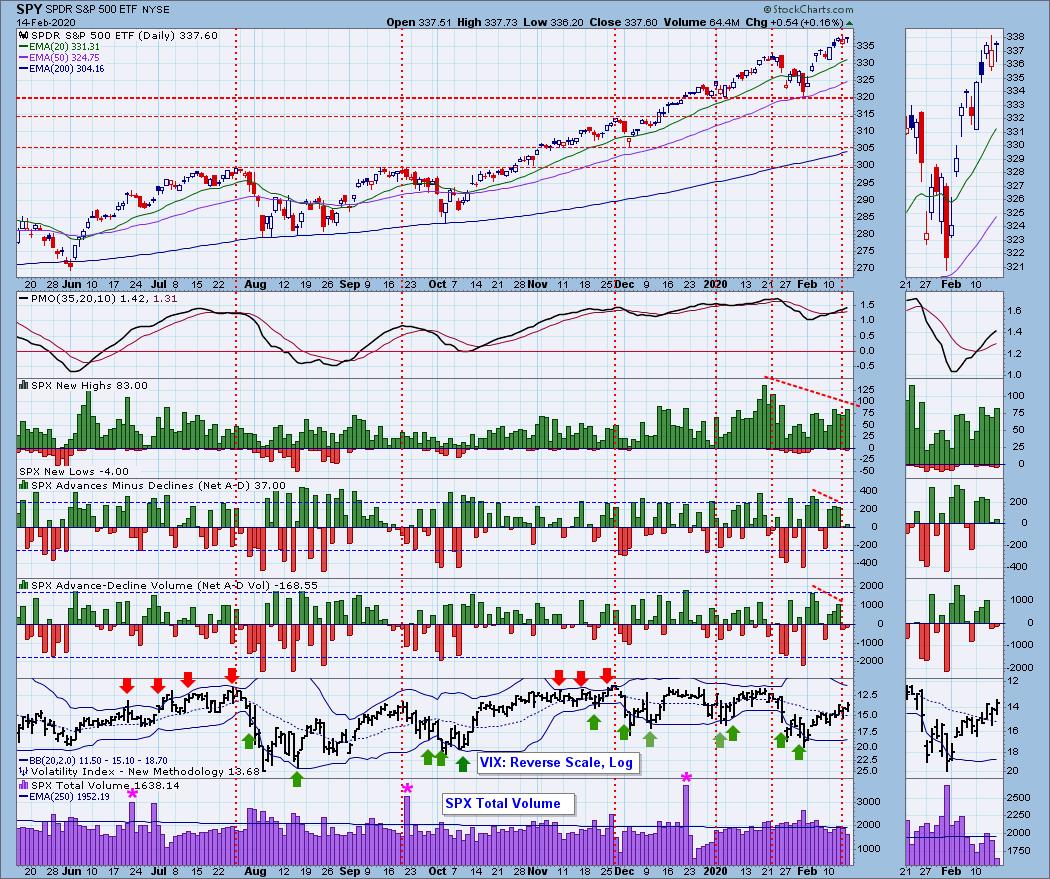
Climactic Market Indicators: I don't see any climactic activity this wewek, but I do see some negative divergences.
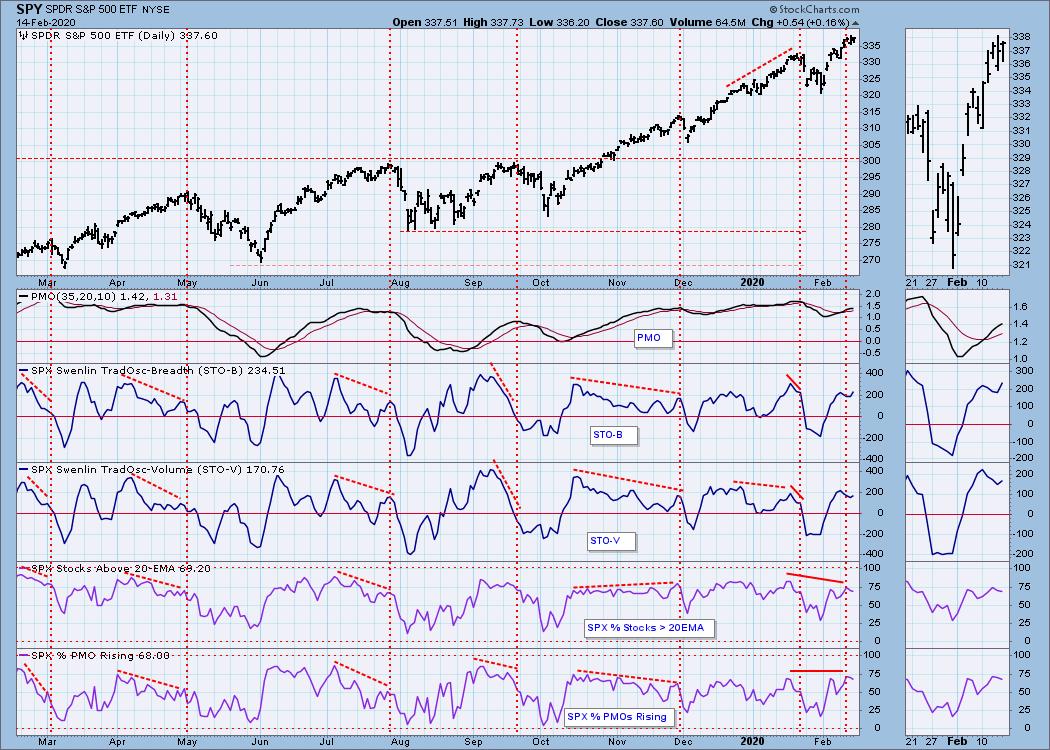
Short-Term Market Indicators: The short-term market trend is UP and the condition is OVERBOUGHT. None of these indicators are at the top of their one-year range, so they can accommodate higher prices.
Intermediate-Term Market Indicators: Even though the rally off the January price low is only two weeks old, I would expect to see similar reaction in the Silver Cross Index, but it is running flat during that sharp advance.
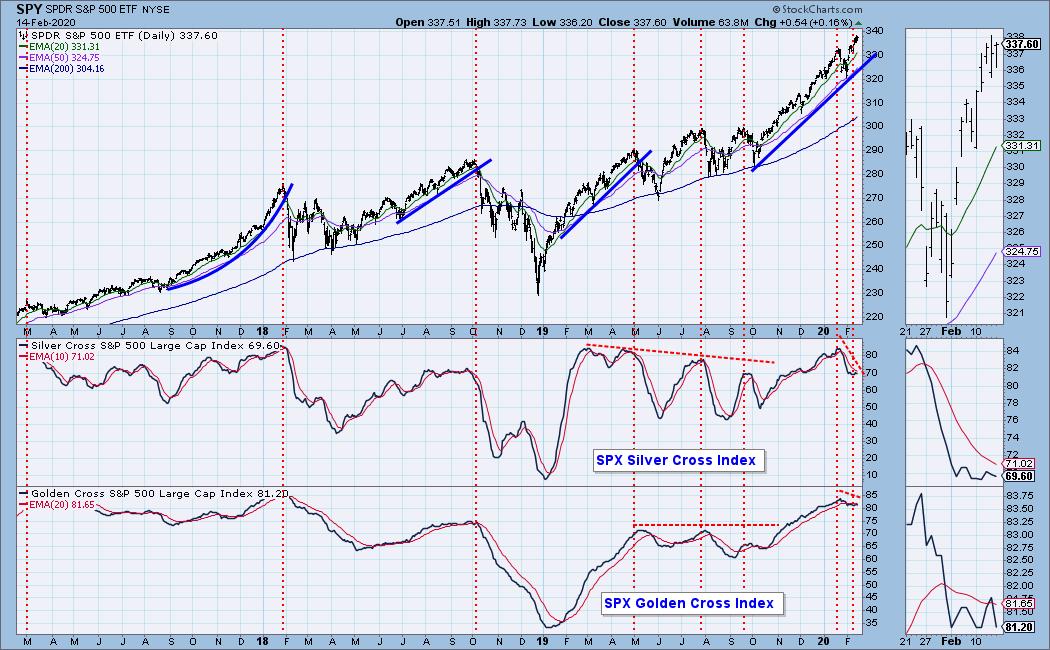
The intermediate-term market trend is UP and the condition is SOMEWHAT OVERBOUGHT. I note some negative divergences in the current indicator readings versus the readings at the January high. Most notable is that the Silver Cross Index has not responded at all to the rally from the January low.
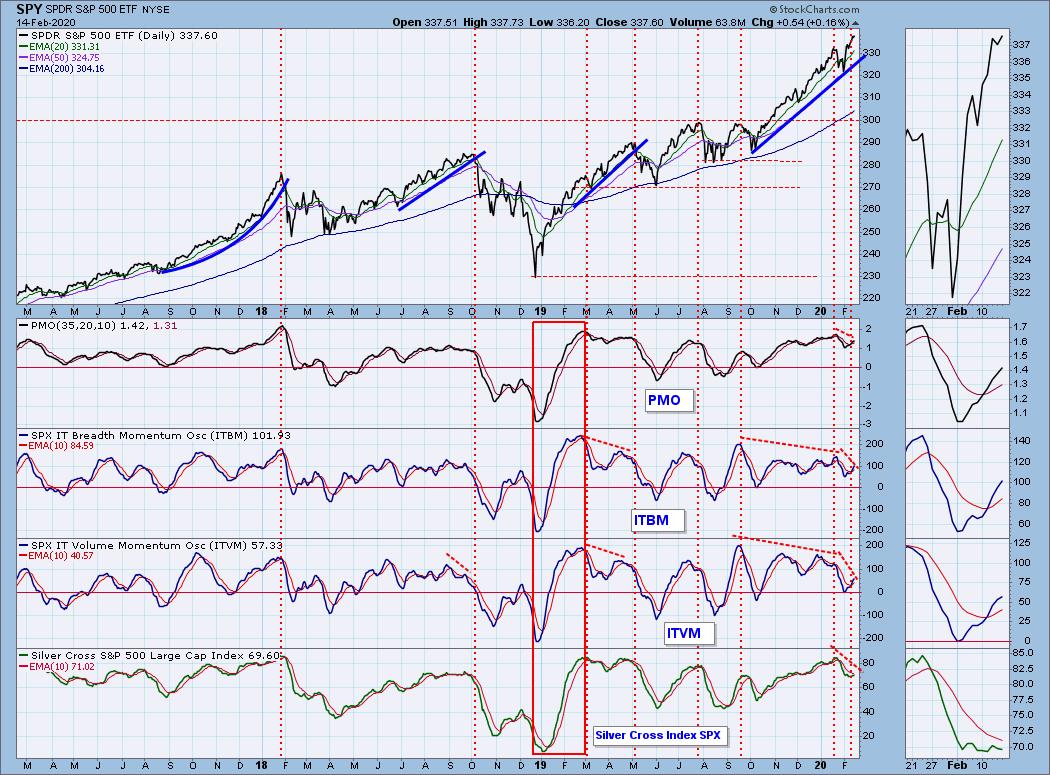
I have put a rectangular box around the indicator surge in early-2019 so as to highlight the smooth, steady move from oversold to overbought that marked the surge that initiated the current cyclical bull market. We will see this again in the future (most likely distant future), and we need to burn this example into our brains.
CONCLUSION: The market trend is UP and the market condition is OVERBOUGHT in both the short- and intermediate-term. The internals in neither time frame are stretched to extreme levels, so a continued rally can be accommodated, but both time frames are in gear with each other (overbought), and relieving overbought conditions by having prices pull back is a reasonable expectation.
Be aware that next week is options expiration. No guarantees, but I normally expect low volatility toward the end of the week. It is not a quadruple-witching expiration, so volume should not be abnormally high.
The U.S. market will be closed Monday for Presidents Day.
Have you subscribed the DecisionPoint Diamonds yet? DP does the work for you by providing handpicked stocks/ETFs from exclusive DP scans! Add it with a discount! Contact support@decisionpoint.com for more information!
DOLLAR (UUP)
IT Trend Model: BUY as of 1/22/2020
LT Trend Model: BUY as of 5/25/2018
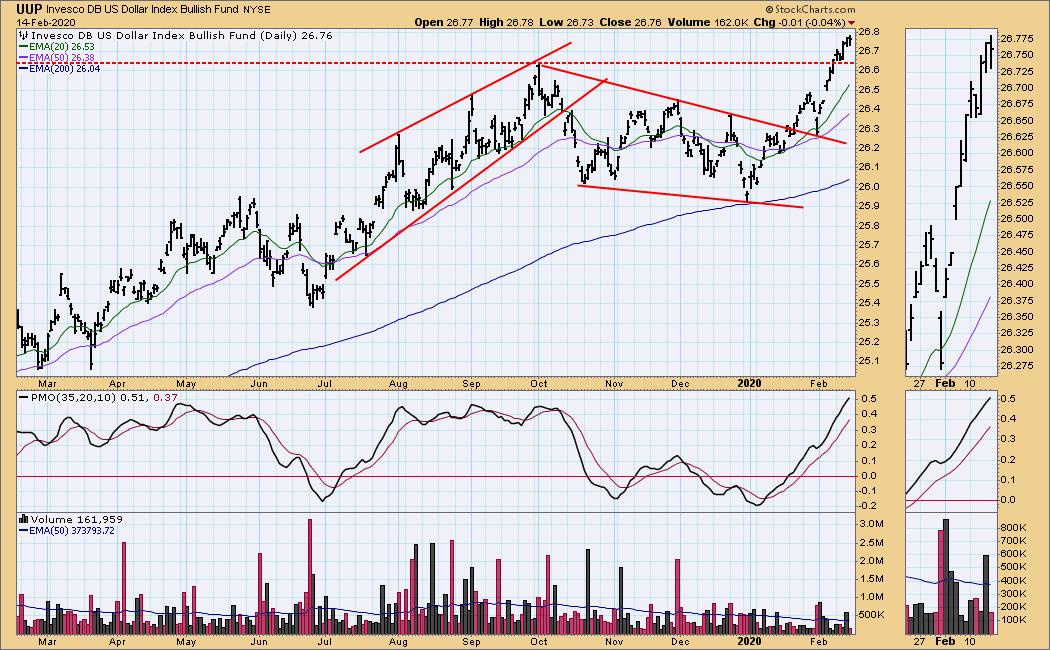
UUP Daily Chart: There was a nice clean breakout this week, but the daily PMO is overbought.
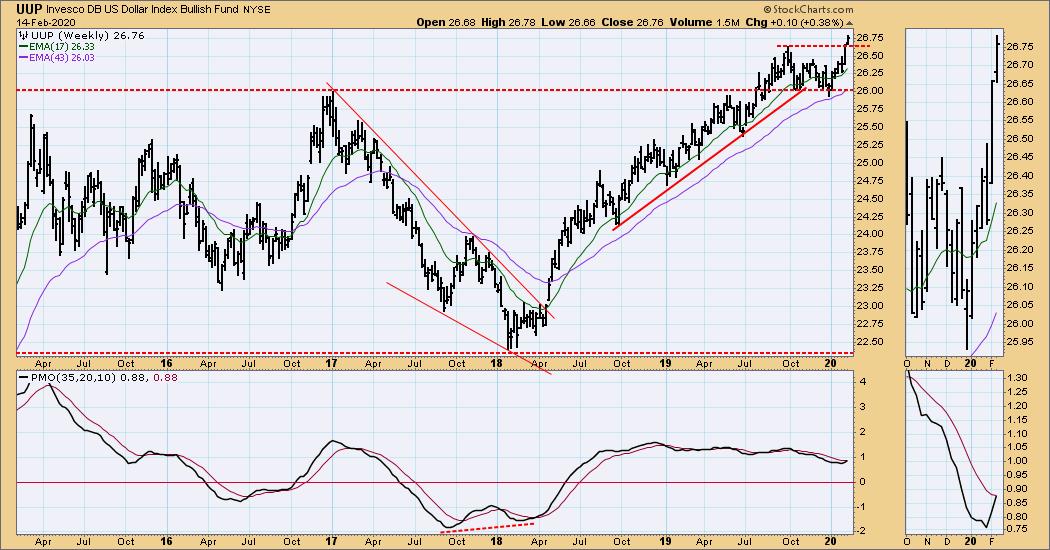
UUP Weekly Chart: The weekly PMO is near the top of last year's range, but it is far from overbought.
GOLD
IT Trend Model: BUY as of 12/26/2019
LT Trend Model: BUY as of 1/8/2019
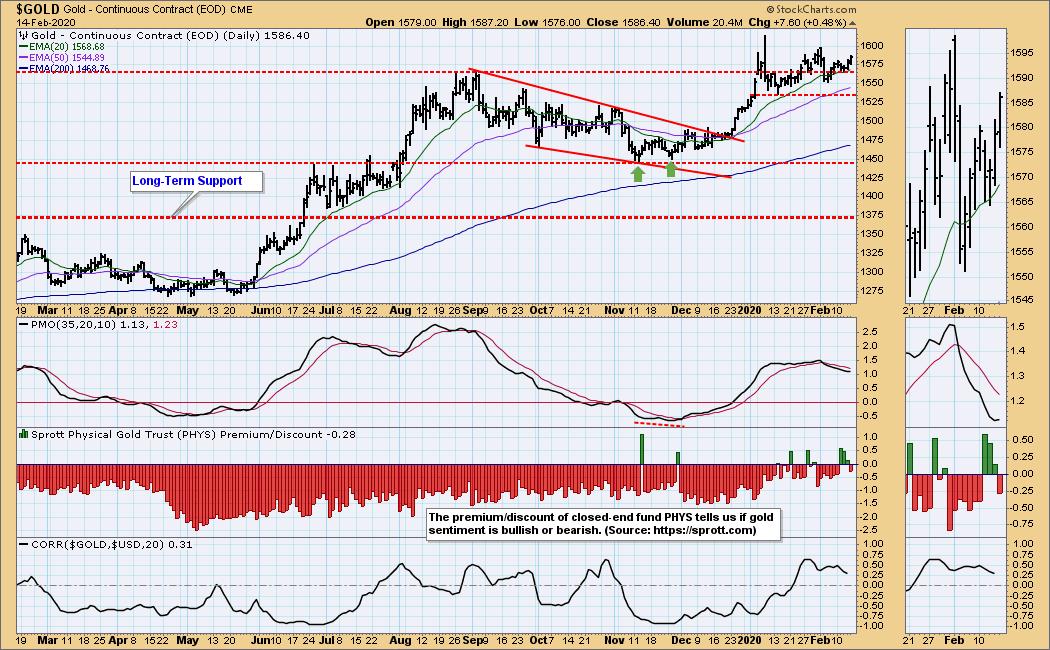
GOLD Daily Chart: Gold continues to consolidate around a line drawn across the September price top, and the daily PMO has turned up.
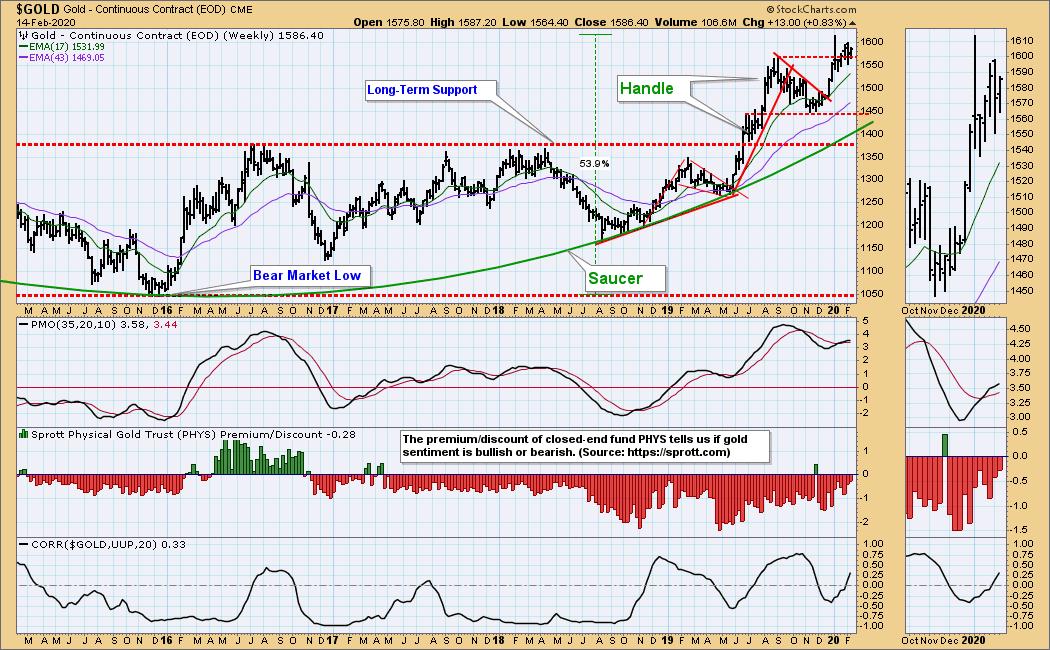
GOLD Weekly Chart: Gold continues to fulfill the bullish expectations of the saucer with handle formation.
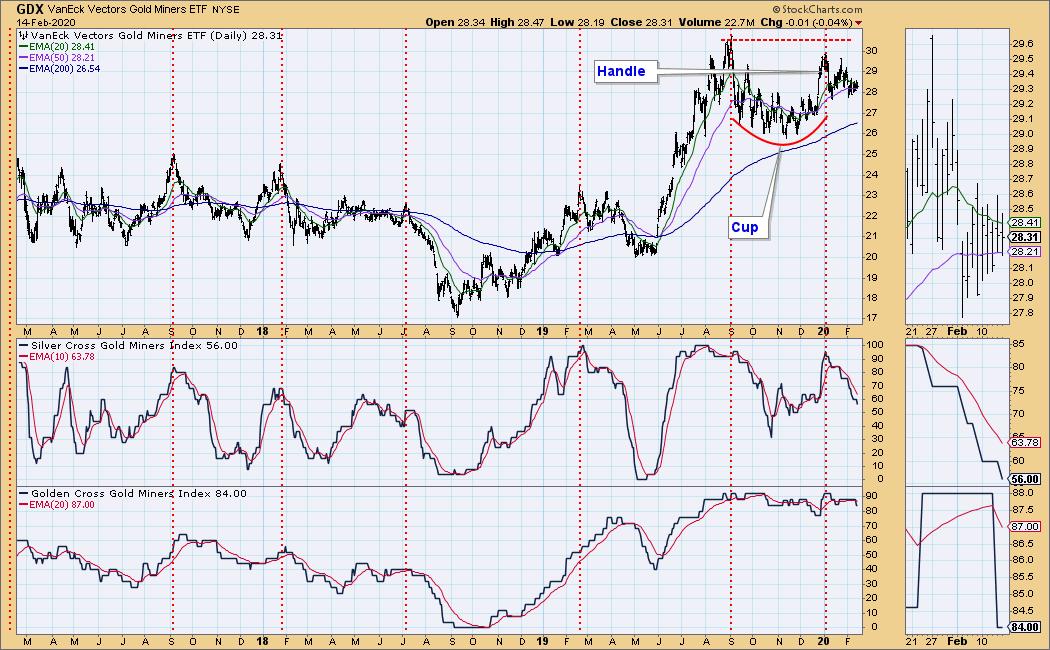
GOLD MINERS Golden and Silver Cross Indexes: The Silver Cross Index continues to get weaker.
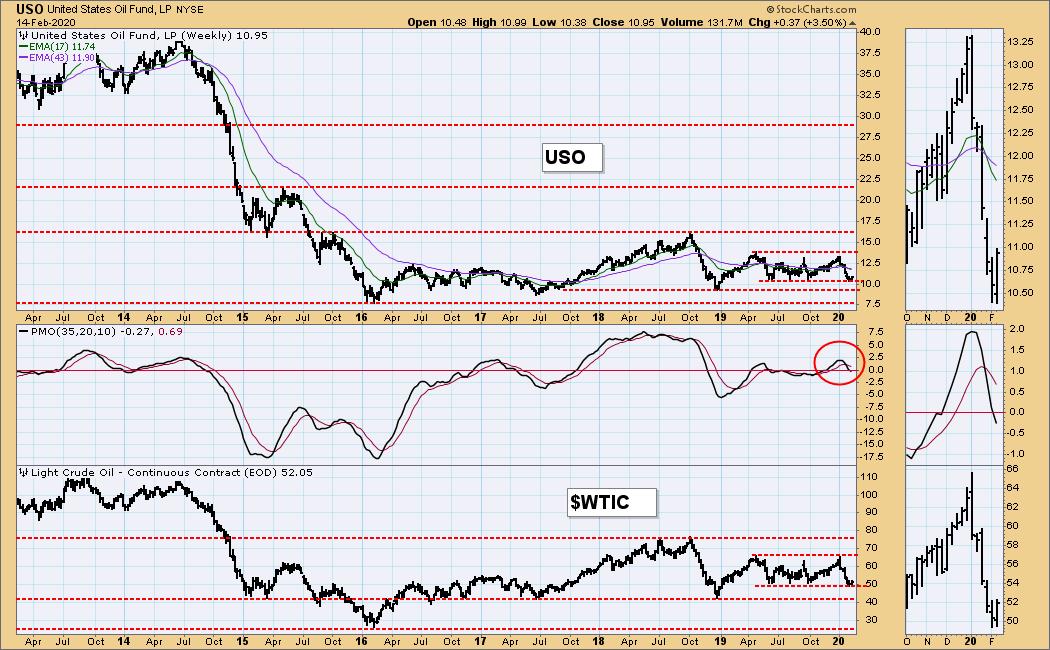
CRUDE OIL (USO)
IT Trend Model: NEUTRAL as of 1/27/2020
LT Trend Model: SELL as of 2/3/2020
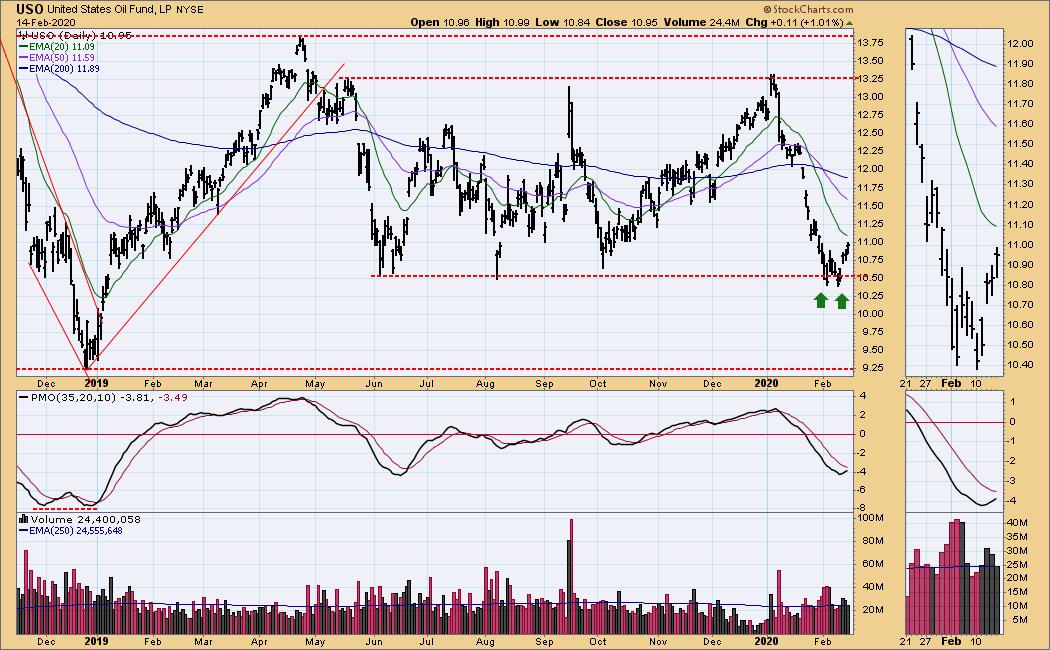
USO Daily Chart: USO has rallied off a double bottom, even though weak demand for crude is expected due to the coronavirus.
USO Weekly Chart: For the present, I am considering that WTIC will be limited to a range of 48 to 66.
BONDS (TLT)
IT Trend Model: BUY as of 1/22/2020
LT Trend Model: BUY as of 1/2/2019
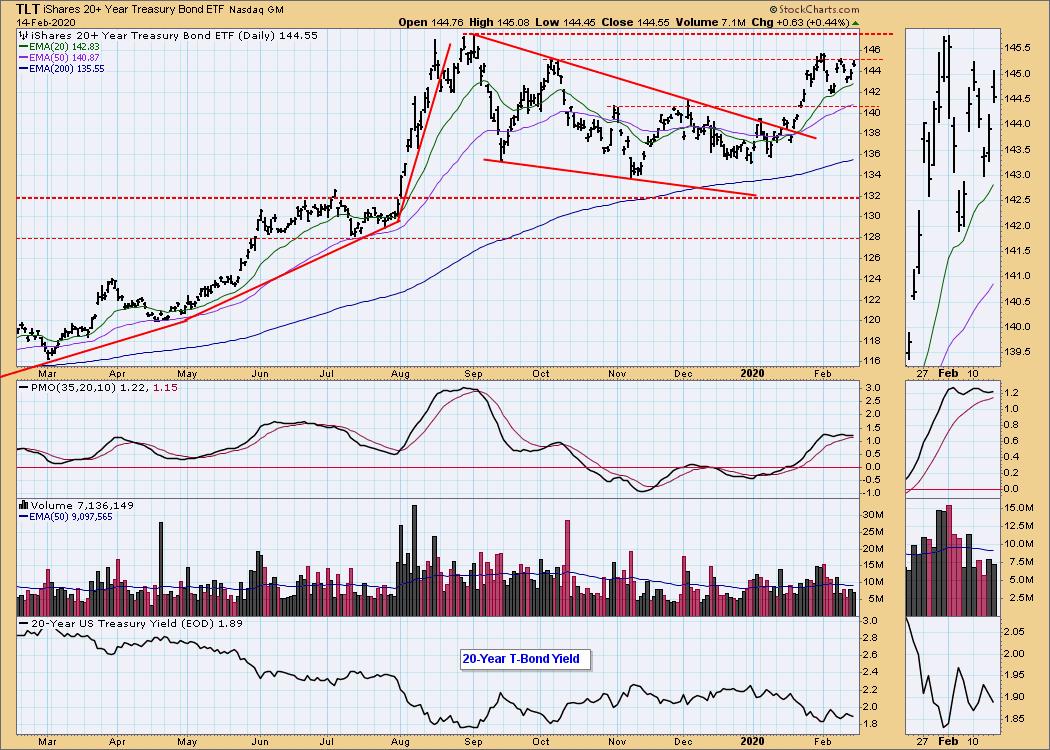
TLT Daily Chart: TLT has been stopped at about 145 for the third time.
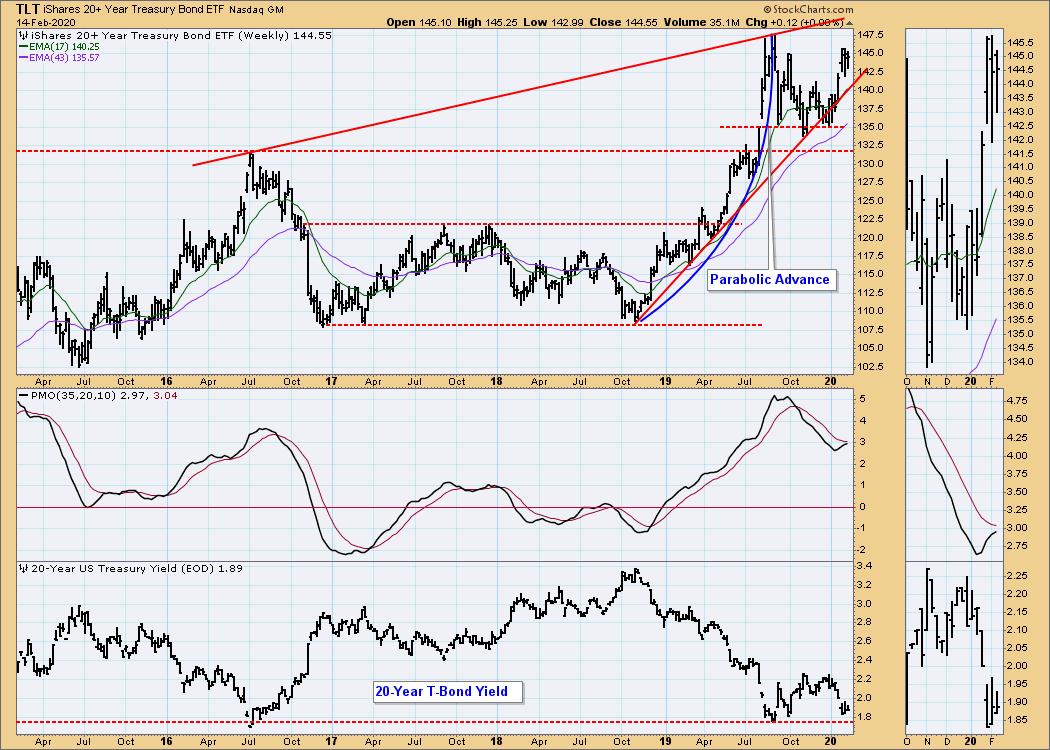
TLT Weekly Chart: The 20-year bond yield is close to a five-year low. I think that support at that level will limit TLT from rallying past the September high.
Technical Analysis is a windsock, not a crystal ball.
Happy Charting! - Carl
NOTE: The signal status reported herein is based upon mechanical trading model signals, specifically, the DecisionPoint Trend Model. They define the implied bias of the price index based upon moving average relationships, but they do not necessarily call for a specific action. They are information flags that should prompt chart review. Further, they do not call for continuous buying or selling during the life of the signal. For example, a BUY signal will probably (but not necessarily) return the best results if action is taken soon after the signal is generated. Additional opportunities for buying may be found as price zigzags higher, but the trader must look for optimum entry points. Conversely, exit points to preserve gains (or minimize losses) may be evident before the model mechanically closes the signal.
Helpful DecisionPoint Links:
DecisionPoint Alert Chart List
DecisionPoint Golden Cross/Silver Cross Index Chart List
DecisionPoint Sector Chart List
Price Momentum Oscillator (PMO)
Swenlin Trading Oscillators (STO-B and STO-V)