
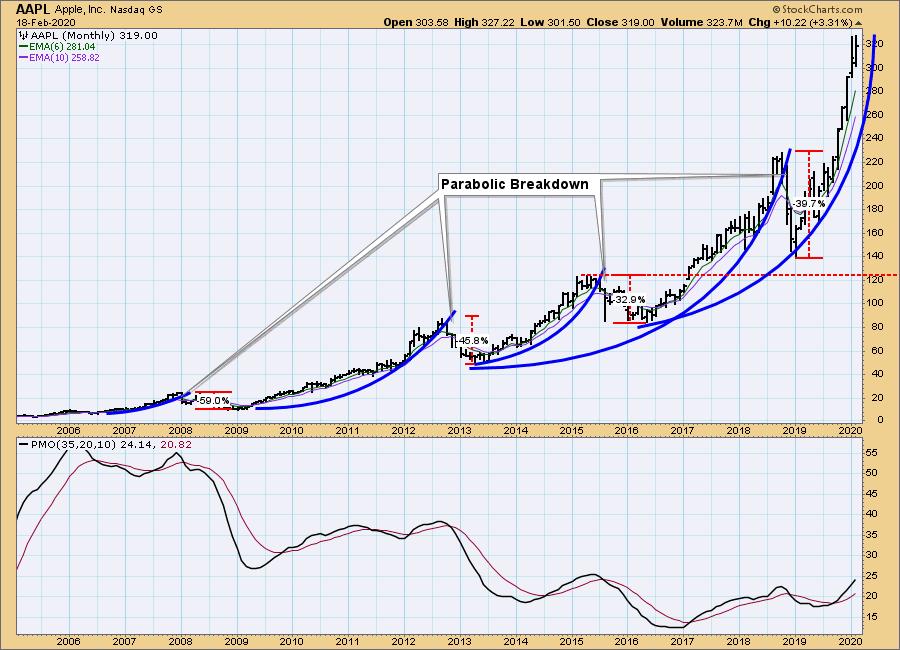
Apple has been blamed for today's decline in most of the markets. According to CNBC.com, here's why:
"Apple cautioned it does not expect to meet its quarterly revenue forecast, citing slowed production and weakened demand in China as a result of the coronavirus outbreak. The most valuable company in the U.S. initially said it expected to report net sales between $63 billion to $67 billion in its fiscal second quarter. Apple also finished the session well off its lows of the day, closing 1.8% lower."
Carl has been watching the Apple monthly chart for some time. Apple tends to travel in parabolic moves that end in big declines. I can't say that today begins the parabolic breakdown, but it should make you alert regarding your stop.
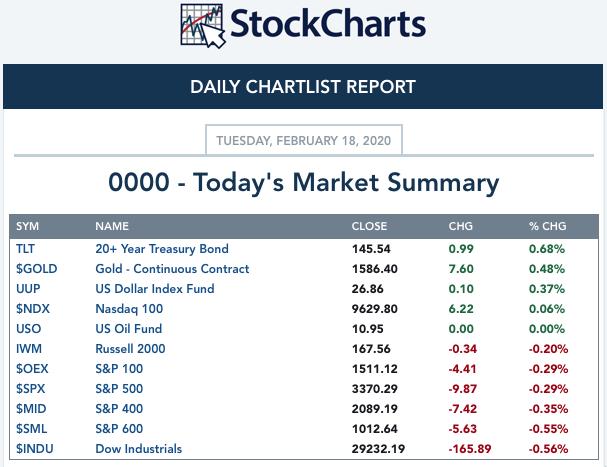
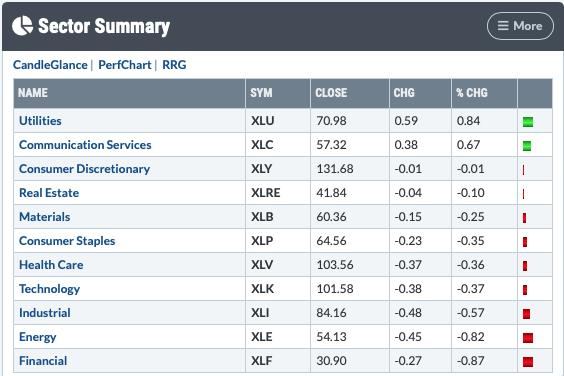
TODAY'S Broad Market Action:
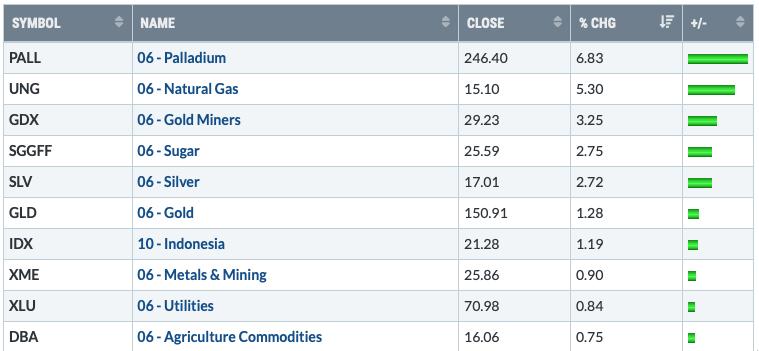
Top 10 from ETF Tracker:
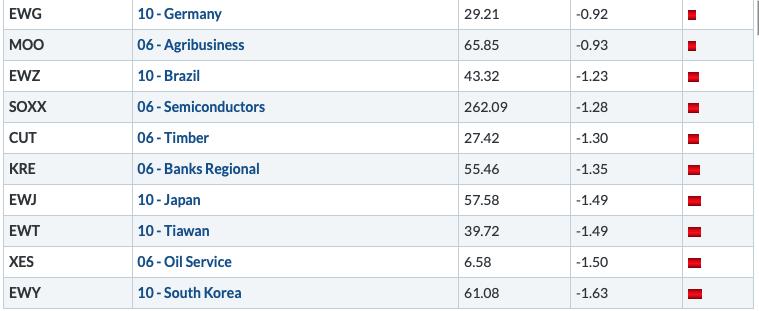
Bottom 10 from ETF Tracker:
On Friday, the DecisionPoint Alert Weekly Wrap presents an assessment of the trend and condition of the stock market (S&P 500), the U.S. Dollar, Gold, Crude Oil, and Bonds. Monday through Thursday the DecisionPoint Alert daily report is abbreviated and covers changes for the day.
Watch the latest episode of DecisionPoint on StockCharts TV's YouTube channel here!
SECTORS
SIGNALS:
Each S&P 500 Index component stock is assigned to one, and only one, of 11 major sectors. This is a snapshot of the Intermediate-Term (Silver Cross) and Long-Term (Golden Cross) Trend Model signal status for those sectors.
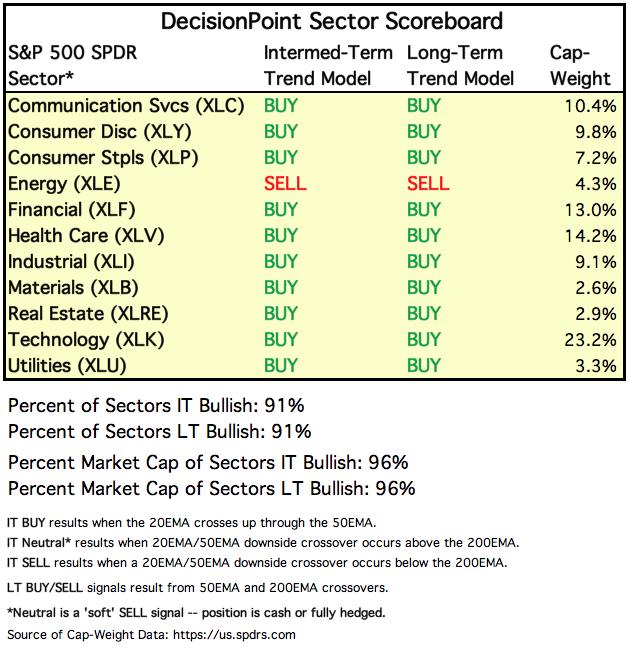
TODAY'S RESULTS:
STOCKS
IT Trend Model: BUY as of 9/6/2019
LT Trend Model: BUY as of 2/26/2019
SPY Daily Chart: With today's decline, a short-term rising wedge executed. The expectation is a breakdown about the height of the back of the pattern. That would put price right around the top from the last week of January.
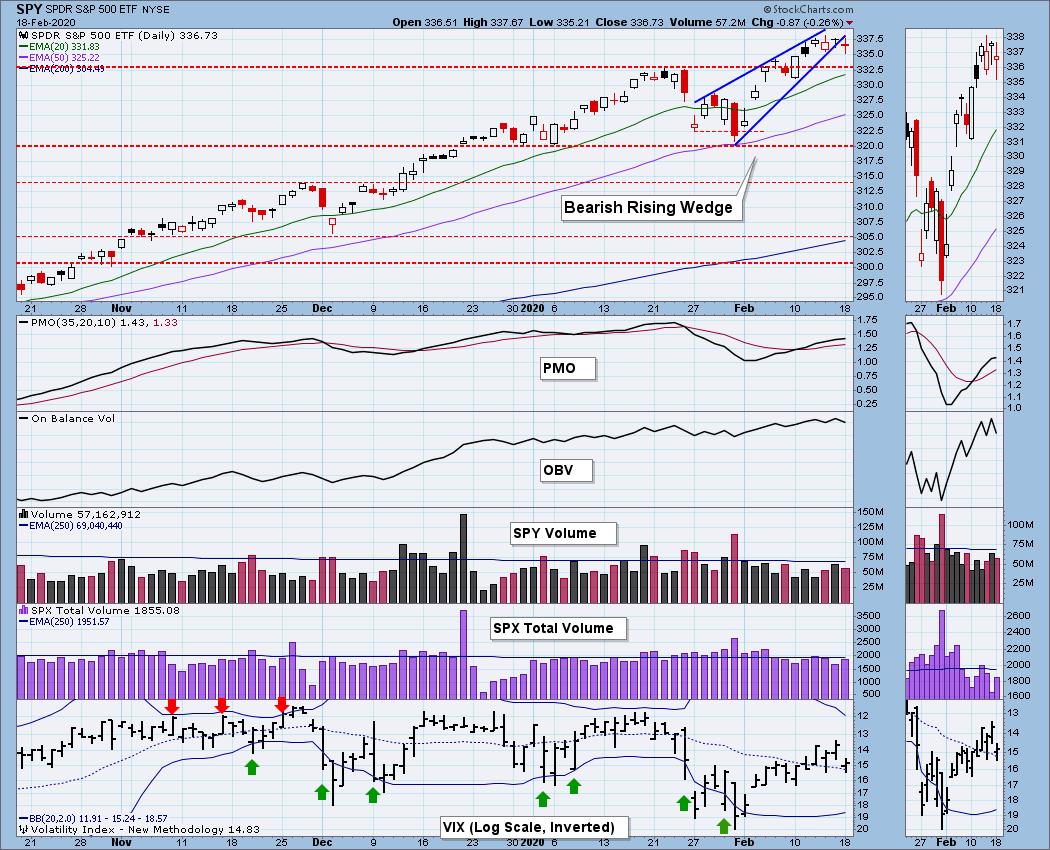
Climactic Market Indicators: New Highs continue to be elevated, but nothing else climactic to report here. The VIX remains in the center of the Bollinger Bands so it isn't really helpful.
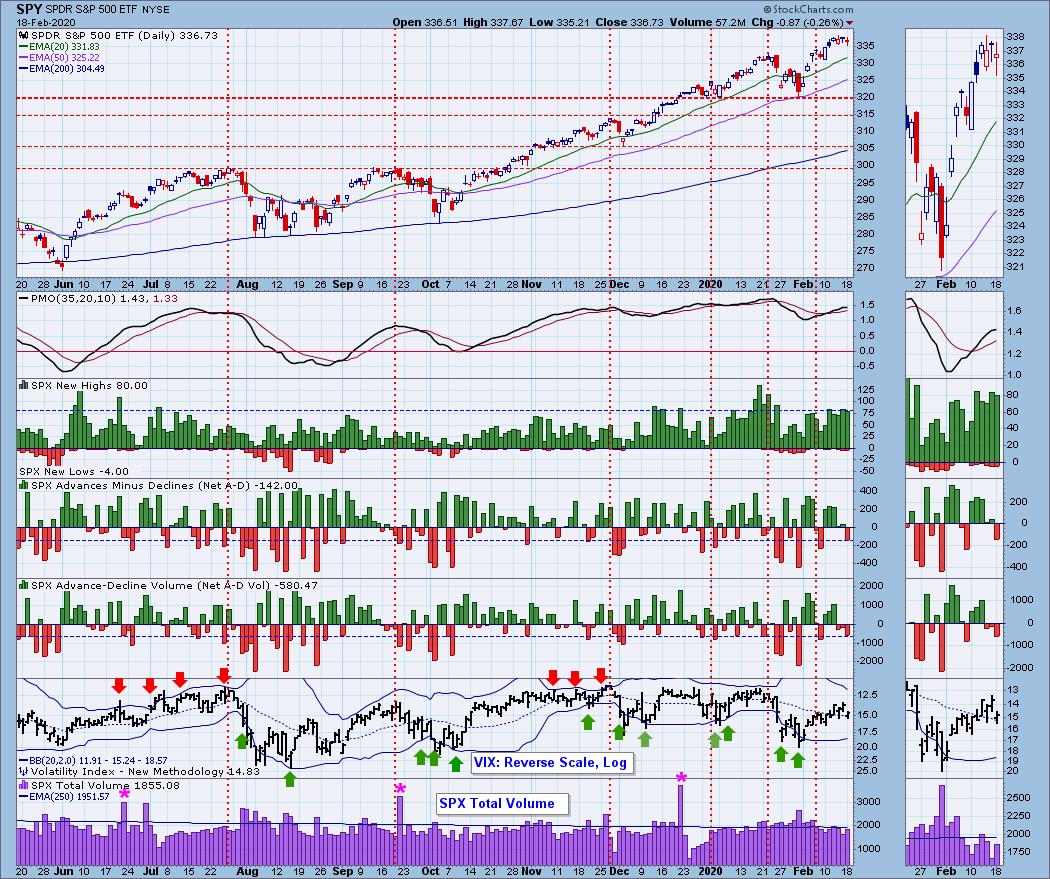
Short-Term Market Indicators: The STOs continue to decline and now it appears price is ready to join in with a decline.
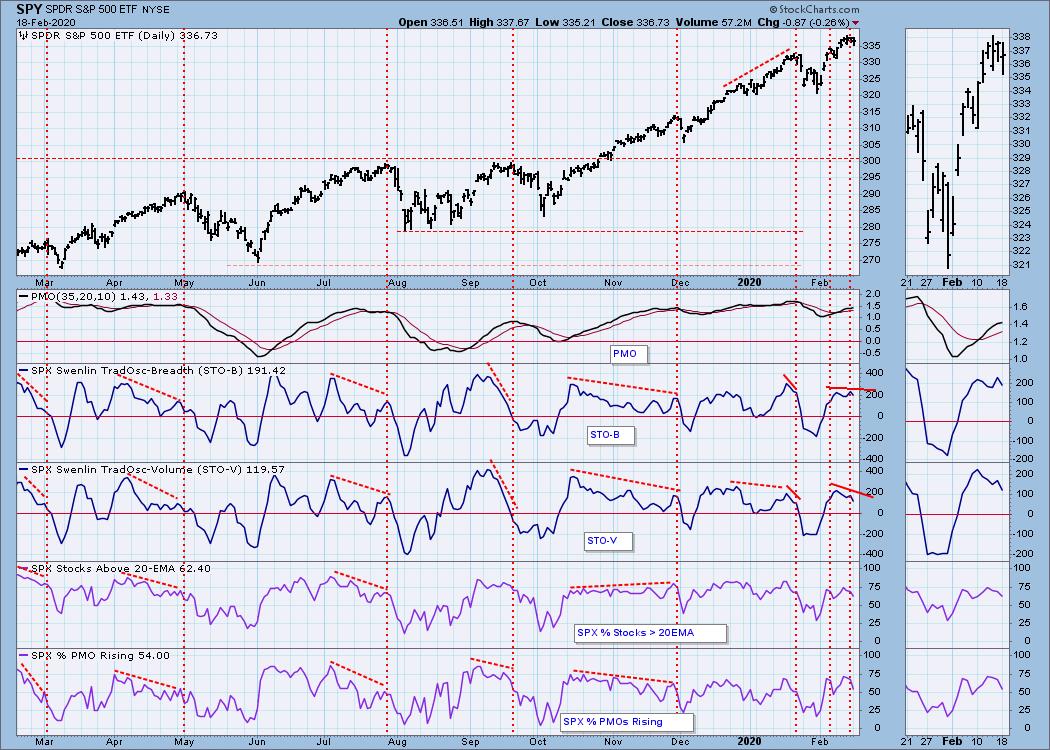
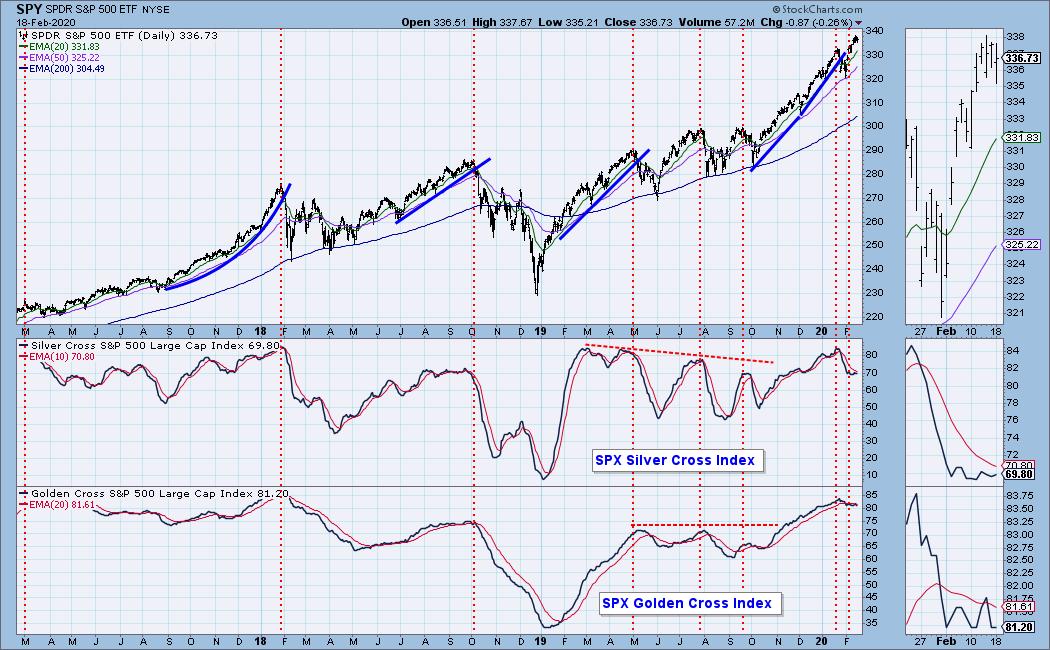
Intermediate-Term Market Indicators: The Silver Cross Index (% of SPX stocks 20EMA > 50EMA) and the Golden Cross Index (percent of SPX stocks 50EMA > 200EMA) are flattening. They may be trying to bottom here and that would be positive for the market in general.
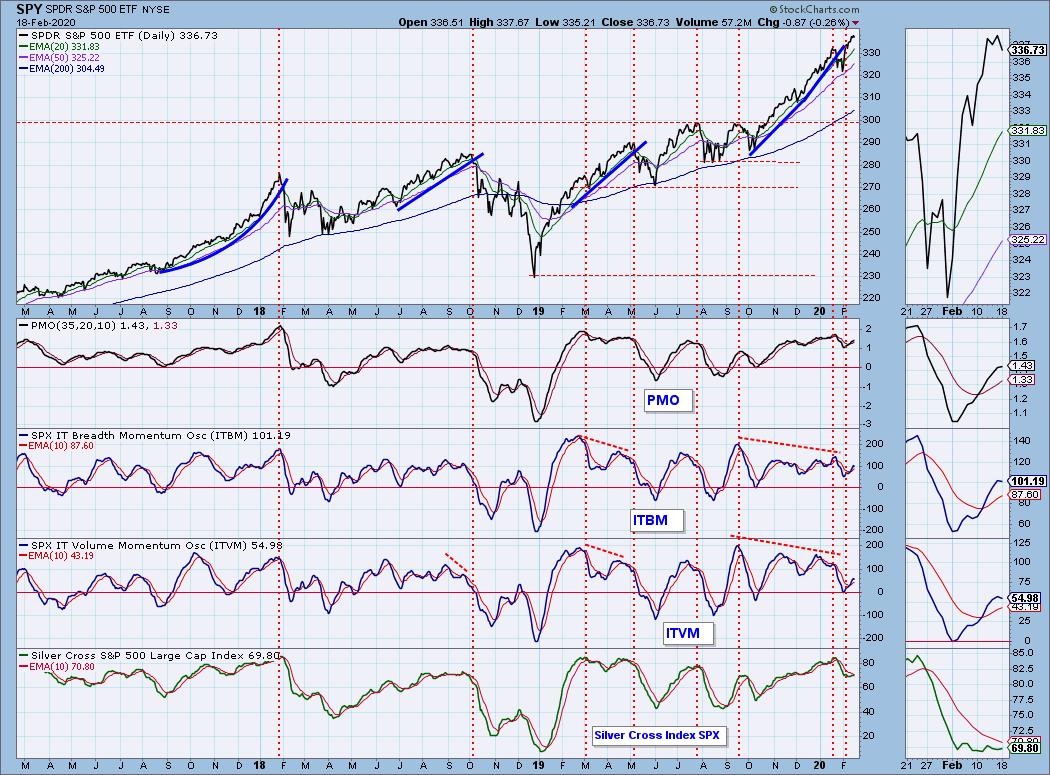
The IT trend is UP and the market condition is NEUTRAL based upon the ITBM and ITVM readings, and SOMEWHAT OVERBOUGHT based upon the PMO and Silver Cross/Golden Cross Index readings. Based on our indicators, the intermediate term is still looking good. I want to see improvement on the SCI. Right now it's somewhat directionless.
CONCLUSION: The ST and IT trend are UP. Market condition based on ST and IT indicators is NEUTRAL to MODERATELY OVERBOUGHT. The short-term rising wedge executed on the SPY and suggests to me a few more days of decline. I think the market is more vulnerable to the coronavirus news. Apple is a good example.
(Not a Diamonds subscriber? Add it to your DP Alert subscription and get a discount! Contact support@decisionpoint.com for your limited time coupon code!)
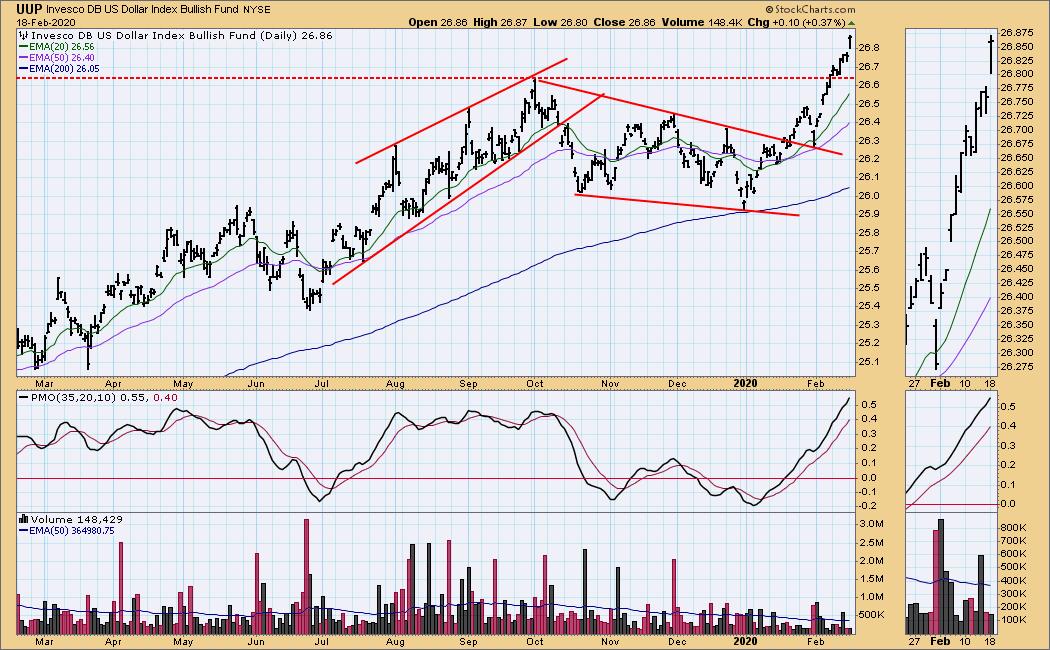
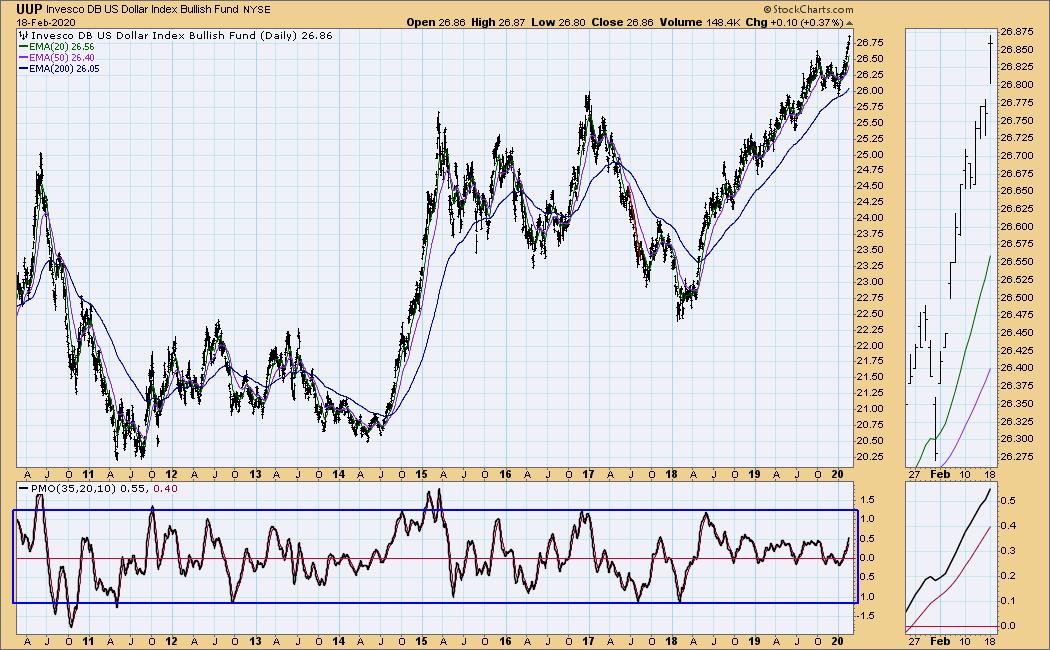
DOLLAR (UUP)
IT Trend Model: BUY as of 1/22/2020
LT Trend Model: BUY as of 5/25/2018
UUP Daily Chart: Boom! Big breakout today as UUP gapped up. The PMO looks extremely overbought right now. I decided to take a look at a long-term daily chart to see what the 'typical' range is for the PMO on UUP and believe it or not it really isn't that overbought. Overall I expect the Dollar to continue to rise.
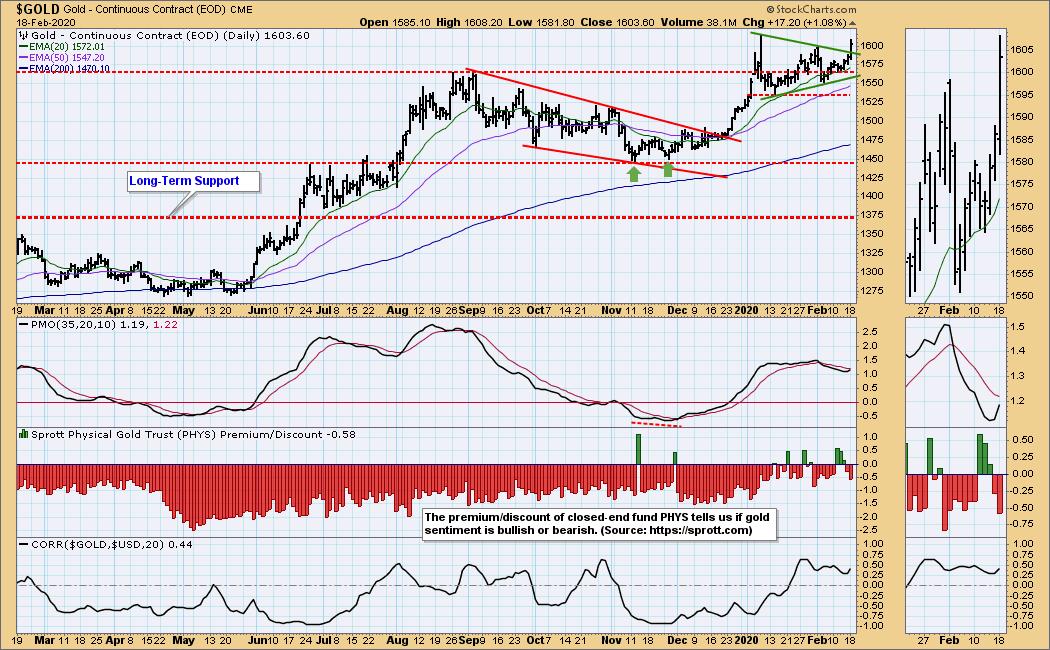
GOLD
IT Trend Model: BUY as of 12/26/2019
LT Trend Model: BUY as of 1/8/2019
GOLD Daily Chart: I've been watching the symmetrical triangle on Gold with the expectation of an upside breakout. It executed beautifully today. The PMO is rising now and is only moderately overbought. The next hurdle will be the January intraday high.
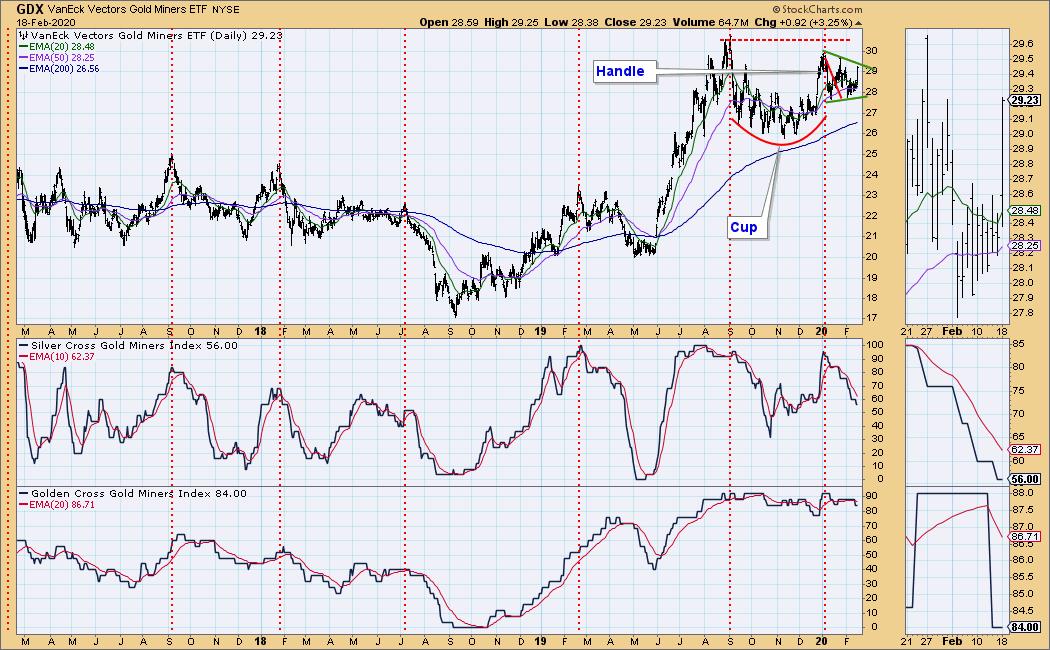
GOLD MINERS Golden and Silver Cross Indexes: Metals and Materials rose nicely today and consequently the Gold Miners rallied strongly. I'm looking for an upside breakout from the symmetrical triangle/handle, but we need the SCI to at least begin rising again.
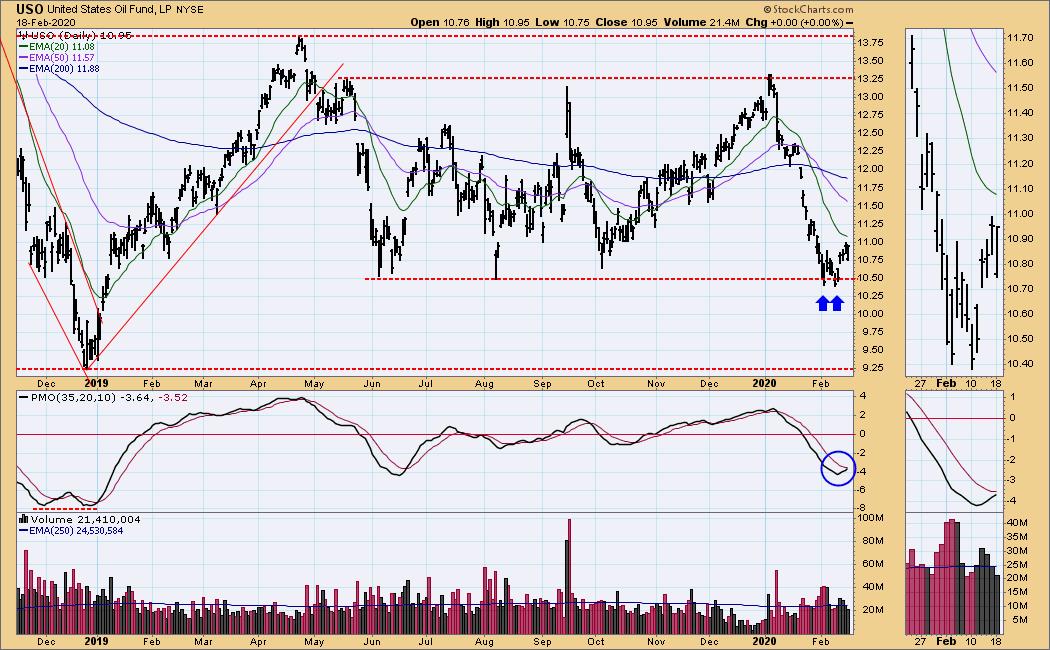
CRUDE OIL (USO)
IT Trend Model: Neutral as of 1/27/2020
LT Trend Model: BUY as of 12/16/2019
USO Daily Chart: The PMO continues to rise on USO. It appeared it would close lower on the day, but it managed to eke out a close on today's high, leaving USO unchanged on the day. Volume is certainly coming in, but it is now beginning to decline. With the coronavirus disrupting China's supply/demand, I suspect the 20-EMA is going to be problem resistance.
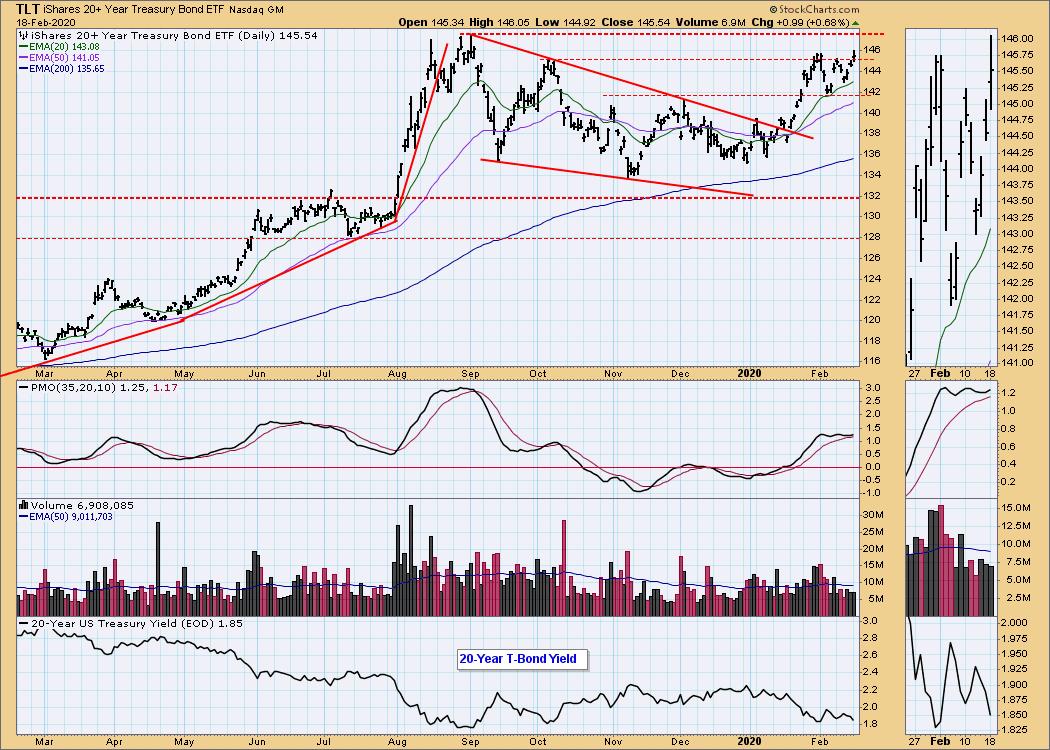
BONDS (TLT)
IT Trend Model: BUY as of 1/22/2020
LT Trend Model: BUY as of 1/2/2019
TLT Daily Chart: Instead of a short-term double-top, it turned into a consolidation zone. The PMO is attempting to rise again and price nearly closed above the January top. I'm looking for a test of the August/September highs.
Have you subscribed the DecisionPoint Diamonds yet? DP does the work for you by providing handpicked stocks/ETFs from exclusive DP scans! Add it with a discount! Contact support@decisionpoint.com for more information!
Technical Analysis is a windsock, not a crystal ball.
Happy Charting! - Erin
Email: erin@decisionpoint.com

Erin Swenlin will be presenting at the The MoneyShow Las Vegas May 11-13, 2020! You'll have an opportunity to meet Erin and discuss the latest DecisionPoint news and Diamond Scans. The conference is free to attend or view online!
NOTE: The signal status reported herein is based upon mechanical trading model signals, specifically, the DecisionPoint Trend Model. They define the implied bias of the price index based upon moving average relationships, but they do not necessarily call for a specific action. They are information flags that should prompt chart review. Further, they do not call for continuous buying or selling during the life of the signal. For example, a BUY signal will probably (but not necessarily) return the best results if action is taken soon after the signal is generated. Additional opportunities for buying may be found as price zigzags higher, but the trader must look for optimum entry points. Conversely, exit points to preserve gains (or minimize losses) may be evident before the model mechanically closes the signal.
Helpful DecisionPoint Links (Can Be Found on DecisionPoint.com Links Page):
DecisionPoint Shared ChartList and DecisionPoint Chart Gallery
Price Momentum Oscillator (PMO)
Swenlin Trading Oscillators (STO-B and STO-V)