
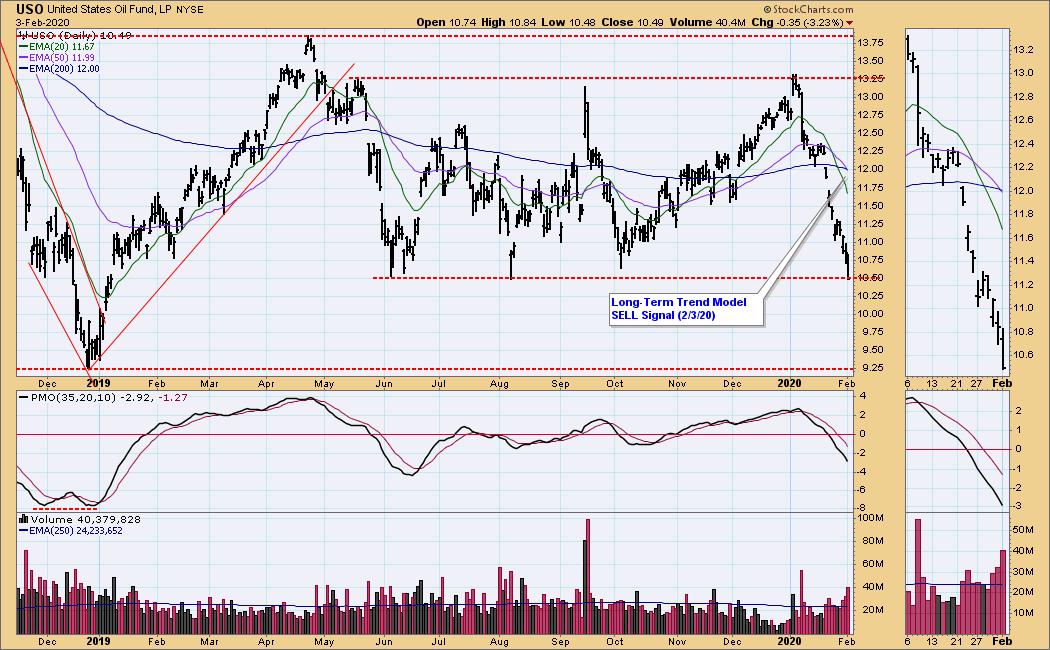
USO triggered a Long-Term Trend Model SELL signal today as the 50-EMA crossed below the 200-EMA. On today's "DecisionPoint" show, Carl and I talked about the possible effects of the coronavirus on global markets and particularly on oil prices. China has indicated that it will be lowering its demand for oil as they battle the virus. Additionally, OPEC has been attempting to squeeze supply in order to bring oil prices higher.
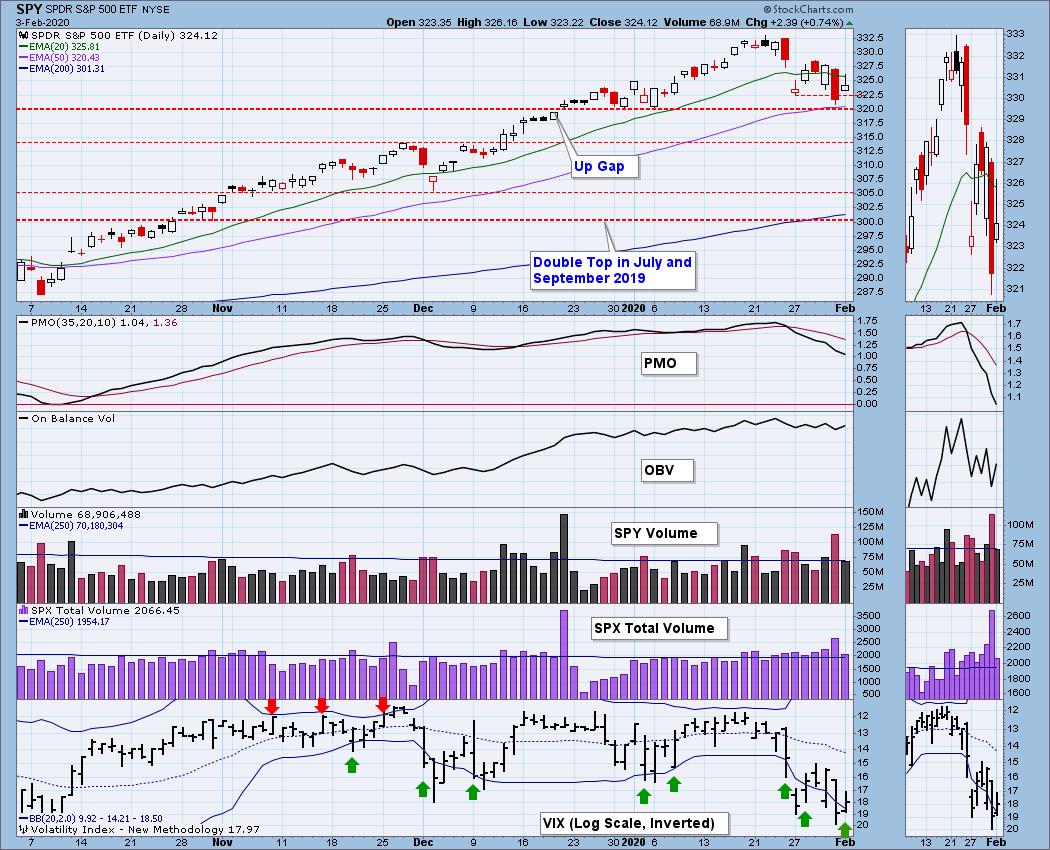
Last Friday, Carl identified two areas of support that have the best chance of holding up. First is where we saw the gap up after the breakout in December around 320. So far that level is holding up. While there are other areas of support available, we agree that the 300 level is likely the strongest. Not to say it will be diving in to go test that area tomorrow, mainly, it gives us guidance if 320 doesn't hold.
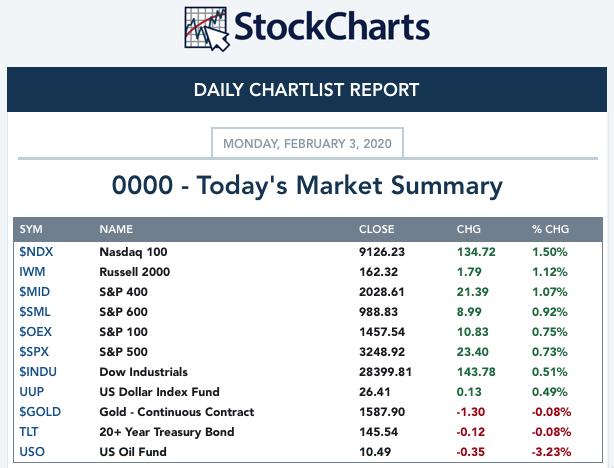
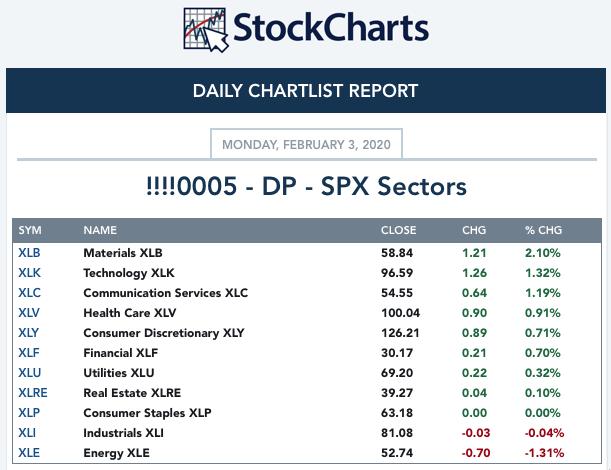
TODAY'S Broad Market Action:
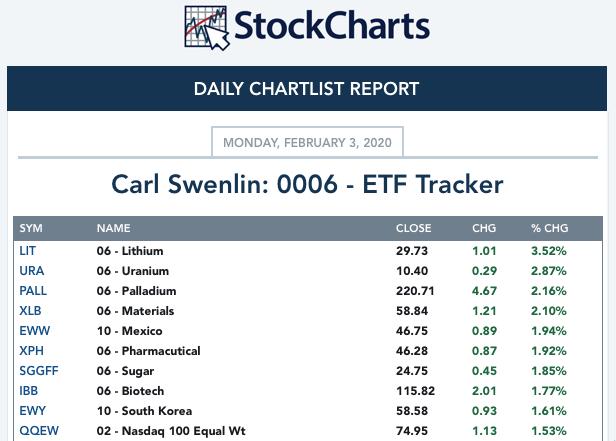
Top 10 from ETF Tracker:
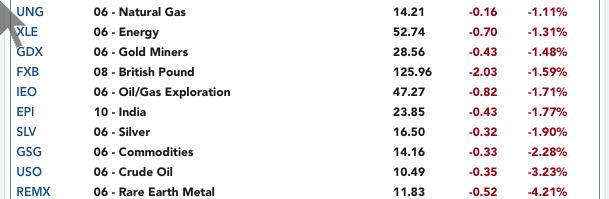
Bottom 10 from ETF Tracker:
On Friday, the DecisionPoint Alert Weekly Wrap presents an assessment of the trend and condition of the stock market (S&P 500), the U.S. Dollar, Gold, Crude Oil, and Bonds. Monday through Thursday the DecisionPoint Alert daily report is abbreviated and covers changes for the day.
Watch the latest episode of DecisionPoint on StockCharts TV's YouTube channel here!
SECTORS
SIGNALS:
Each S&P 500 Index component stock is assigned to one, and only one, of 11 major sectors. This is a snapshot of the Intermediate-Term (Silver Cross) and Long-Term (Golden Cross) Trend Model signal status for those sectors.
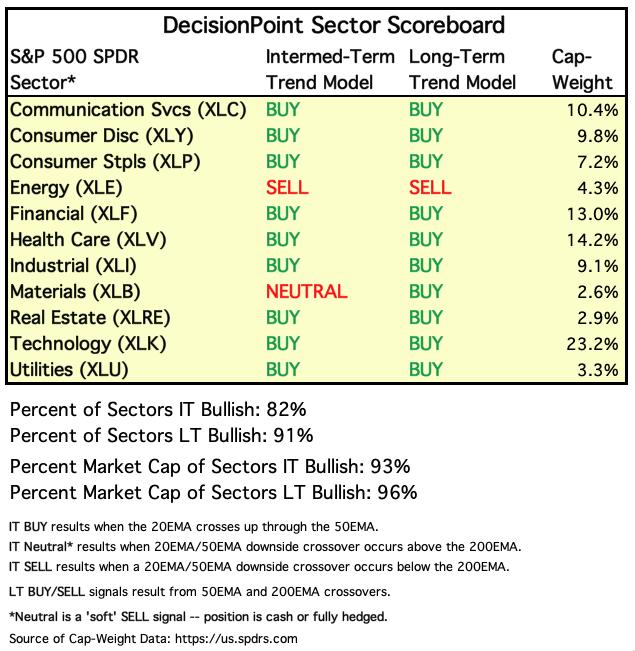
TODAY'S RESULTS:
STOCKS
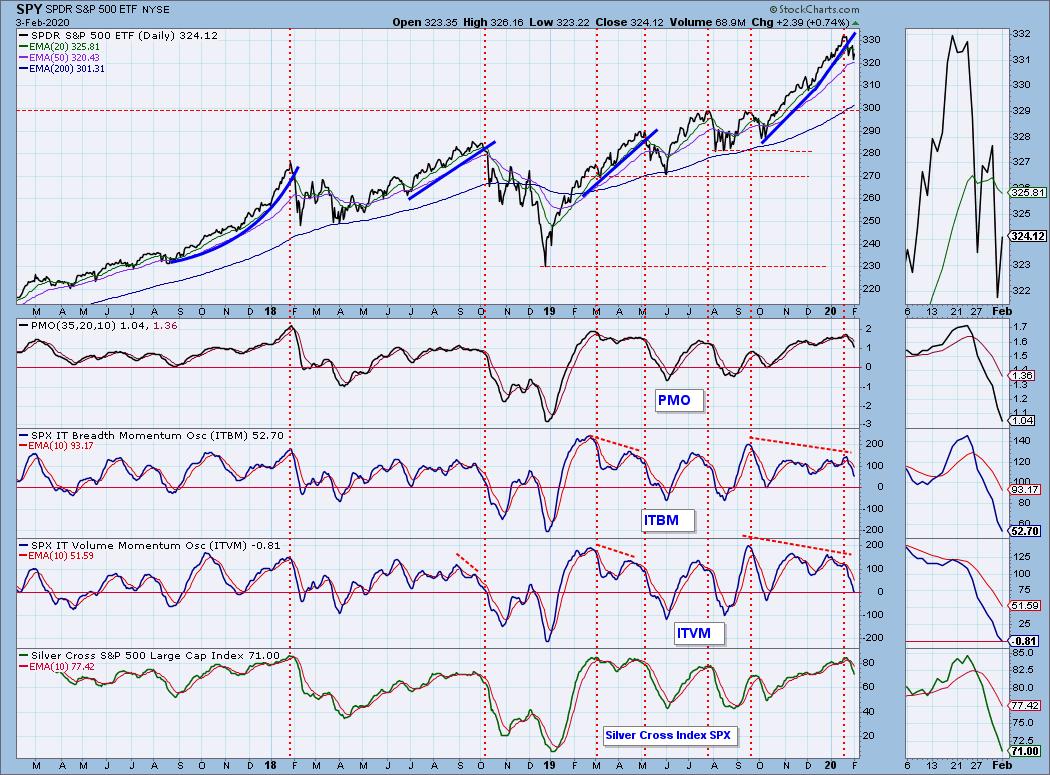
IT Trend Model: BUY as of 9/6/2019
LT Trend Model: BUY as of 2/26/2019
SPY Daily Chart: As noted above, the 320 level is so far holding up. That also coincides with the 50-EMA right now. If further decline is to be avoided, that level needs to hold. The last few times that the 50-EMA did NOT hold up, it took a decline to the 200-EMA before support was found. That matches up with the level I noted in today's opening, where the double-top formed on the July/September highs.
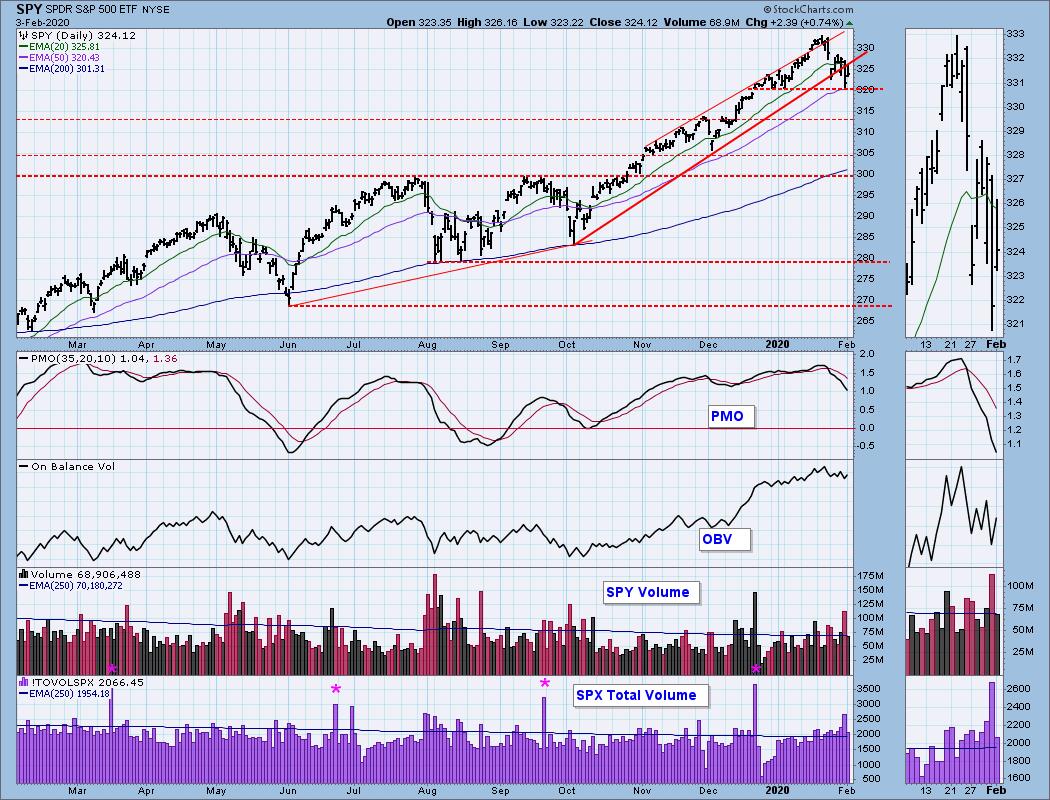
Climactic Market Indicators: VIX readings continue to bounce below the bottom Bollinger Band. Typically this precedes a short-term rise in price. I am still looking for price action similar to what followed the same type of VIX readings in August. Volume was elevated on today's rally which is positive.
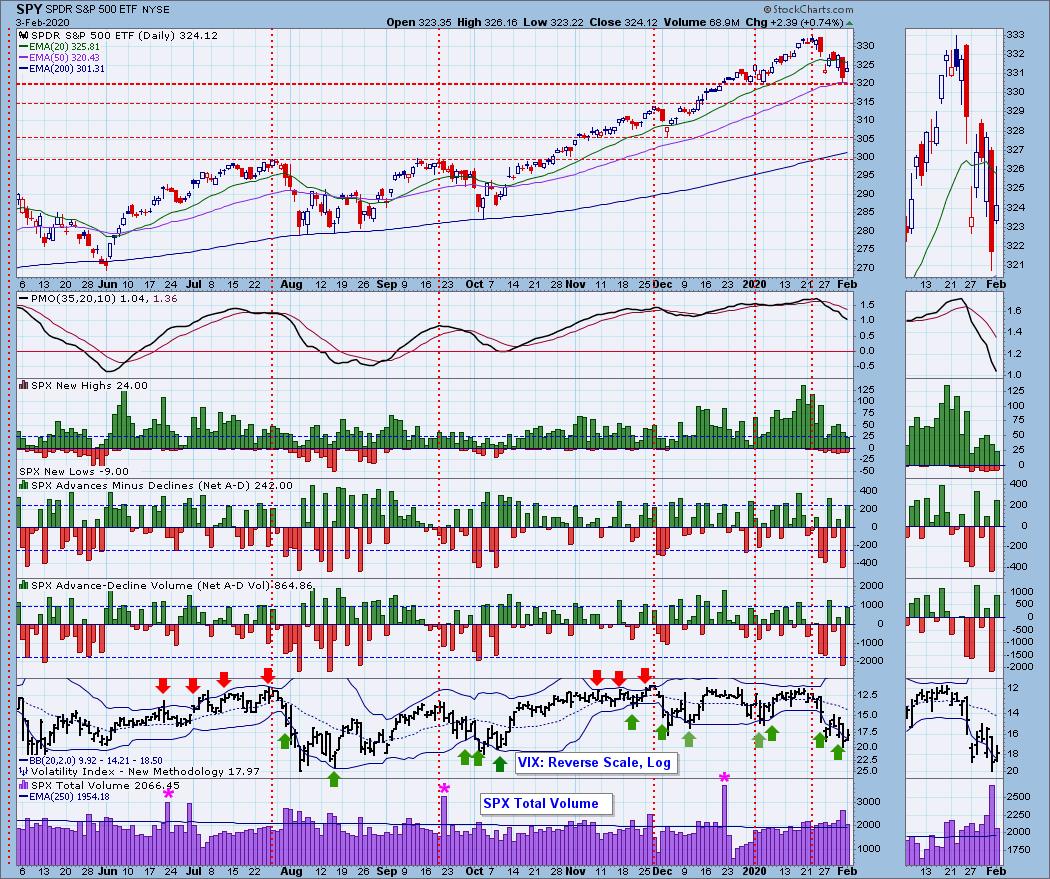
Short-Term Market Indicators: Finally seeing solid bottoms on the STOs in oversold territory. Yet the PMO is falling and didn't even decelerate on today's rally. Still seeing declining tops on the other indicators, so I'm not looking for an impressive turnaround.
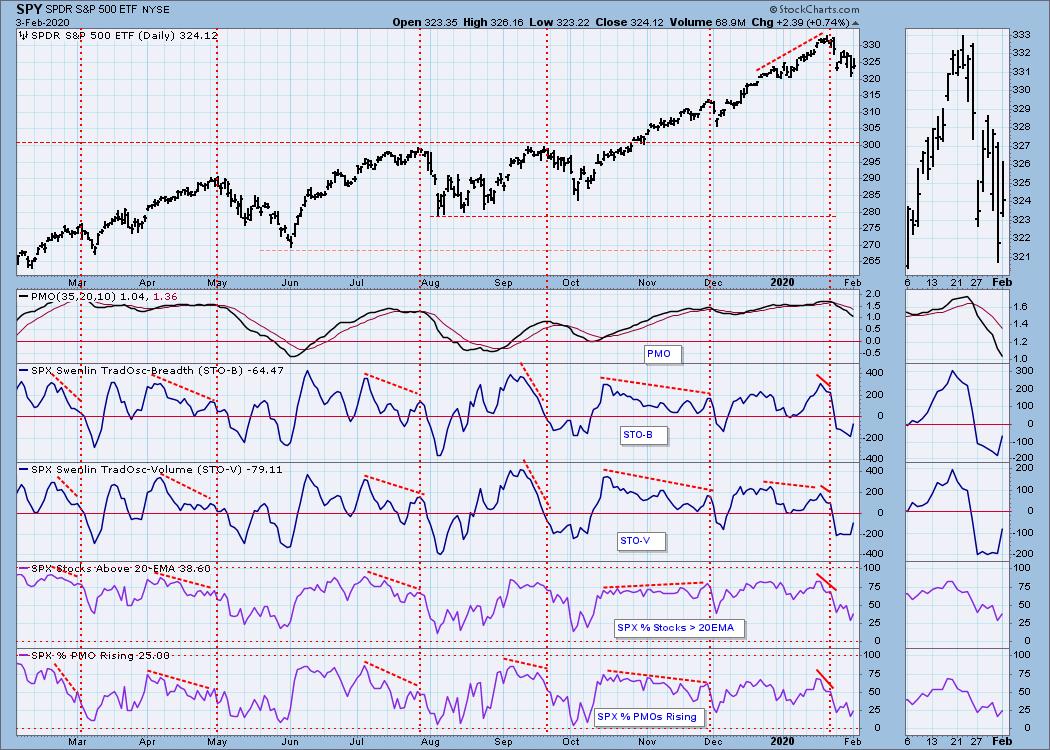
Intermediate-Term Market Indicators: They remain in decline and aren't looking interested in turning around yet.
Negative crossover on the Golden Cross Index is not good. We continue to see deterioration which translates to component stocks losing IT Trend Model BUY signals (Silver Cross) and LT Trend Model BUY signals (Golden Cross).
CONCLUSION: The trend of the market is down in the short term, but is still holding onto a longer-term uptrend. The market's condition is less overbought than we've seen. The PMO and other indicators are no longer residing in overbought extremes. The short-term indicators are looking pretty good between the STOs and VIX. Intermediate-term indicators are still very bearish so I'm looking for some sideways volatile trading at best.
(Not a Diamonds subscriber? Add it to your DP Alert subscription and get a discount! Contact support@decisionpoint.com for your limited time coupon code!)
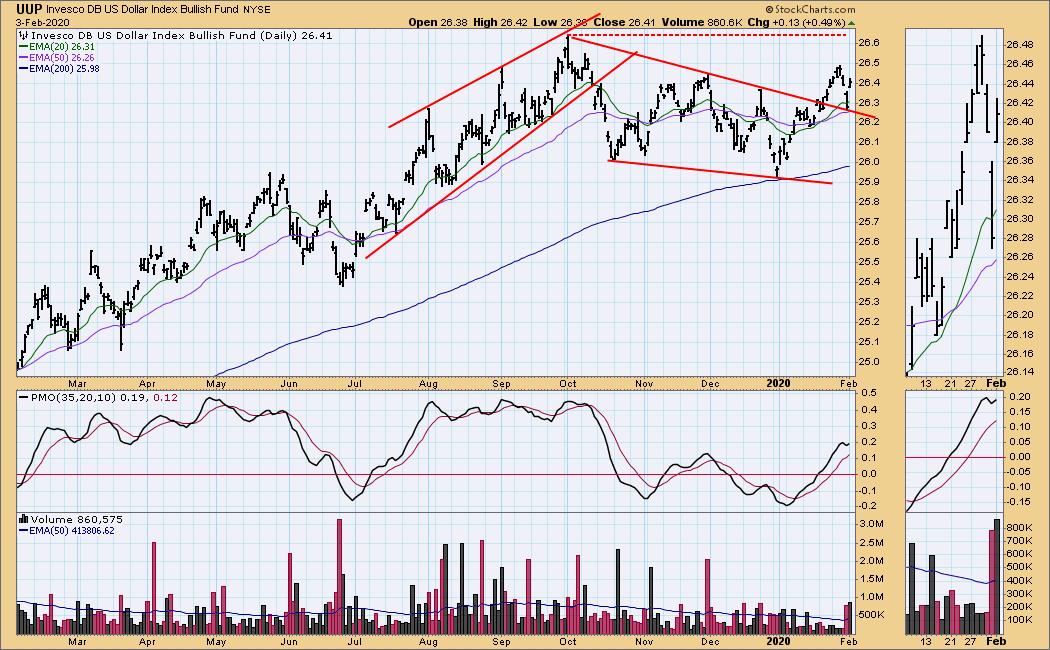
DOLLAR (UUP)
IT Trend Model: BUY as of 1/22/2020
LT Trend Model: BUY as of 5/25/2018
UUP Daily Chart: The Dollar bounced off the top of the bullish falling wedge pattern. The PMO has turned itself back up. I am looking for the Dollar to test overhead resistance at the October top.
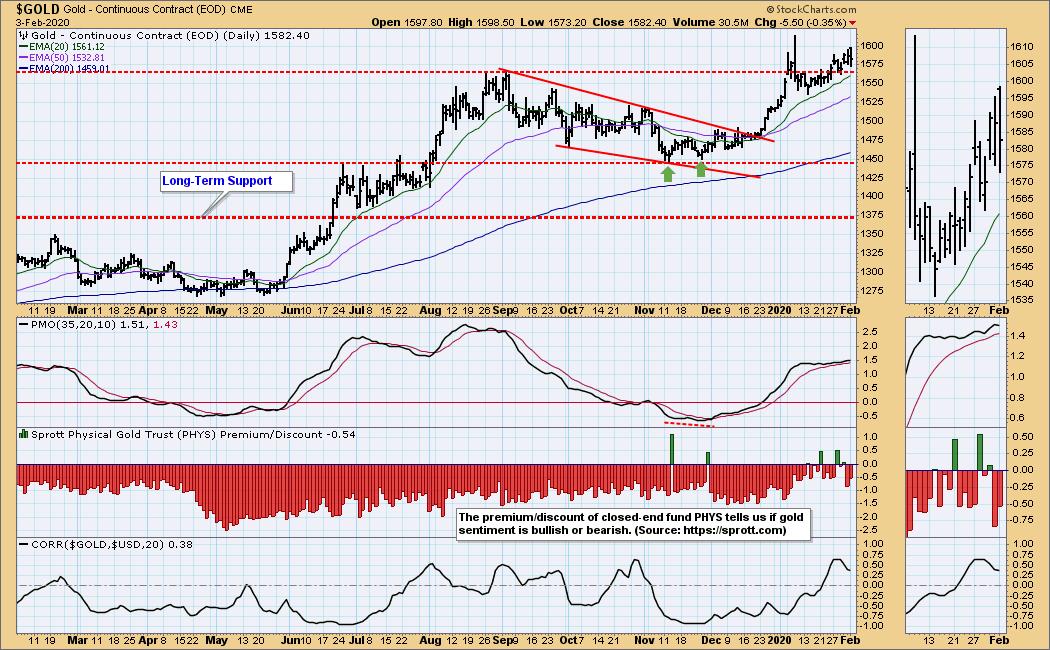
GOLD
IT Trend Model: BUY as of 12/26/2019
LT Trend Model: BUY as of 1/8/2019
GOLD Daily Chart: Gold was down today, but it remains above support at the August top. The PMO never lost much ground on the drop from last month's high and consequently, it is not overbought and can support higher prices.
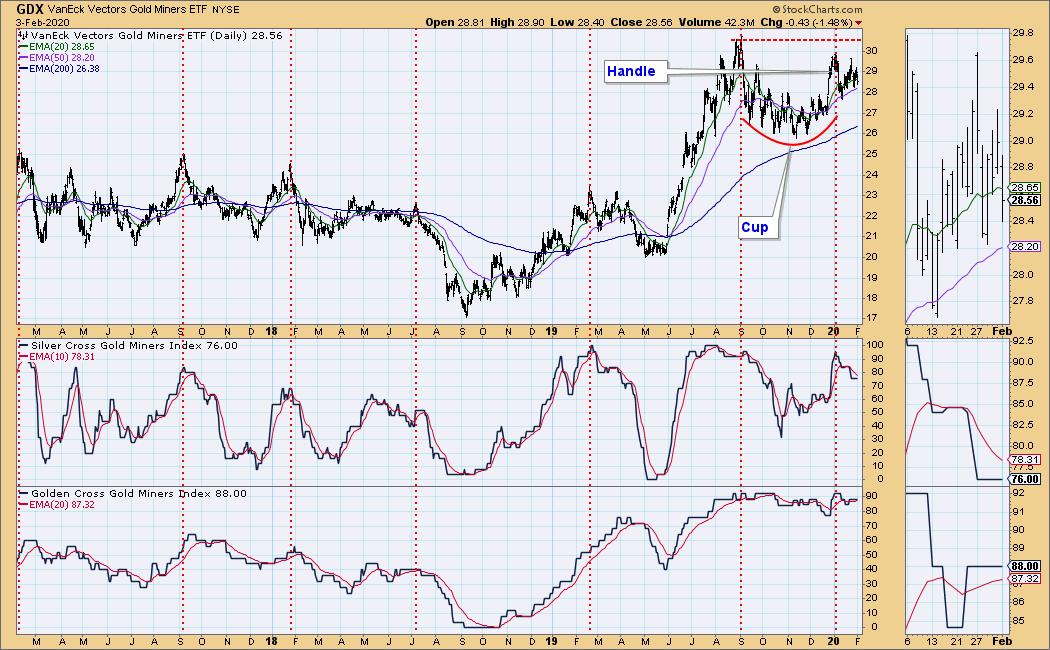
GOLD MINERS Golden and Silver Cross Indexes: The cup and handle are still visible on the Gold Miners. The Silver Cross and Golden Cross indicators flattened out but are still showing declining tops.
CRUDE OIL (USO)
IT Trend Model: Neutral as of 1/27/2020
LT Trend Model: BUY as of 12/16/2019
USO Daily Chart: With the deep dive that USO took after topping at the beginning of the year, it wasn't surprising to lose the IT Trend Model BUY signal when the 20-EMA crossed below the 50-EMA. Now we have a Long-Term SELL signal after the negative 50/200-EMA crossover. The PMO continues to slide and is in oversold territory. This could be a place for a rebound, but I suspect we will lose this support and need a test of the December 2018 low.
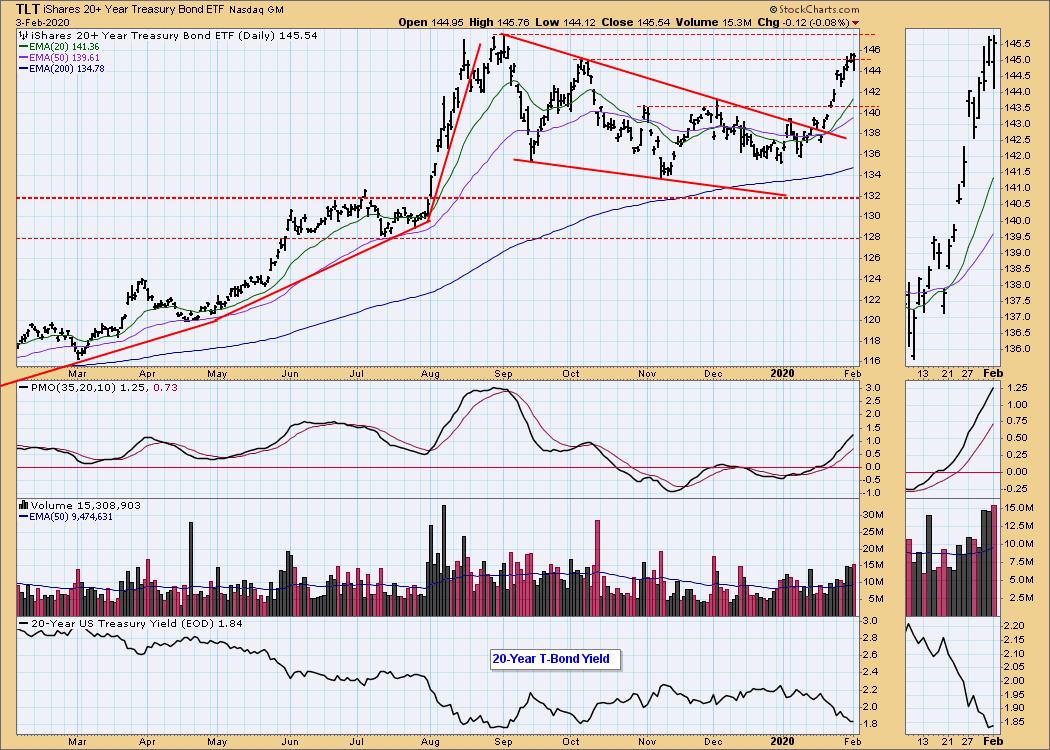
BONDS (TLT)
IT Trend Model: BUY as of 1/22/2020
LT Trend Model: BUY as of 1/2/2019
TLT Daily Chart: Price managed to close above resistance at the October top Friday and today. It does look like it could be topping, but the PMO is very positive and yields continue to move lower.
Have you subscribed the DecisionPoint Diamonds yet? You can add it at a discount! Contact support@decisionpoint.com for information on how to save on Diamonds!
Technical Analysis is a windsock, not a crystal ball.
Happy Charting! - Erin
Email: erin@decisionpoint.com

Erin Swenlin will be presenting at the The MoneyShow Las Vegas May 11-13, 2020! You'll have an opportunity to meet Erin and discuss the latest DecisionPoint news and Diamond Scans. The conference is free to attend or view online!
NOTE: The signal status reported herein is based upon mechanical trading model signals, specifically, the DecisionPoint Trend Model. They define the implied bias of the price index based upon moving average relationships, but they do not necessarily call for a specific action. They are information flags that should prompt chart review. Further, they do not call for continuous buying or selling during the life of the signal. For example, a BUY signal will probably (but not necessarily) return the best results if action is taken soon after the signal is generated. Additional opportunities for buying may be found as price zigzags higher, but the trader must look for optimum entry points. Conversely, exit points to preserve gains (or minimize losses) may be evident before the model mechanically closes the signal.
Helpful DecisionPoint Links (Can Be Found on DecisionPoint.com Links Page):
DecisionPoint Shared ChartList and DecisionPoint Chart Gallery
Price Momentum Oscillator (PMO)
Swenlin Trading Oscillators (STO-B and STO-V)