
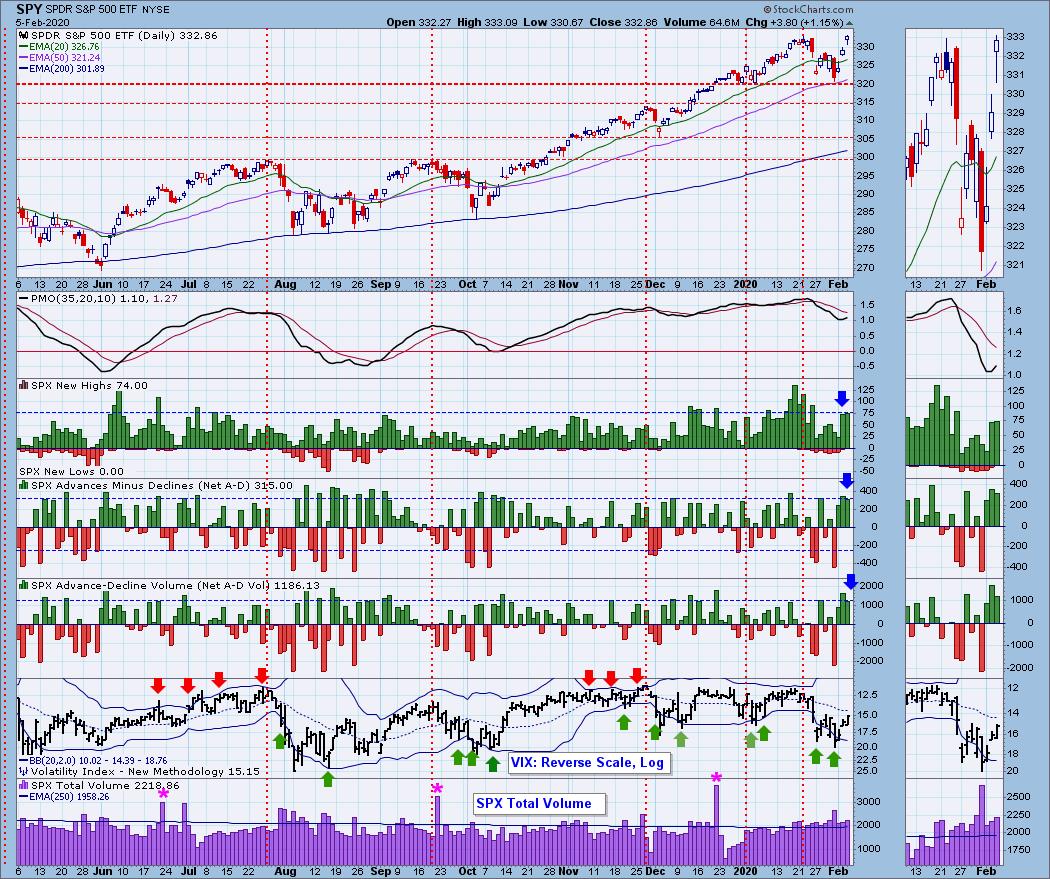
We saw climactic activity again on our ultra-short-term indicators. The question is whether this is a continuation of the buying initiation or are we already looking at a possible buying exhaustion. I'll reflect on this later in the article.
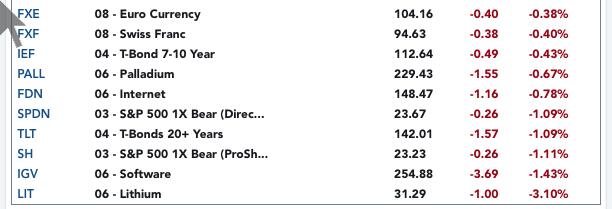
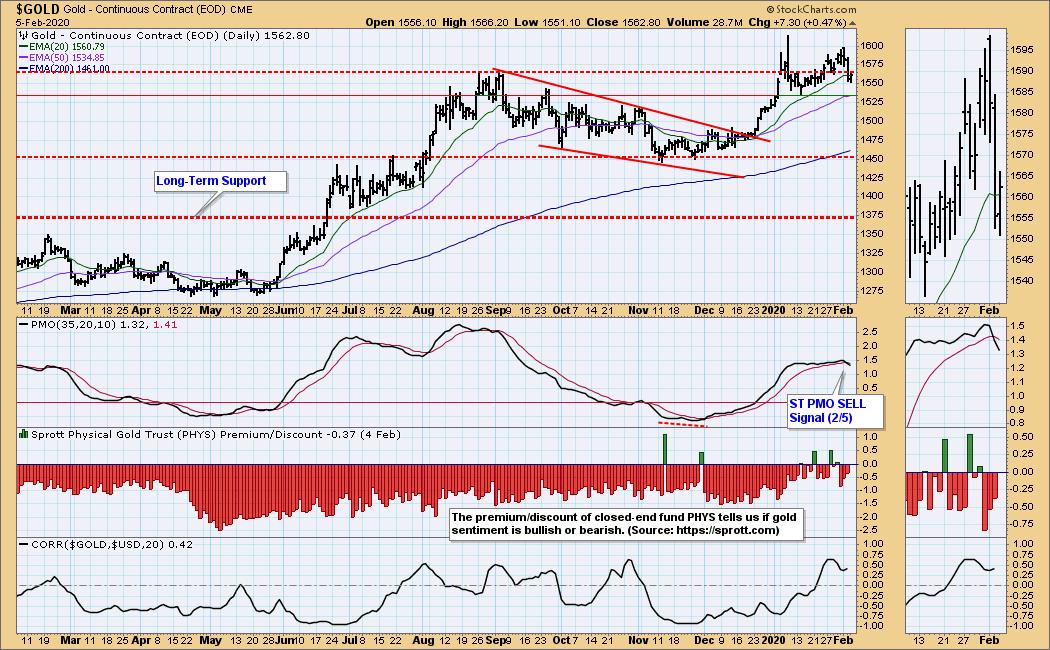
Gold rallied today, but despite that it couldn't fend off a new short-term Price Momentum Oscillator (PMO) SELL signal on the daily chart. I'll talk about Gold in more detail in its section, but you can see the SELL signal in the chart below.
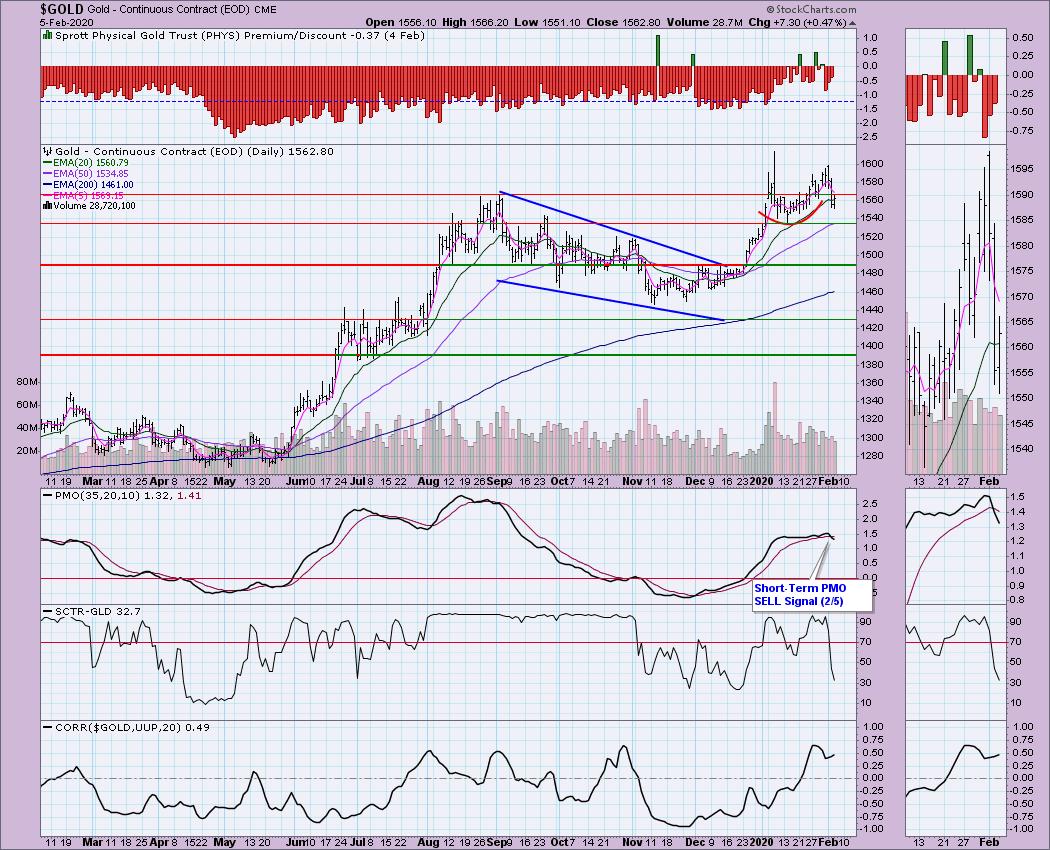
TODAY'S Broad Market Action:
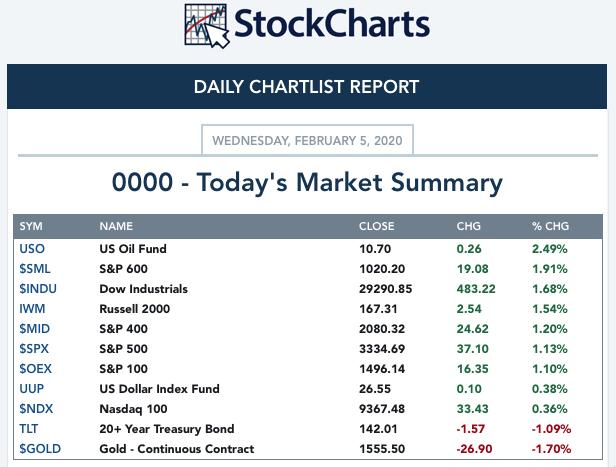
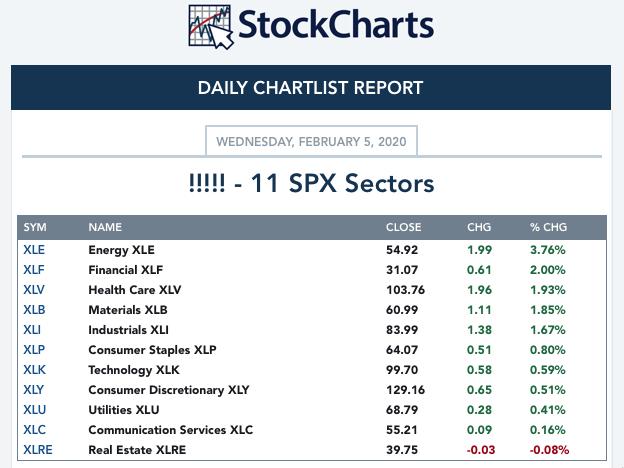
Top 10 from ETF Tracker:
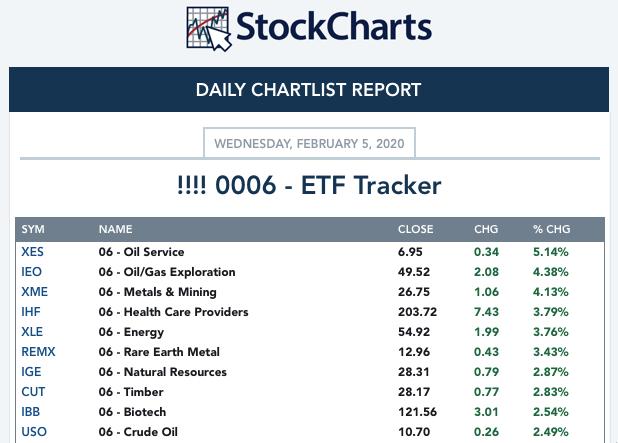
Bottom 10 from ETF Tracker:
On Friday, the DecisionPoint Alert Weekly Wrap presents an assessment of the trend and condition of the stock market (S&P 500), the U.S. Dollar, Gold, Crude Oil, and Bonds. Monday through Thursday the DecisionPoint Alert daily report is abbreviated and covers changes for the day.
Watch the latest episode of DecisionPoint on StockCharts TV's YouTube channel here!
SECTORS
SIGNALS:
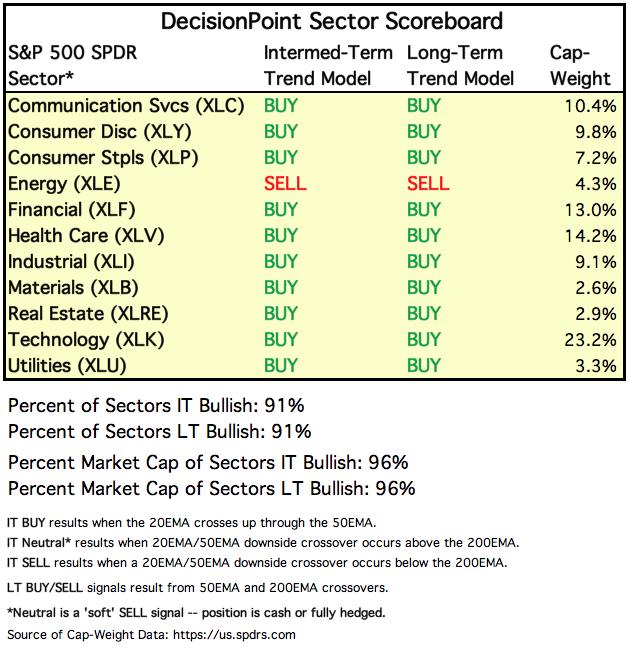
Each S&P 500 Index component stock is assigned to one, and only one, of 11 major sectors. This is a snapshot of the Intermediate-Term (Silver Cross) and Long-Term (Golden Cross) Trend Model signal status for those sectors.
TODAY'S RESULTS:
STOCKS
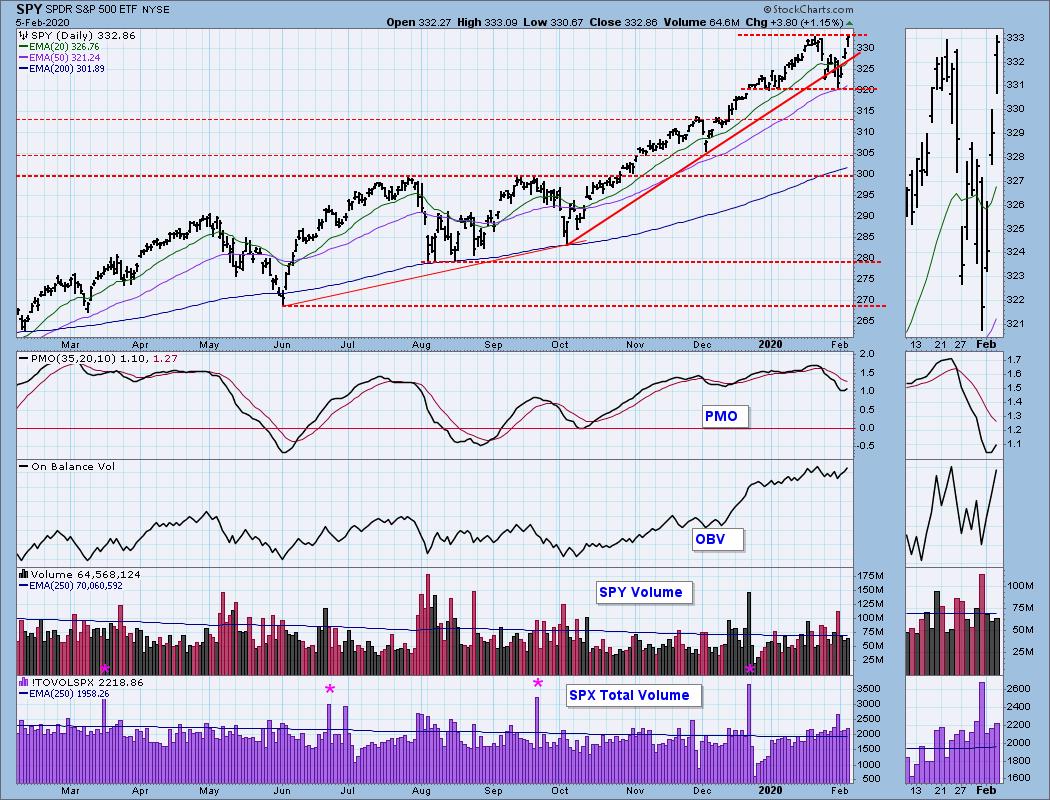
IT Trend Model: BUY as of 9/6/2019
LT Trend Model: BUY as of 2/26/2019
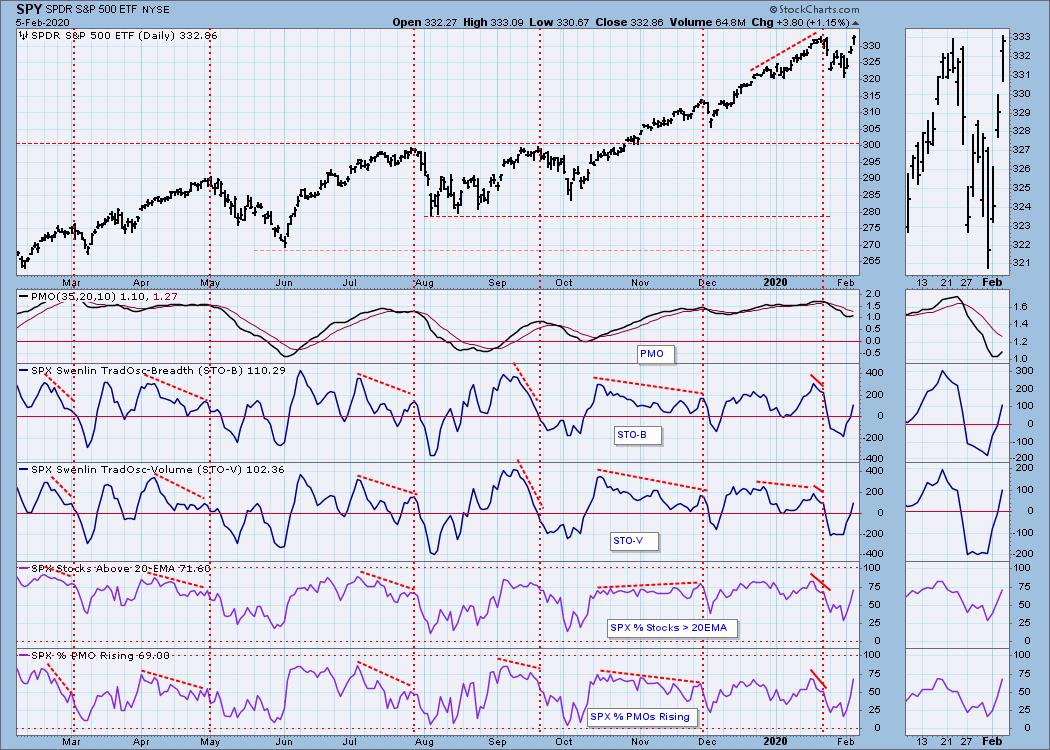
SPY Daily Chart: Today the market closed at a new all-time high following last night's State of the Union address and the continued problems with the count in Iowa. Whether these were catalysts to push to higher prices, I can't say, but the news has been bandied around. The important characteristics to note today are the continued rise of the PMO and the large volume generated on the move. I'm not sure that the volatility is over, but it is hard to argue a follow-on move after what looks like a breakaway gap from yesterday. Today's gap is likely a continuation gap.
Climactic Market Indicators: I reflected on today's chart and was feeling challenged to determine whether this is an exhaustion, but as I noted above, I believe today's gap was a continuation gap, not an exhaustion gap. We certainly are vulnerable to a reverse island on today's OHLC bar. Given the positive climactic readings coming on only the second day of a strong rally, I vote that this is a continuation of the buying initiation. One main reason is the VIX still lurking beneath its 20-MA on the inverse scale. I wouldn't really expect this to die out until VIX readings start getting lower.
Short-Term Market Indicators: STOs are charging higher and are not yet overbought. This confirms the rally. Breadth is starting to improve as both %stocks above their 20/50-EMAs has reached above its previous top.
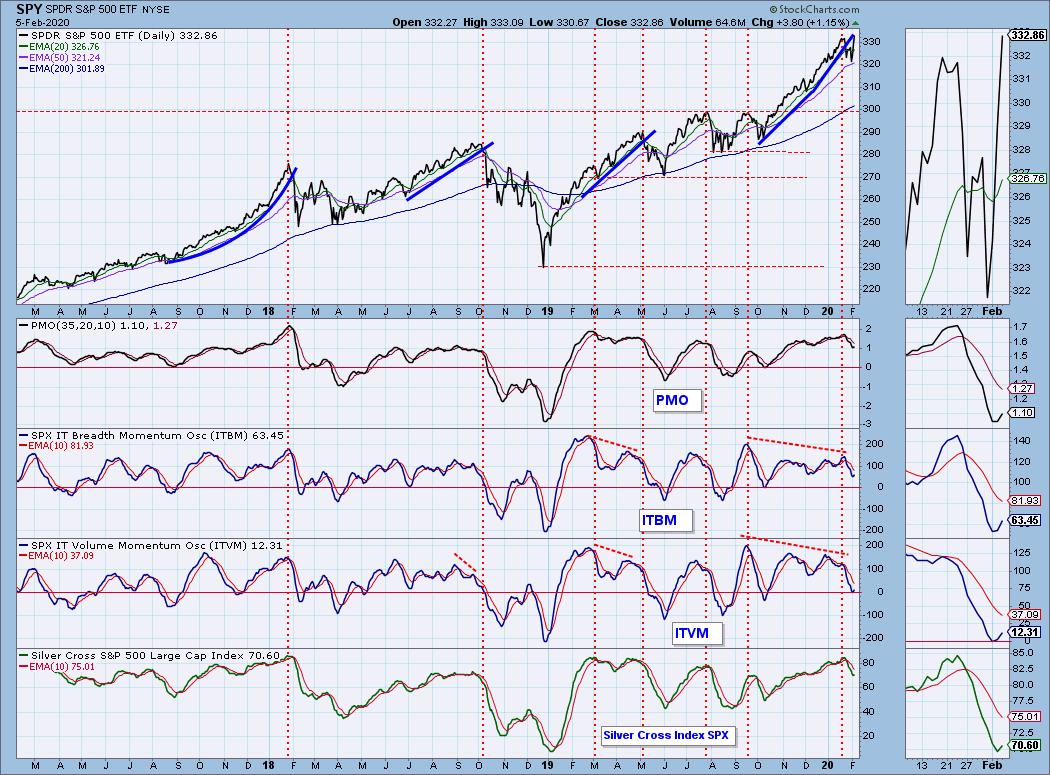
Intermediate-Term Market Indicators: We are finally seeing the ITBM/ITVM rising. I like that they have turned up above the zero line which suggests internal strength. Even the Silver Cross Index has turned up.
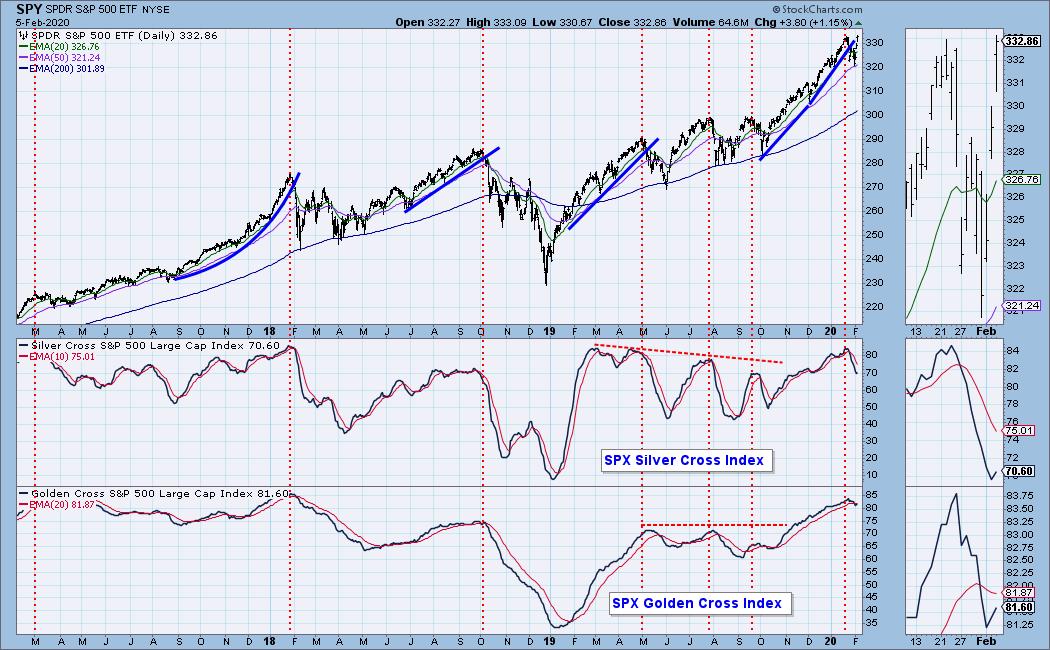
The Golden Cross Index is continuing higher and the Silver Cross Index has ticked up which is bullish.
CONCLUSION: The buying initiation from yesterday seems to be continuing as climactic readings were logged again today. The VIX is below its EMA and still has room to rise with price on the inverted scale. Indicators are bullish pretty much across the board. I'm expecting higher prices this week barring a "black swan" type event.
(Not a Diamonds subscriber? Add it to your DP Alert subscription and get a discount! Contact support@decisionpoint.com for your limited time coupon code!)
DOLLAR (UUP)
IT Trend Model: BUY as of 1/22/2020
LT Trend Model: BUY as of 5/25/2018
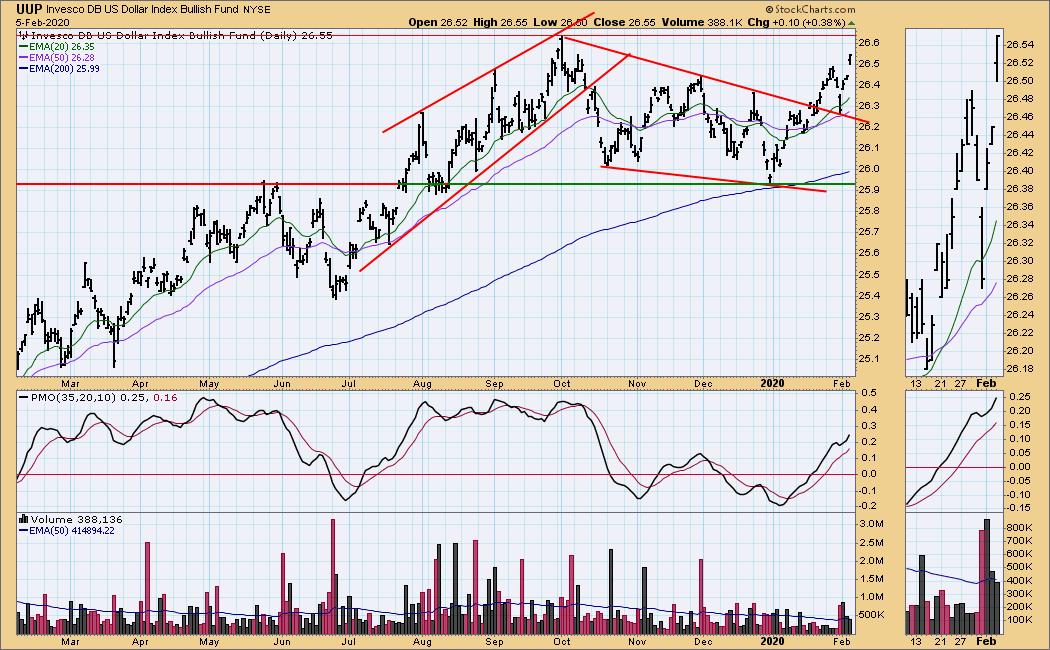
UUP Daily Chart: Nice rally on the Dollar today as it continues rising off the 50-EMA. Overhead resistance is nearing, but the PMO isn't overbought. The only issue I see is the drop in volume on UUP this week as price is rising. I see that as a negative divergence and something that should be considered.
GOLD
IT Trend Model: BUY as of 12/26/2019
LT Trend Model: BUY as of 1/8/2019
GOLD Daily Chart: Gold rallied today but as I noted in today's opening, it didn't prevent the ST PMO SELL signal. Price was held up at the September high. I think you can make a case for a cup and handle formation which is bullish. The correlation is positive right now between the Dollar and Gold which means they can travel in the same direction together. Typically the price of Gold is tied closely with the Dollar given it is denominated in Dollars. Therefore they tend to travel in opposite directions. I'm bullish the Dollar and given the correlation, it is also possible to be bullish on Gold. I'd say 'cautiously' bullish on Gold right now given the PMO SELL signal.
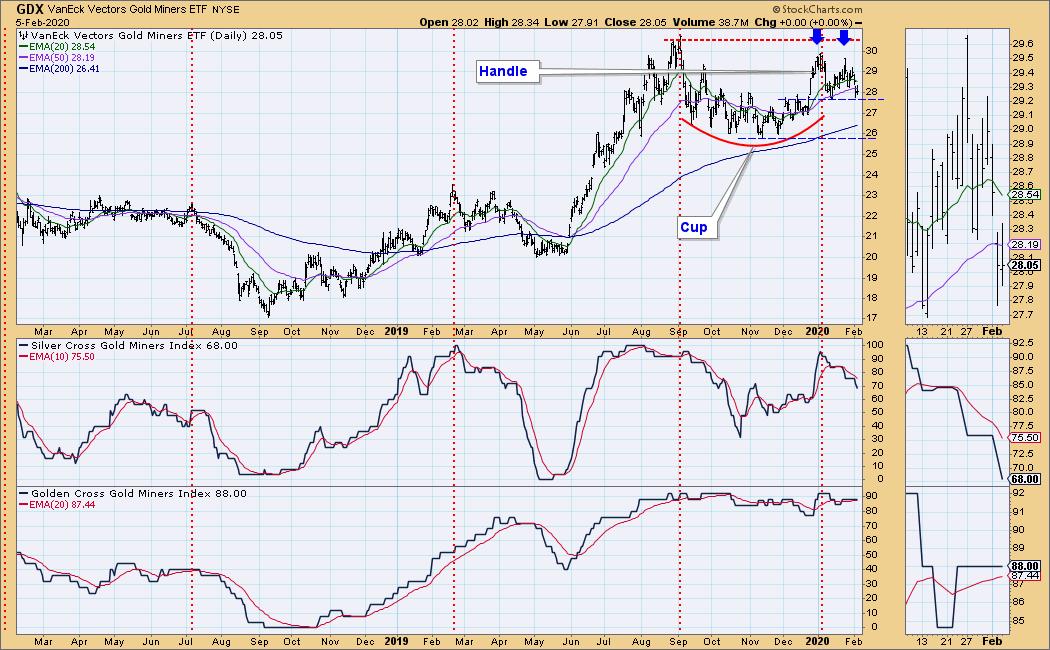
GOLD MINERS Golden and Silver Cross Indexes: The handle on the bullish cup and hand formation is looking a lot like a bearish double-top. This may not resolve to the upside as the cup and handle has insinuated. The Silver Cross Index is continuing to decline as more miners lose their IT Trend Model BUY signals (20-EMA > 50-EMA = BUY signal).
CRUDE OIL (USO)
IT Trend Model: Neutral as of 1/27/2020
LT Trend Model: BUY as of 12/16/2019
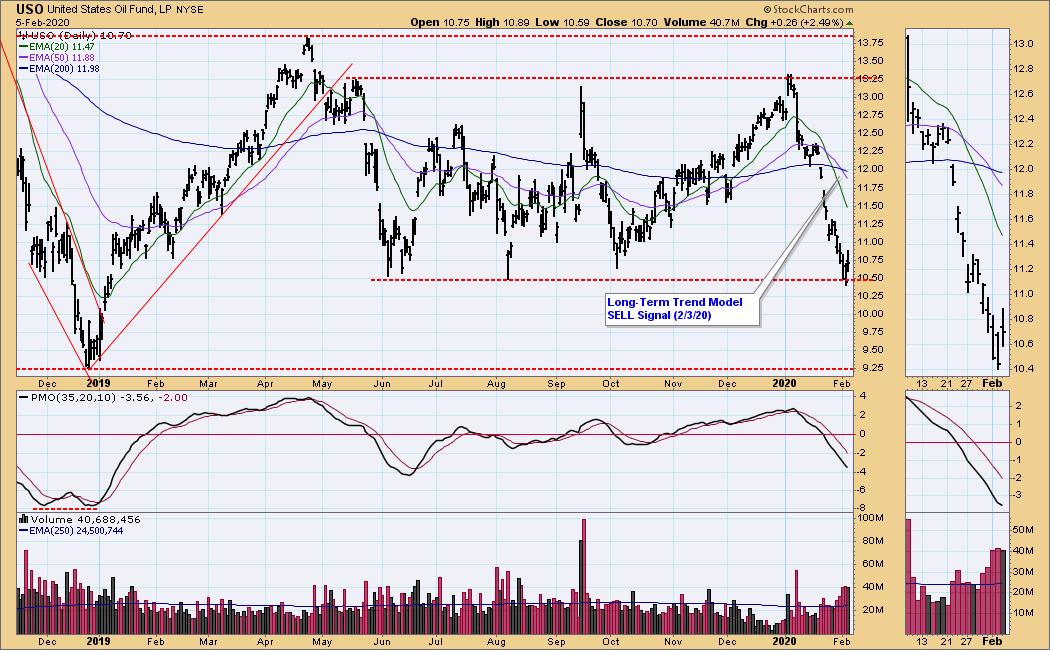
USO Daily Chart: I actually wasn't surprised to see a rally in Oil today given that it reached intermediate-term support yesterday. The PMO is decelerating. I personally wouldn't count on this support to hold. I have been watching this one closely as I believe there could be an opportunity here when it reaches even lower prices. Although given the OPEC discussions of squeezing supply, this may be the bottom.
BONDS (TLT)
IT Trend Model: BUY as of 1/22/2020
LT Trend Model: BUY as of 1/2/2019
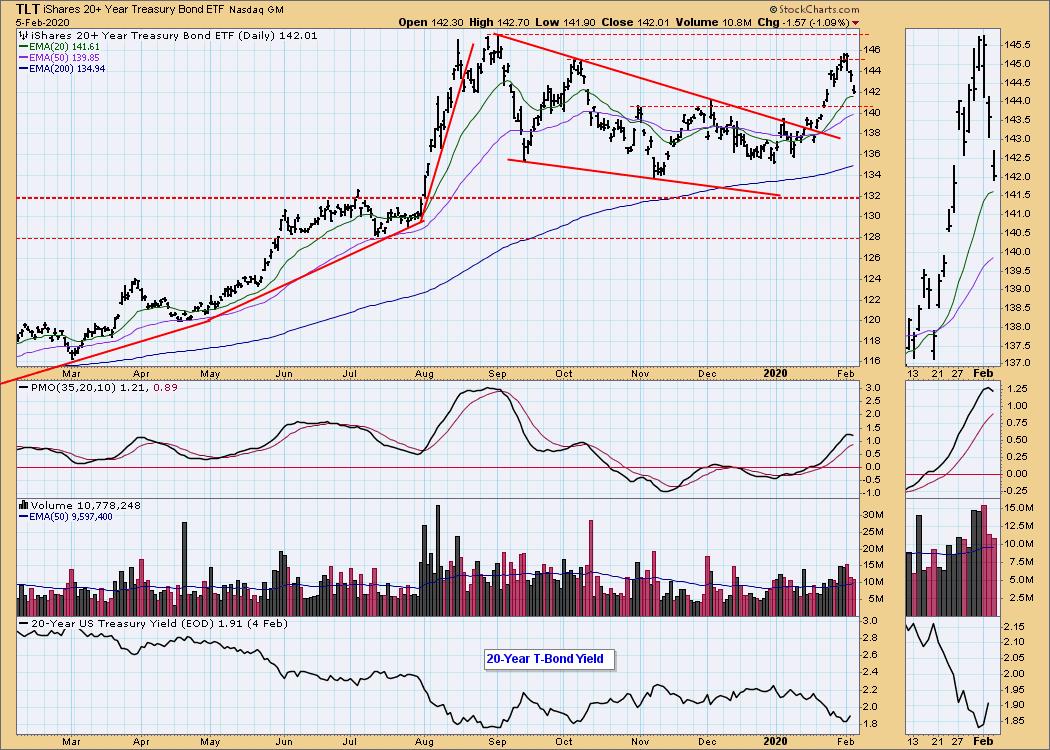
TLT Daily Chart: The pullback continues on TLT and we can see that yields are beginning to rise. The PMO has topped on this steep decline, but it is not overbought. We will know more when price decides to hold or break the 20-EMA.
Have you subscribed the DecisionPoint Diamonds yet? DP does the work for you by providing handpicked stocks/ETFs from exclusive DP scans! Add it with a discount! Contact support@decisionpoint.com for more information!
Technical Analysis is a windsock, not a crystal ball.
Happy Charting! - Erin
Email: erin@decisionpoint.com

Erin Swenlin will be presenting at the The MoneyShow Las Vegas May 11-13, 2020! You'll have an opportunity to meet Erin and discuss the latest DecisionPoint news and Diamond Scans. The conference is free to attend or view online!
NOTE: The signal status reported herein is based upon mechanical trading model signals, specifically, the DecisionPoint Trend Model. They define the implied bias of the price index based upon moving average relationships, but they do not necessarily call for a specific action. They are information flags that should prompt chart review. Further, they do not call for continuous buying or selling during the life of the signal. For example, a BUY signal will probably (but not necessarily) return the best results if action is taken soon after the signal is generated. Additional opportunities for buying may be found as price zigzags higher, but the trader must look for optimum entry points. Conversely, exit points to preserve gains (or minimize losses) may be evident before the model mechanically closes the signal.
Helpful DecisionPoint Links (Can Be Found on DecisionPoint.com Links Page):
DecisionPoint Shared ChartList and DecisionPoint Chart Gallery
Price Momentum Oscillator (PMO)
Swenlin Trading Oscillators (STO-B and STO-V)