
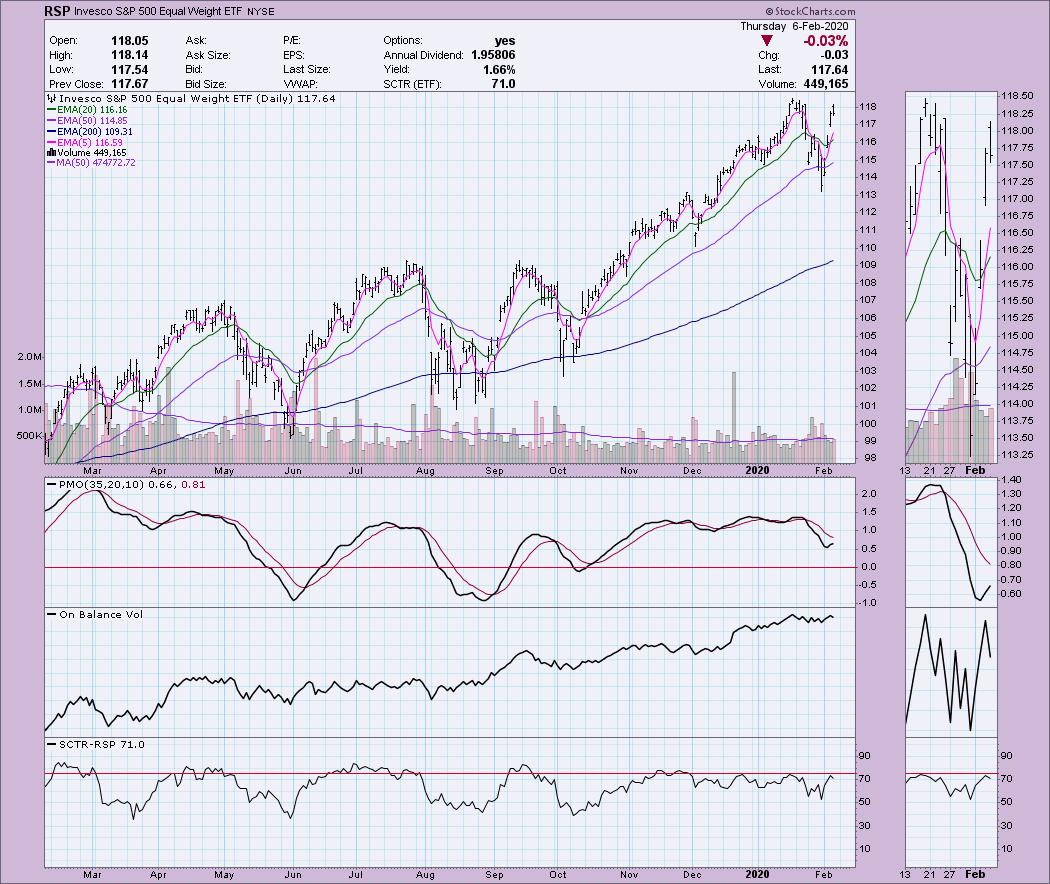
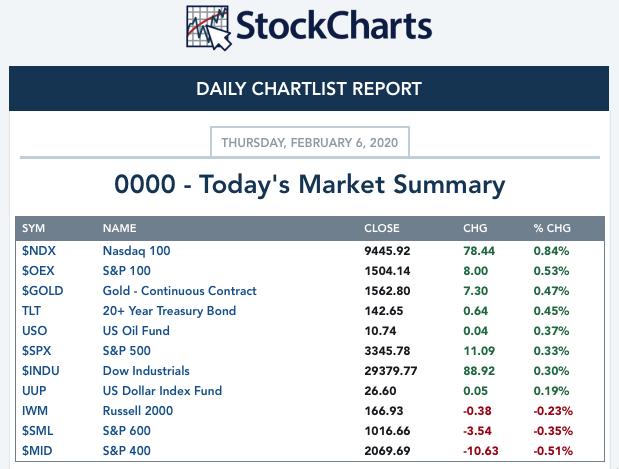
Another rally for the large-cap indexes, setting new all-time highs in most cases. The concern would be that the mid-caps and small-caps were down 0.35% for SP600 and 0.51% for SP400. This tells me that the big names are likely driving this market. I'm not saying this is a terrible thing, but we generally see the small- and mid-caps turn lower before the large-caps. I think you should see the equal-weighted ETF of the S&P500 (RSP). It really underscores that most of today's rally was driven by the 'big guys'. Today it was down and notice it hasn't yet tested overhead resistance at all-time highs.
TODAY'S Broad Market Action:
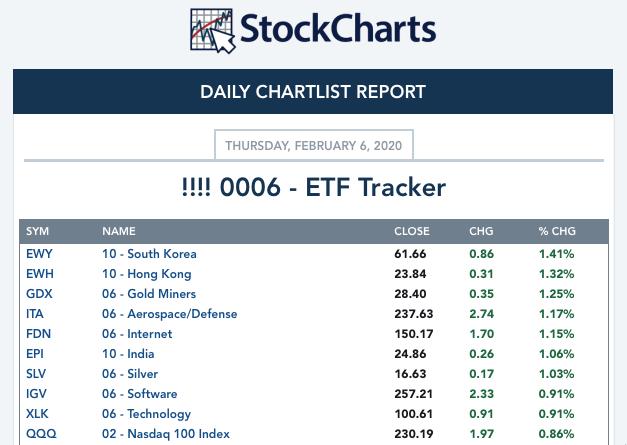
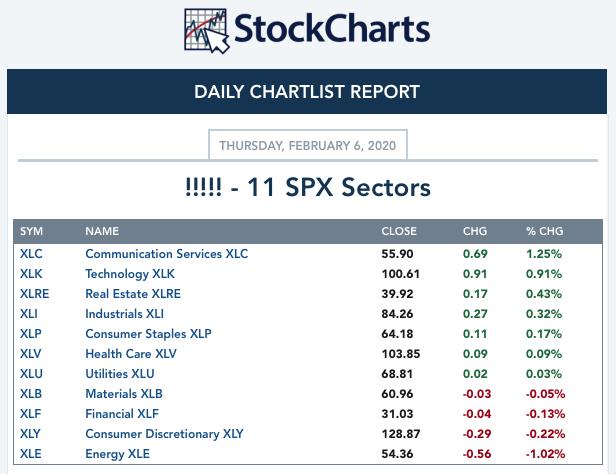
Top 10 from ETF Tracker:
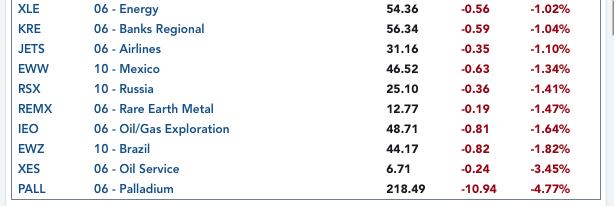
Bottom 10 from ETF Tracker:
On Friday, the DecisionPoint Alert Weekly Wrap presents an assessment of the trend and condition of the stock market (S&P 500), the U.S. Dollar, Gold, Crude Oil, and Bonds. Monday through Thursday the DecisionPoint Alert daily report is abbreviated and covers changes for the day.
Watch the latest episode of DecisionPoint on StockCharts TV's YouTube channel here!
SECTORS
SIGNALS:
Each S&P 500 Index component stock is assigned to one, and only one, of 11 major sectors. This is a snapshot of the Intermediate-Term (Silver Cross) and Long-Term (Golden Cross) Trend Model signal status for those sectors.
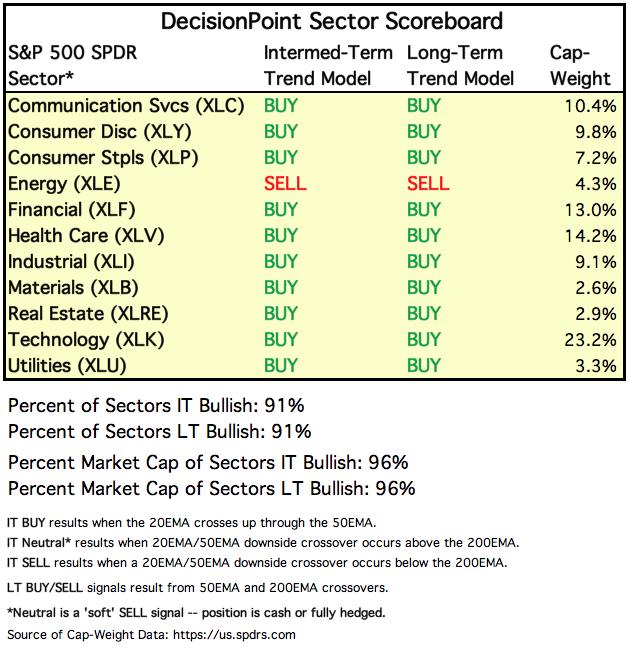
TODAY'S RESULTS:
STOCKS
IT Trend Model: BUY as of 9/6/2019
LT Trend Model: BUY as of 2/26/2019
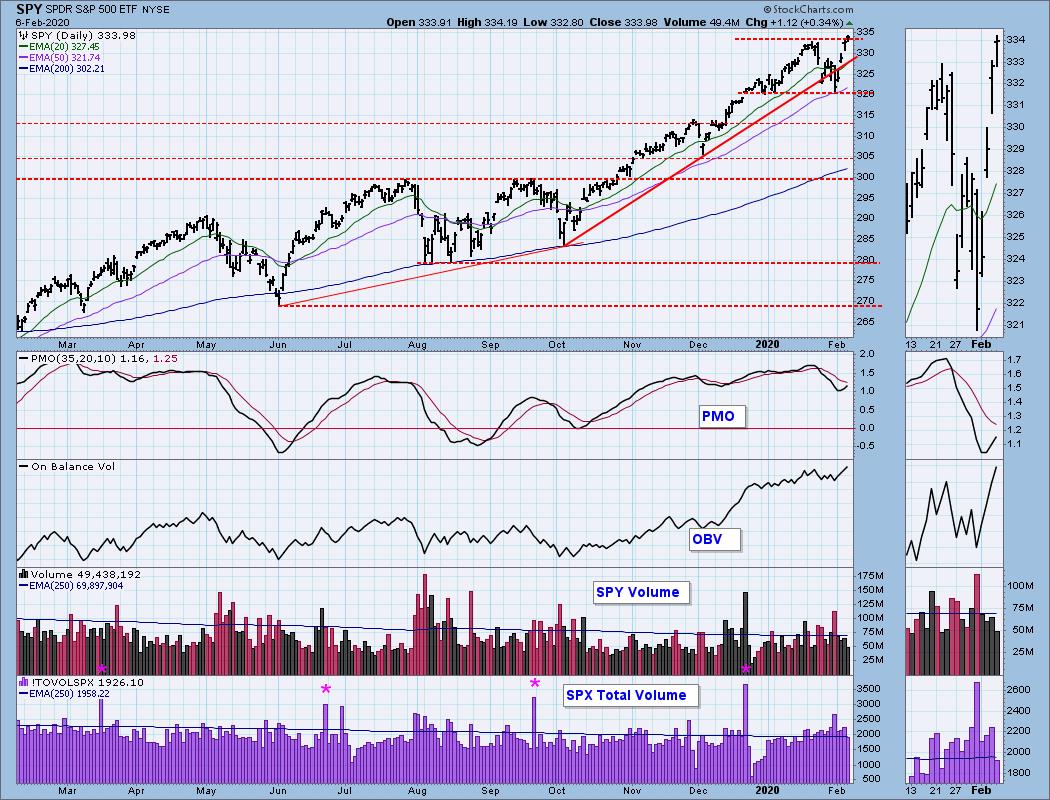
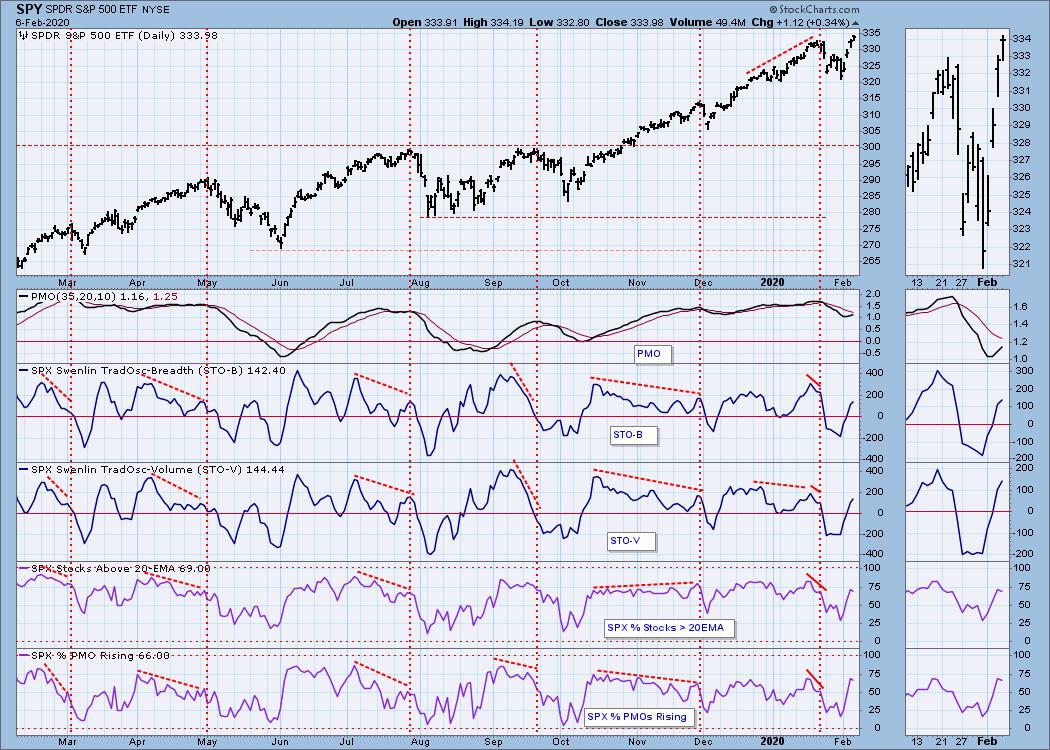
SPY Daily Chart: The SPY set a new all-time high on a day with about average volume in total. While I don't generally use SPY volume as a gauge, I do have to note that as the SPY is rallying to new all-time highs, volume is starting to pare back. Whether the coronavirus or impeachment or other catalyst, the pullback off the January top was what was needed. The PMO is rising and nearing a BUY signal. Today the NDX did have a ST PMO BUY signal trigger.
Climactic Market Indicators: No climactic readings today. New Highs are still elevated which is positive, but the big story on this chart is the VIX which is not overbought yet and could certainly see lower readings.
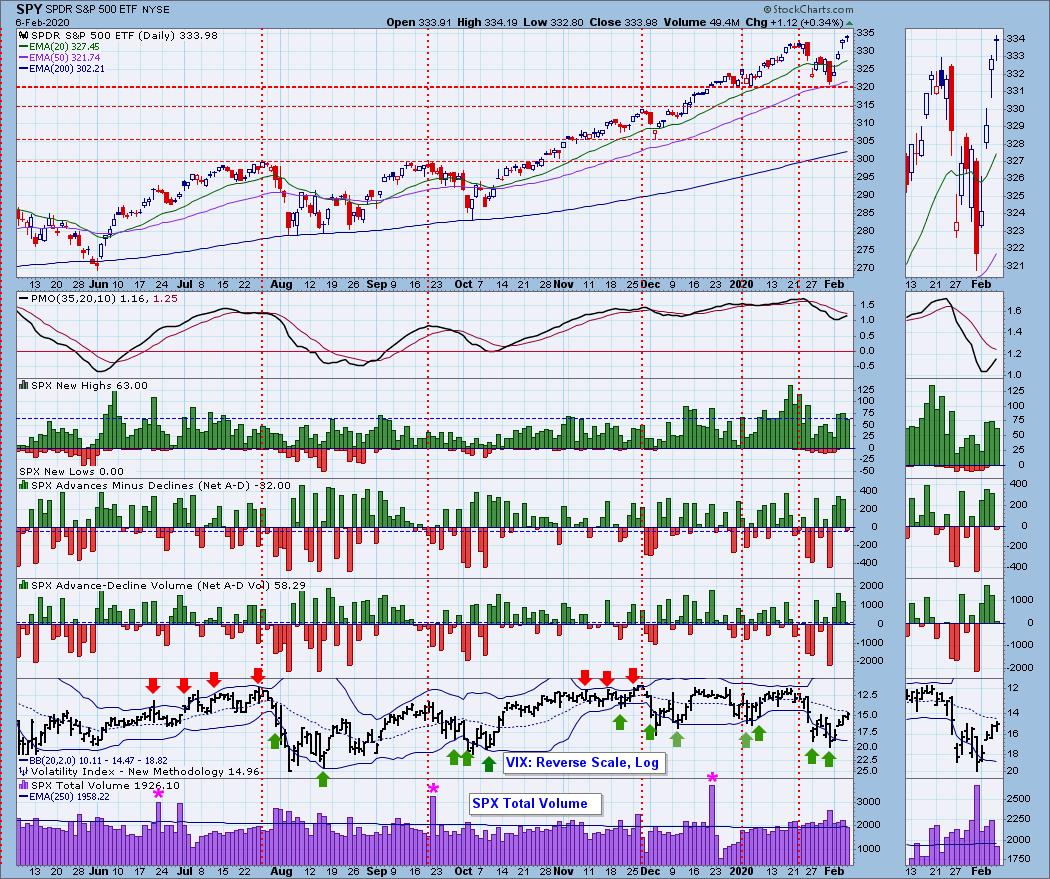
Short-Term Market Indicators: STOs continue to move higher confirming the rally. Breadth showed a slight decrease. This could end up forming a negative divergence if breadth continues lower as this top is lower than the previous.
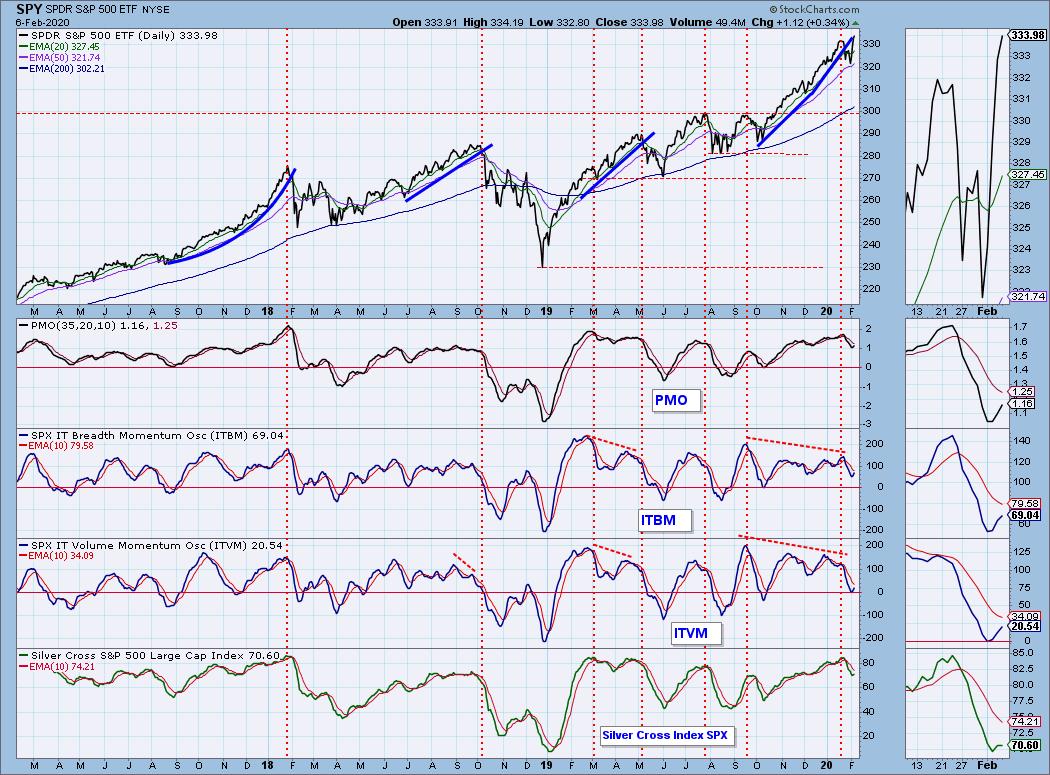
Intermediate-Term Market Indicators: So far so good with the ITBM/ITVM. We are still waiting on a positive crossover to add to the confidence factor.
Both Silver and Golden Cross Indexes flattened today. Not particularly bullish on a day when new all-time highs were logged on the SPX. Again, I think this really underscores that the big guys drove today's rally.
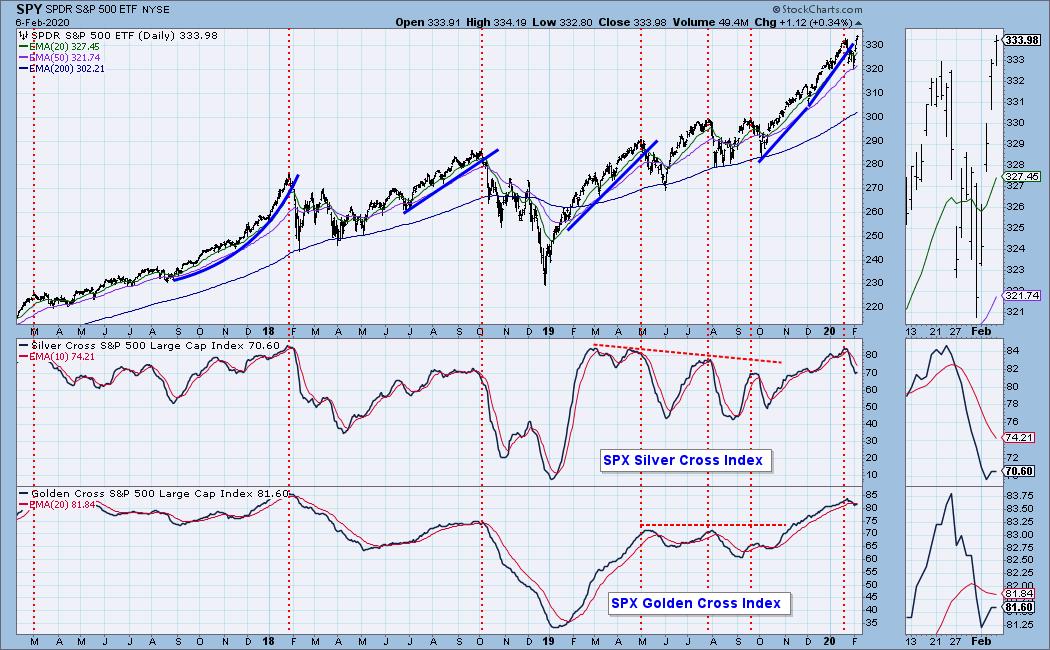
CONCLUSION: The indicators look positive. My only problem today would be the divergence between the SPX and not only small- and mid-caps, but also the Equal-Weight SPX ETF (RSP). Again, not what you want to see on a day when new all-time highs were made.
(Not a Diamonds subscriber? Add it to your DP Alert subscription and get a discount! Contact support@decisionpoint.com for your limited time coupon code!)
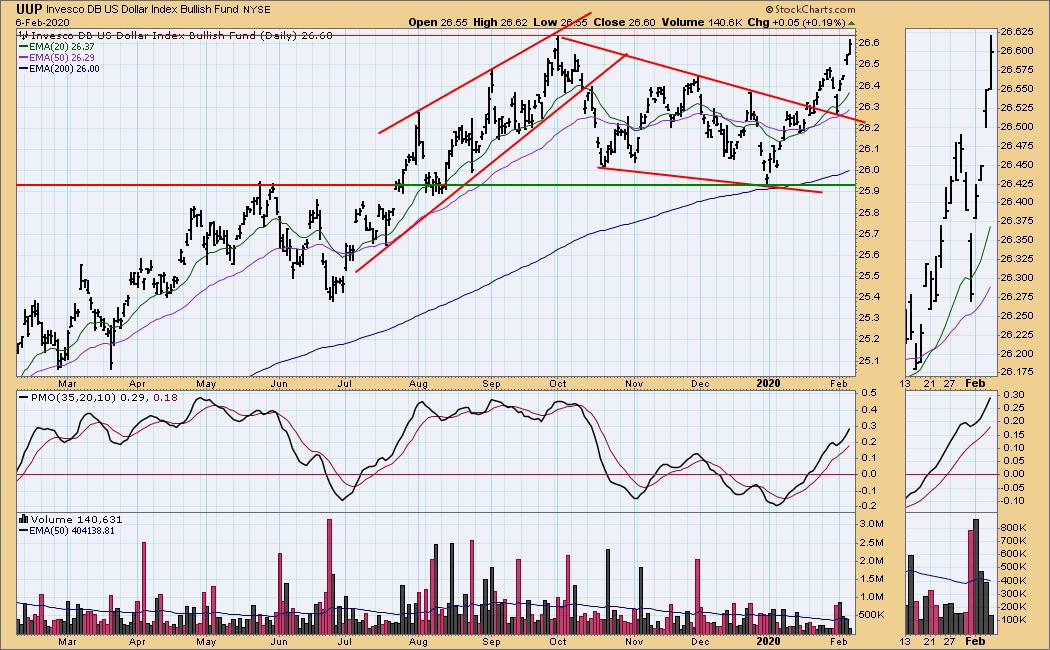
DOLLAR (UUP)
IT Trend Model: BUY as of 1/22/2020
LT Trend Model: BUY as of 5/25/2018
UUP Daily Chart: Volume is pulling back even as the Dollar (UUP) rallies which is the only problem I see on this chart. The PMO is not overbought and I suspect overhead resistance will be broken soon.
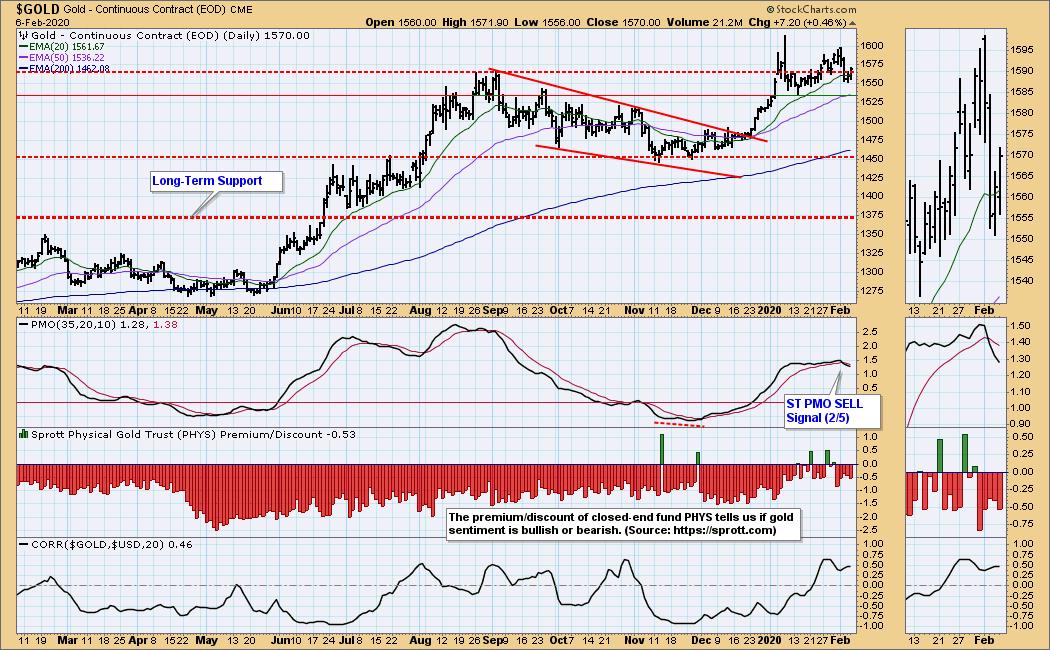
GOLD
IT Trend Model: BUY as of 12/26/2019
LT Trend Model: BUY as of 1/8/2019
GOLD Daily Chart: Higher prices on Gold today even though we saw the Dollar rise. It does explain the positive correlation right now. I still like Gold because it held support and this last drop didn't even require a drop to that support level around 1525.
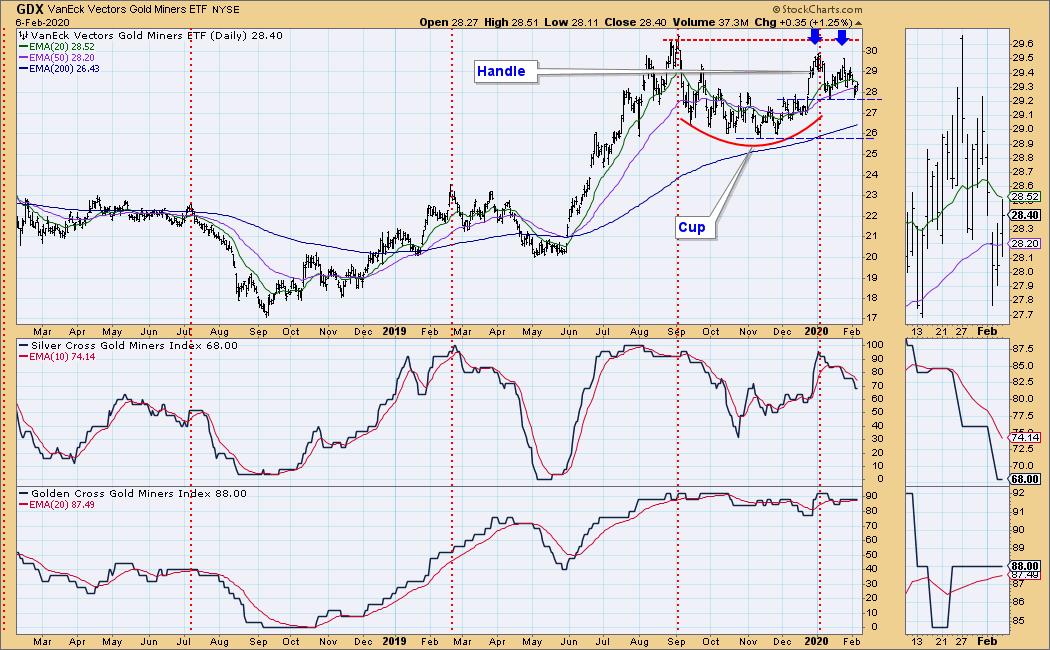
GOLD MINERS Golden and Silver Cross Indexes: I was happy to see a bounce off support on the "handle" of this formation. I'm still watching the possible double-top and honestly, if price can't get above the declining tops line it forms, we will have a descending triangle which is bearish. For now this bounce is encouraging.
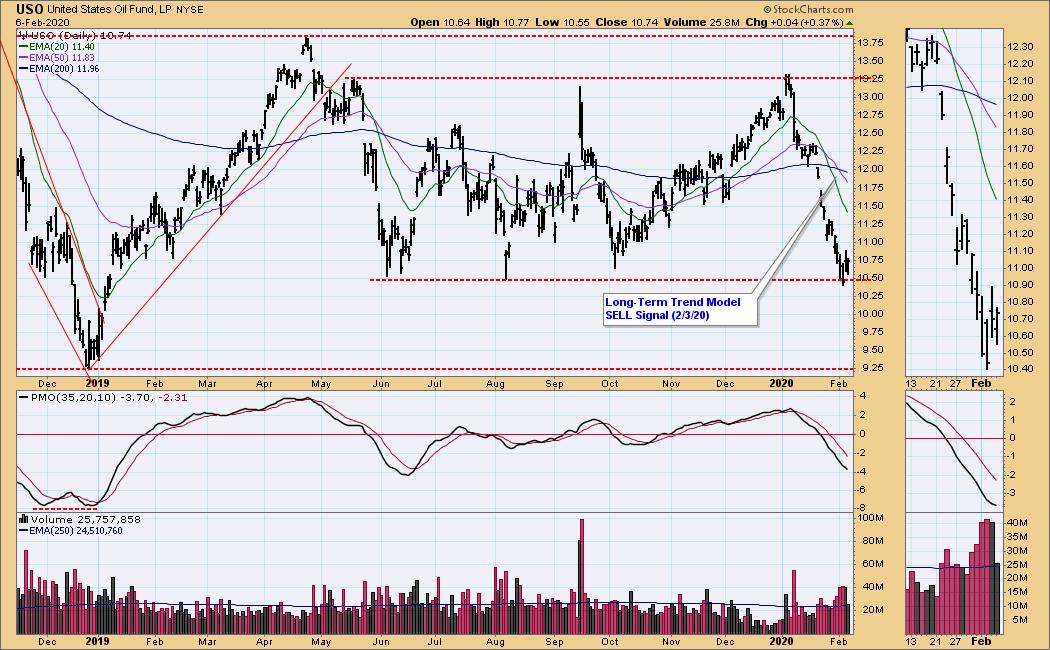
CRUDE OIL (USO)
IT Trend Model: Neutral as of 1/27/2020
LT Trend Model: BUY as of 12/16/2019
USO Daily Chart: USO is attempting to put in a bottom. I certainly like seeing that, but knowing that there is support lower than that at $9.25 makes it less enticing. In today's Diamonds Report a reader helped me uncover another way to take advantage of these lows in Oil.
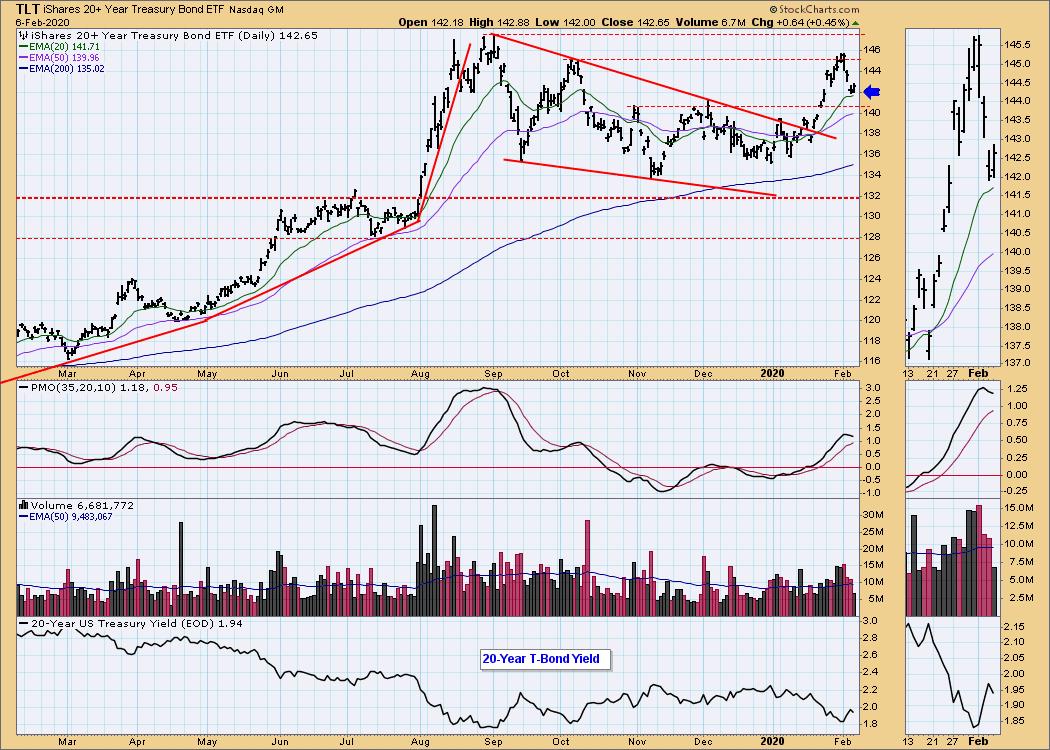
BONDS (TLT)
IT Trend Model: BUY as of 1/22/2020
LT Trend Model: BUY as of 1/2/2019
TLT Daily Chart: The 20-EMA appears ready to hold up. The PMO suggests otherwise. Notice today that this rally came on below average volume. I'm still overall bullish on Bonds, but the pullback may not quite be over.
Have you subscribed the DecisionPoint Diamonds yet? DP does the work for you by providing handpicked stocks/ETFs from exclusive DP scans! Add it with a discount! Contact support@decisionpoint.com for more information!
Technical Analysis is a windsock, not a crystal ball.
Happy Charting! - Erin
Email: erin@decisionpoint.com

Erin Swenlin will be presenting at the The MoneyShow Las Vegas May 11-13, 2020! You'll have an opportunity to meet Erin and discuss the latest DecisionPoint news and Diamond Scans. The conference is free to attend or view online!
NOTE: The signal status reported herein is based upon mechanical trading model signals, specifically, the DecisionPoint Trend Model. They define the implied bias of the price index based upon moving average relationships, but they do not necessarily call for a specific action. They are information flags that should prompt chart review. Further, they do not call for continuous buying or selling during the life of the signal. For example, a BUY signal will probably (but not necessarily) return the best results if action is taken soon after the signal is generated. Additional opportunities for buying may be found as price zigzags higher, but the trader must look for optimum entry points. Conversely, exit points to preserve gains (or minimize losses) may be evident before the model mechanically closes the signal.
Helpful DecisionPoint Links (Can Be Found on DecisionPoint.com Links Page):
DecisionPoint Shared ChartList and DecisionPoint Chart Gallery
Price Momentum Oscillator (PMO)
Swenlin Trading Oscillators (STO-B and STO-V)