
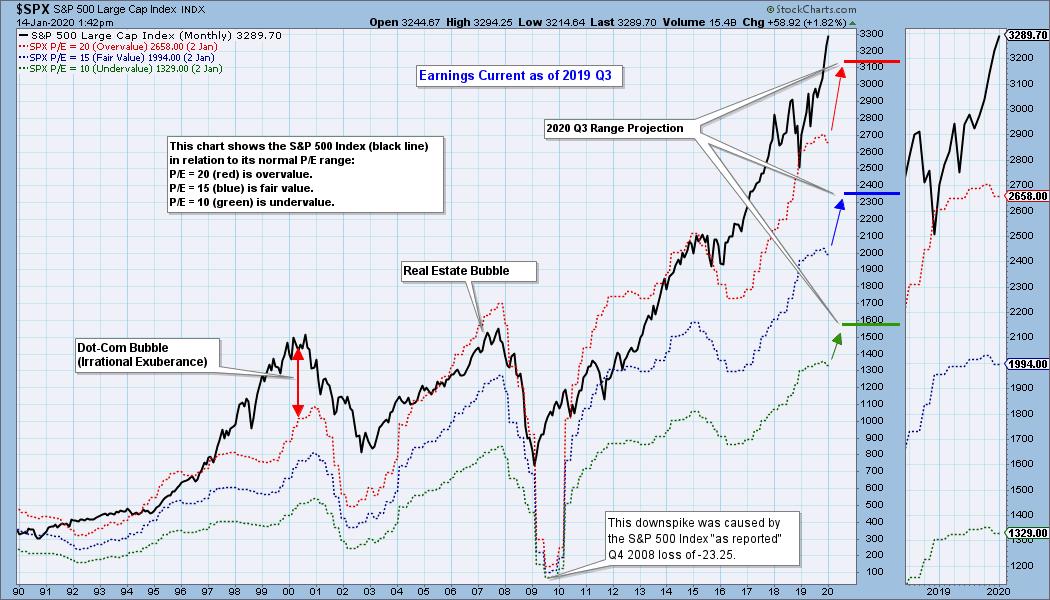
The S&P 500 preliminary earnings for 2019 Q3 are available, and based upon GAAP (Generally Accepted Accounting Principals) earnings, the S&P 500 is beyond overvalued. The following chart shows us the normal value range of the S&P 500 Index, indicating where the S&P 500 would have to be in order to have an overvalued P/E of 20 (red line), a fairly valued P/E of 15 (blue line) or an undervalued P/E of 10 (green line). There are three hash marks on the right side of the chart, which show where the range markers are projected be at the end of 2020 Q3. Since 2016, price has been well above the traditional value range, with the exception of the late 2018 price decline (which lowered the P/E to 19). Based upon estimated future earnings, the future value range (2020 Q3) is shown by the hash marks on the right. As we can see, the S&P 500 exceeds the top of the normal range by no small amount.
As investors we want to accomplish two basic things: (1) Determine the trend and condition of the market, and (2) select stocks that will ride that tide. The DecisionPoint Alert helps with the first step, and DecisionPoint Diamonds helps with the second. Go to DecisionPoint.com and SUBSCRIBE TODAY! (Charter Subscriber Discounts Available!)
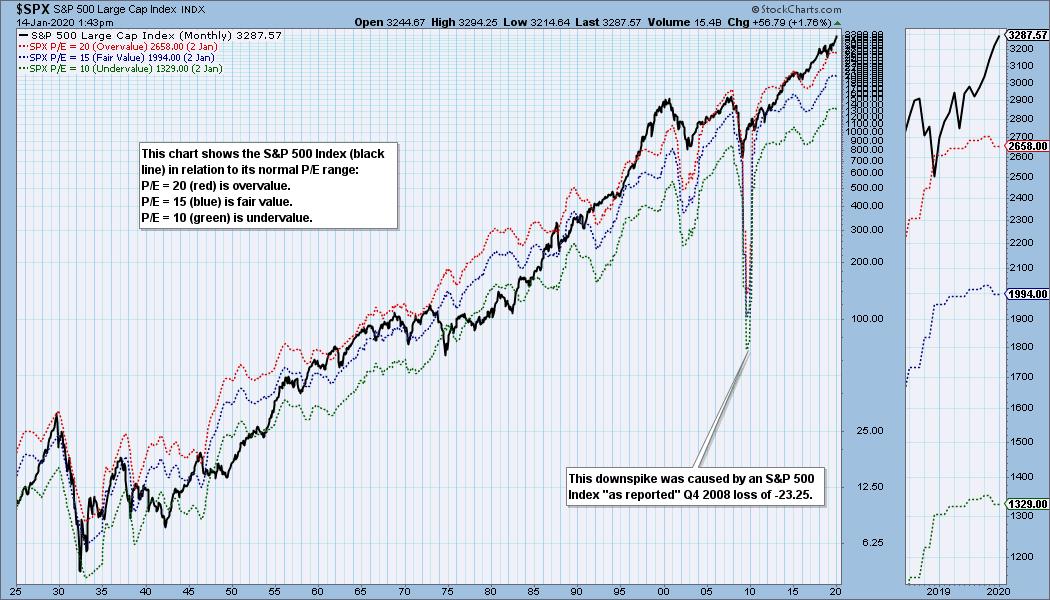
Historically, price has usually remained below the top of the normal value range (red line); however, since about 1998, it has not been uncommon for price to exceed normal overvalue levels. This may be the "new normal," but, really, it's not normal. The market hasn't been undervalued since 1984.
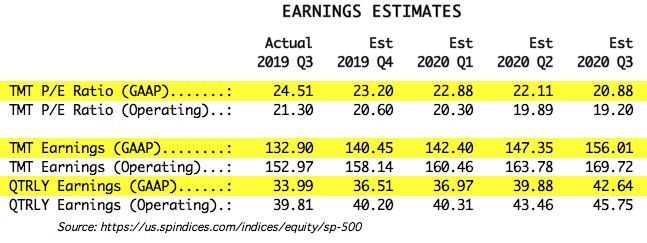
I use GAAP earnings as the reference for this article. Operating Earnings is the favorite of most of Wall Street, because it omits essential elements of real accounting to make the numbers look better. For me, a former accountant, using operating earnings is, to state it kindly, a form of cognitive dissonance.
The table below shows how earnings are expected to improve going forward, but the drop in P/E shown is only possible if price doesn't rise significantly. In the best case shown (2020 Q3), the market will be slightly above the top of the normal value range, but this depends upon price being about the same level as it is now. Not likely.
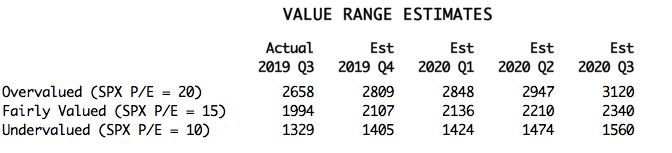
The following table shows where the colored bands will be based upon earnings estimates.
CONCLUSION: Historically, overvalued conditions leave the market vulnerable for a large correction or bear market, but P/E ratios are not a precise timing tool. They are just a way to see if fundamentals are favorable or not. These earnings charts are intended to provide a historical context for current earnings and to demonstrate that overvaluation is not your friend.
Technical Analysis is a windsock, not a crystal ball.
Helpful DecisionPoint Links:
DecisionPoint Alert Chart List
DecisionPoint Golden Cross/Silver Cross Index Chart List
DecisionPoint Sector Chart List
Price Momentum Oscillator (PMO)
Swenlin Trading Oscillators (STO-B and STO-V)