
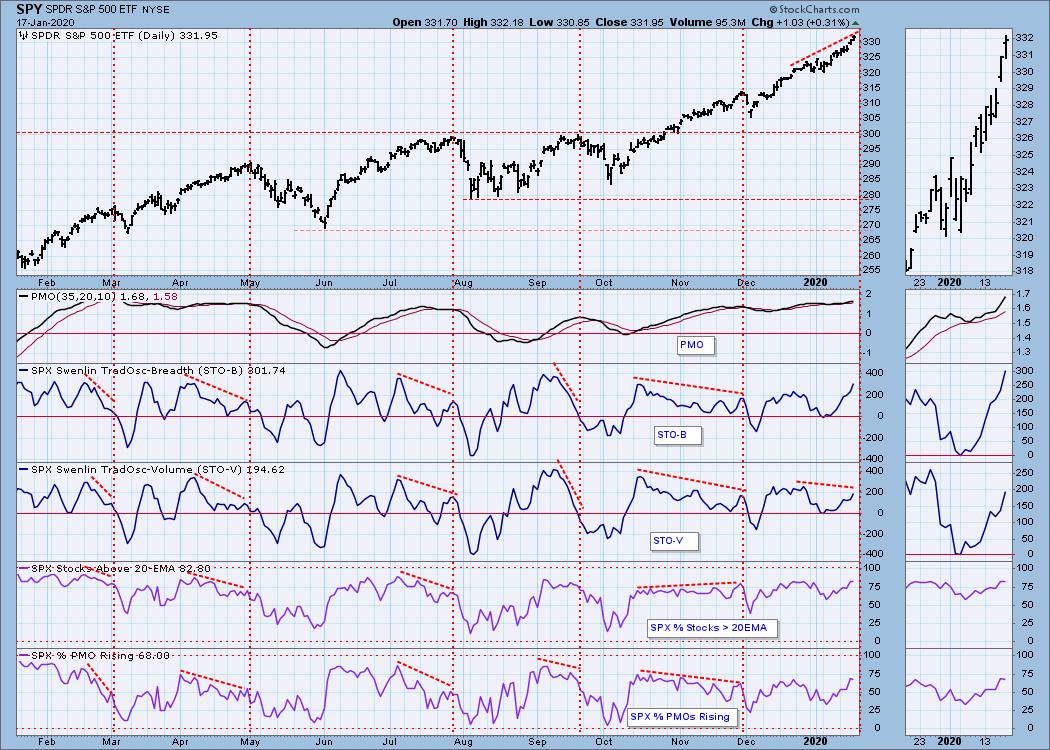
Last week there were many negative divergences, but the relentless rally has swatted them away. Below we can see that the percent of stocks above their 20EMA and 50EMA have equaled or exceeded last month's high, and they have erased the negative divergences about which I was concerned. Also, the percentage of stocks above their 200EMA equals its highest point in the last three years, so what could possibly be wrong now?
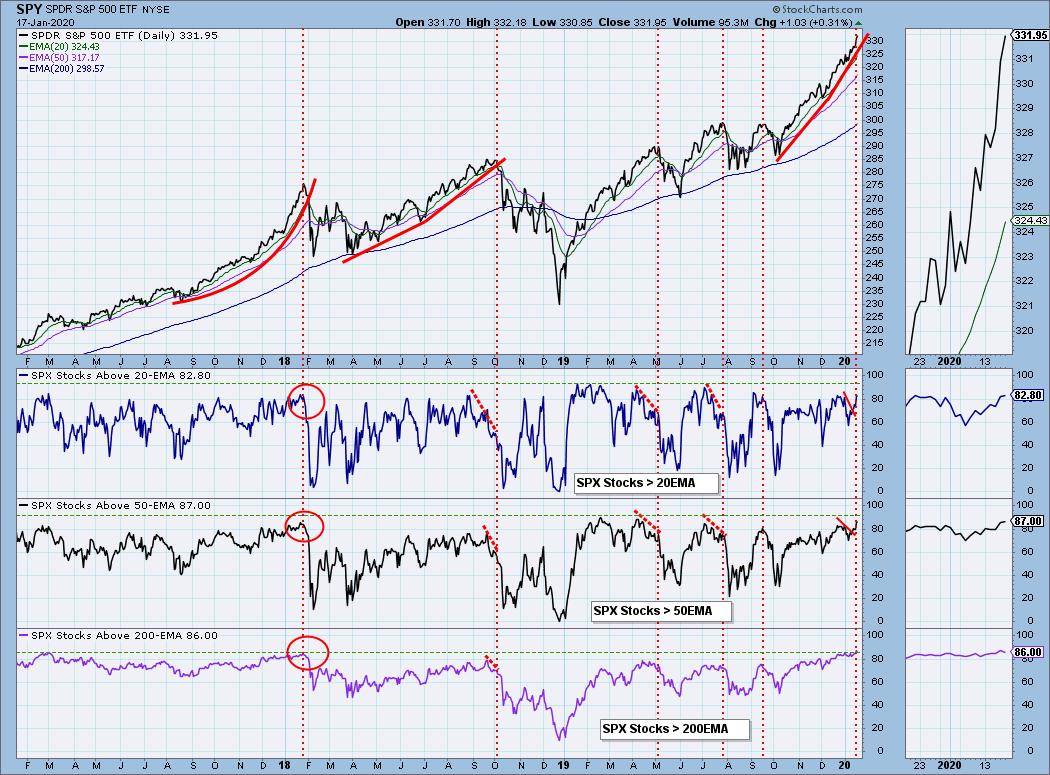
We can see that negative divergences warned us prior to three previous price tops, but the advance to the early-2018 market top was so vigorous that no negative divergences were able to develop. I'm afraid that is the condition in which we currently find ourselves. The rally is so strong that, for the time being, these indicators are of little value except to confirm the rally. Nevertheless, let's look for guidance from the other indicators we regularly track.
The DecisionPoint Alert Weekly Wrap presents an end-of-week assessment of the trend and condition of the Stock Market, the U.S. Dollar, Gold, Crude Oil, and Bonds. The DecisionPoint Alert daily report (Monday through Thursday) is abbreviated and gives updates on the Weekly Wrap assessments.
Watch the latest episode of DecisionPoint on StockCharts TV's YouTube channel here!
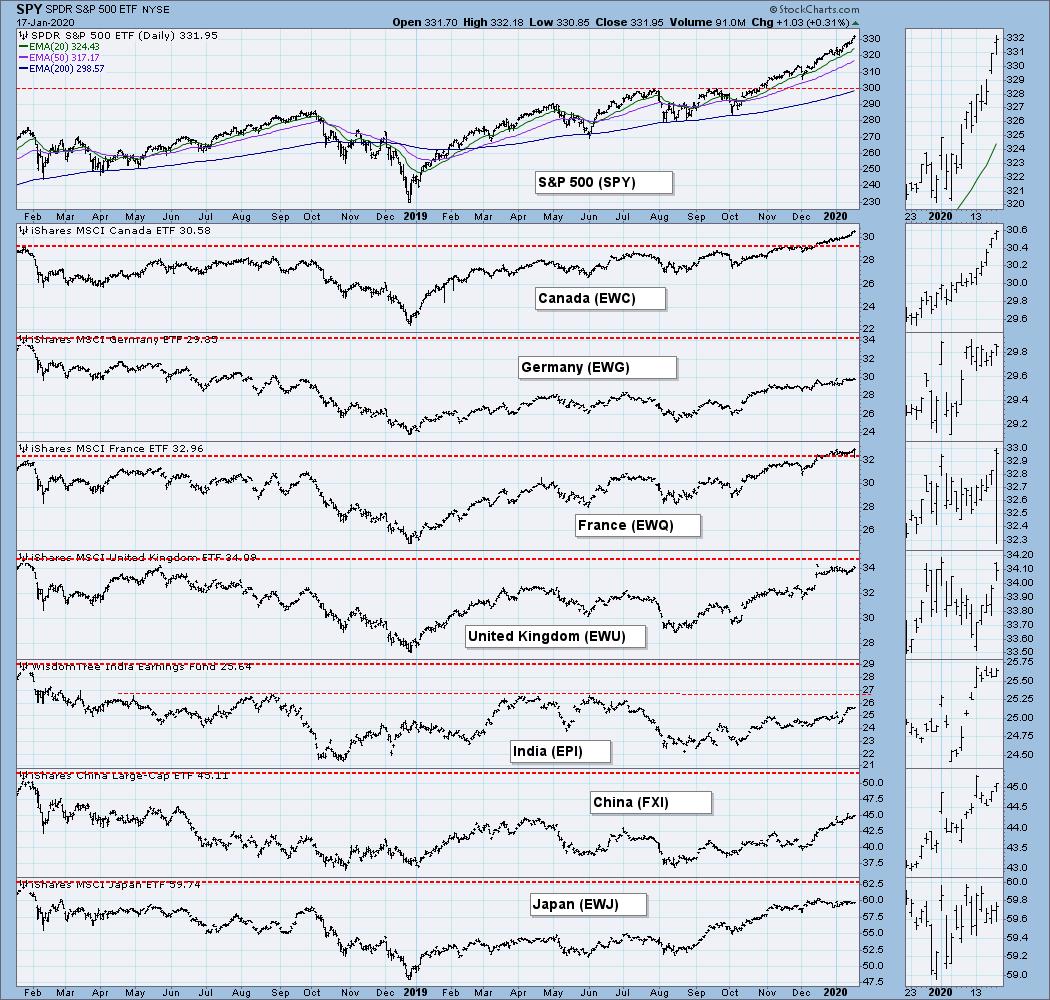
GLOBAL MARKETS
BROAD MARKET INDEXES
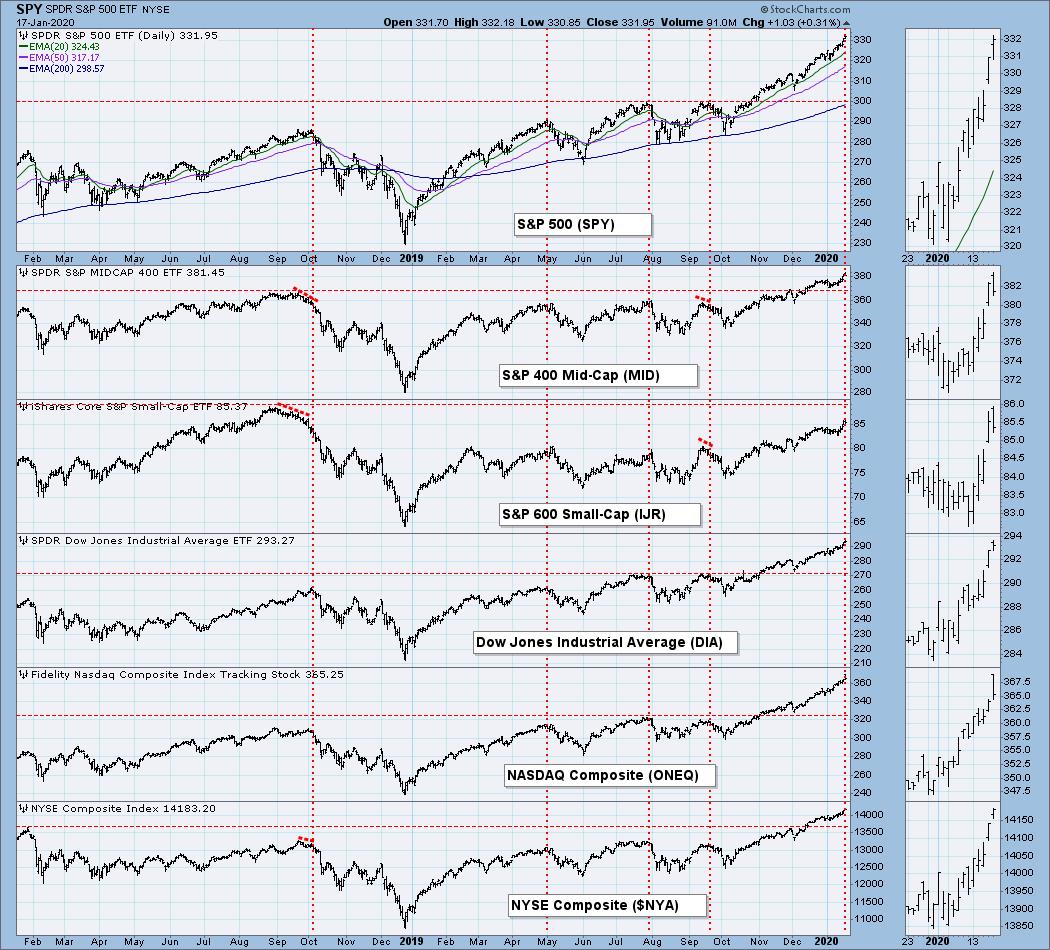
The S&P 600 Small-Cap and S&P 400 Mid-Cap Indexes have finally gotten in gear with the S&P 500, but the S&P 600 has yet to make new, all-time highs.
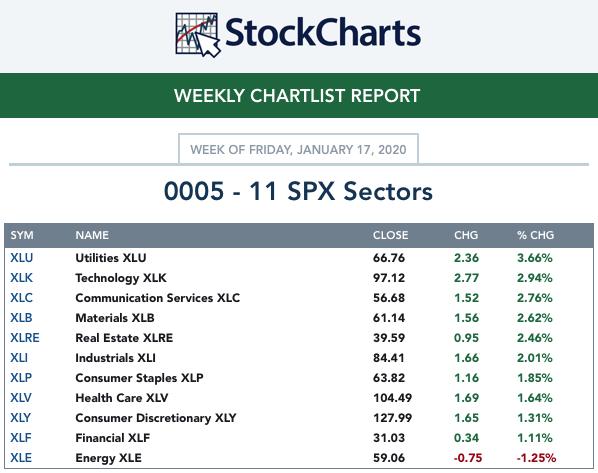
SECTORS
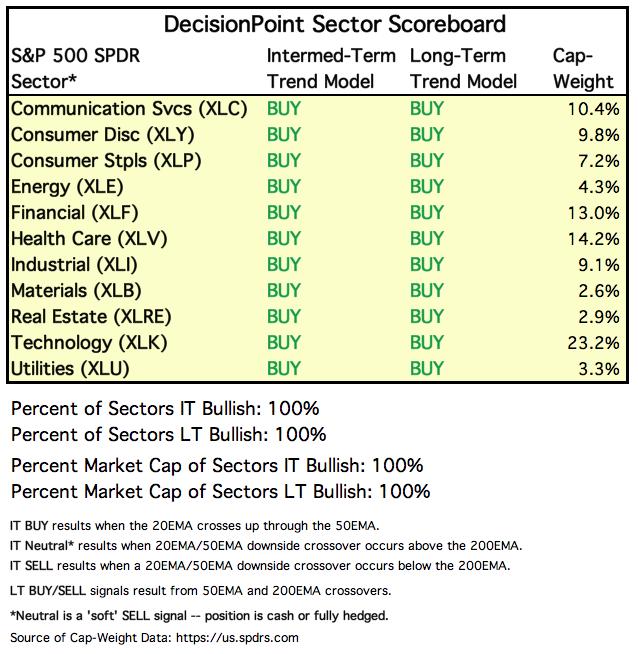
Each S&P 500 Index component stock is assigned to one, and only one, of 11 major sectors. This is a snapshot of the Intermediate-Term (Silver Cross) and Long-Term (Golden Cross) Trend Model signal status for those sectors.
Weekly Results:
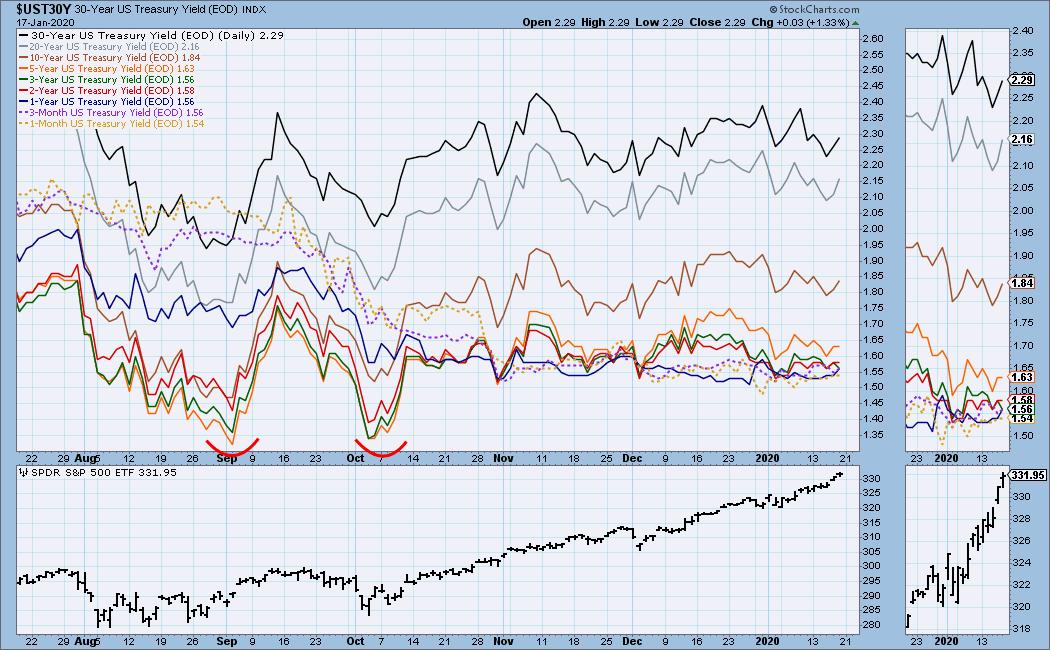
INTEREST RATES
This chart is included so we can monitor rate inversions. In normal circumstances the longer money is borrowed the higher the interest rate that must be paid. When rates are inverted, the reverse is true.
STOCKS
IT Trend Model: BUY as of 9/6/2019
LT Trend Model: BUY as of 2/26/2019
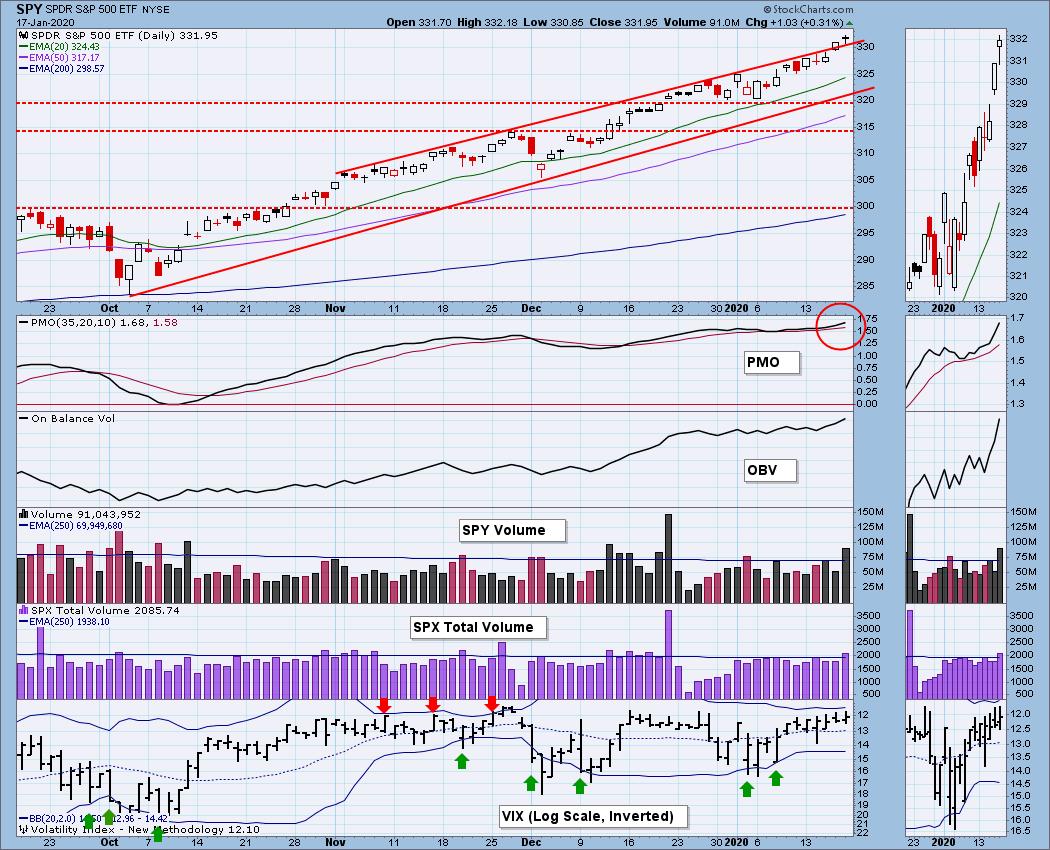
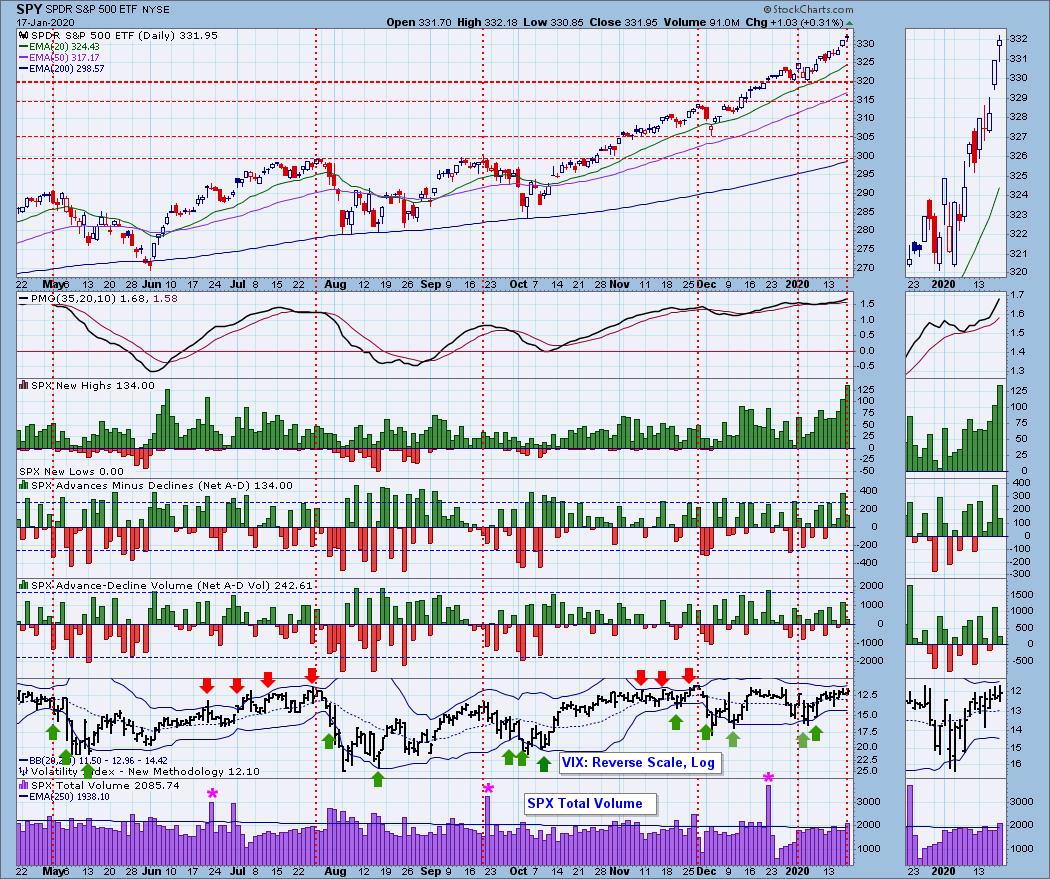
SPY Daily Chart: SPY has eased above the top of the rising trend channel. The VIX is near the top Bollinger Band, but it hasn't tapped it yet, keeping us waiting for a short-term sell signal. SPX Total Volume has been pretty solid -- the slight expansion on Friday probably has to do with options expiration.
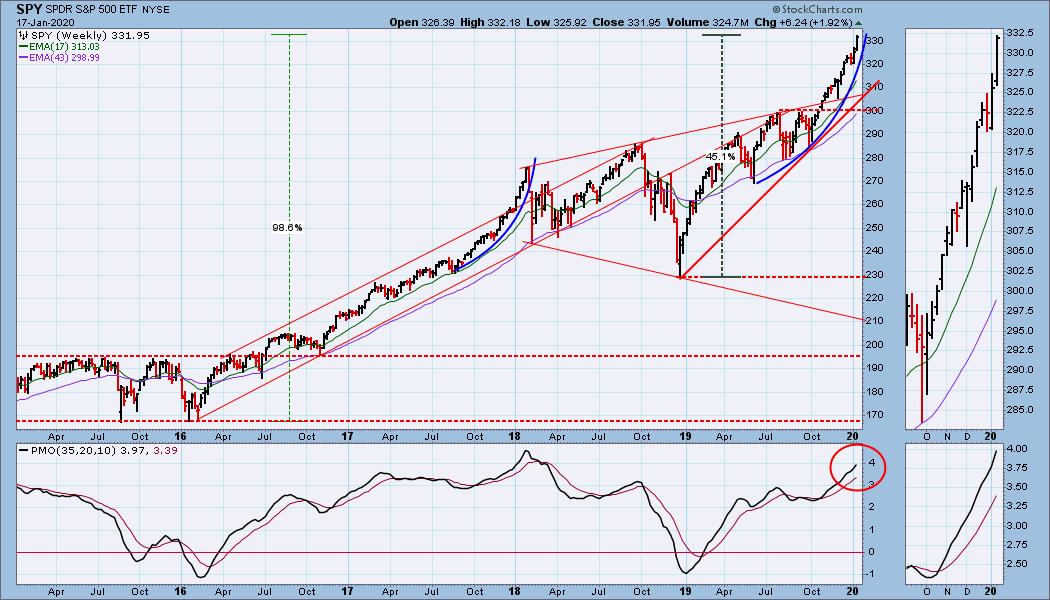
SPY Weekly Chart: As is frequently the case, we have to look at a weekly chart to see a developing parabolic. And there it is. The weekly PMO is very overbought.
Climactic Market Indicators: We got climactic new highs and net breadth readings on Thursday. Since the price trend is up, I'll call it an exhaustion climax, but new, all-time highs on Friday tends to undermine my confidence in that call.
Short-Term Market Indicators: We still have an STO-V negative divergence, but the others from last week are gone.
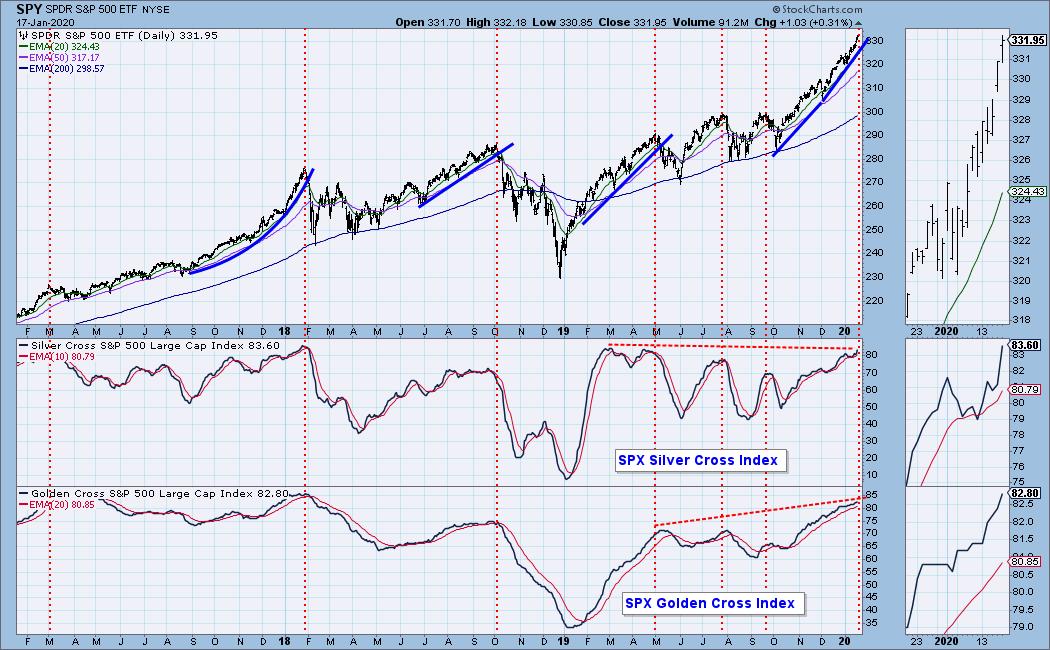
Intermediate-Term Market Indicators: The Golden Cross Index is confirming new price highs. The Silver Cross Index has a slight negative divergence, but this indicator has a finite range, and it is close enough to the top of the range that the divergence is of little significance.
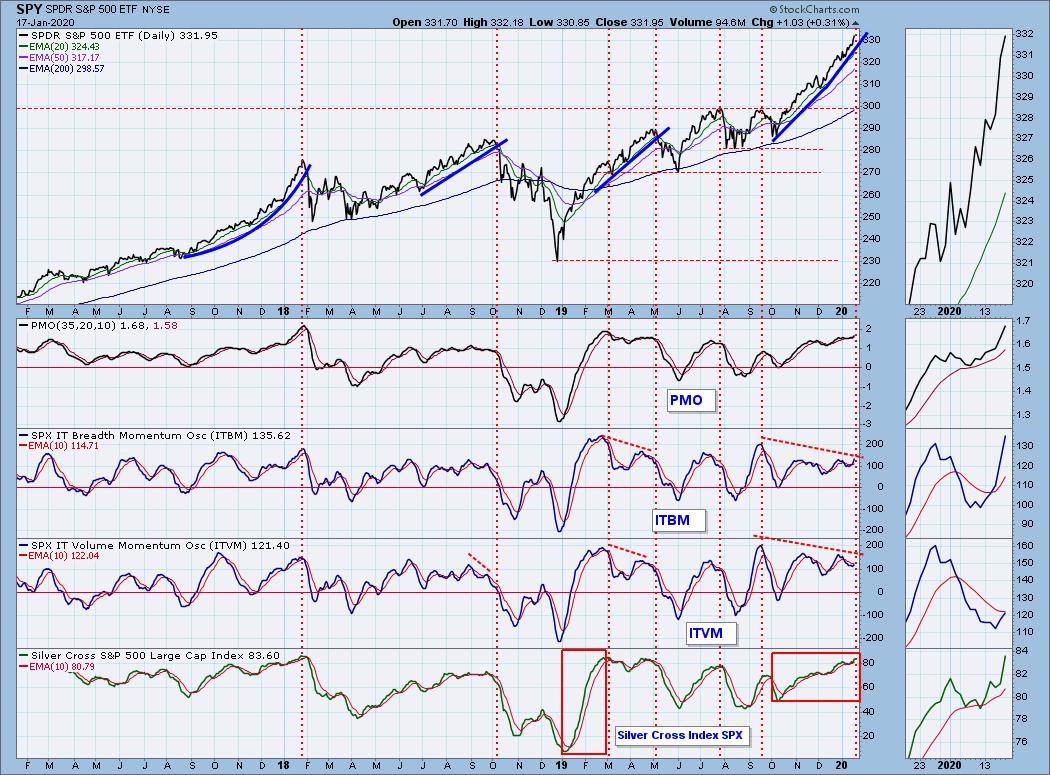
The negative divergences on the ITBM and ITVM tell us that breadth and volume have not been keeping up with price. The Silver Cross Index has confirmed the rally since the October price low, but it presents as "thin" compared to its robust up move in January 2019.
CONCLUSION: The trend is UP and the market condition is OVERBOUGHT. (Caps used for visibility, not emphasis.) Friday was the last trading day before options expiration.
Short-term negative divergences have for the most part evaporated, but the indicators are now overbought. Intermediate-term indicators on the chart above are either overbought or negatively diverging. In a bull market overbought conditions don't always need a price correction to clear them -- they can unwind internally. Nevertheless, price is clearly in a parabolic advance, and it is vulnerable for a breakdown similar to what we saw in early 2018. Predicting when a parabolic will break is difficult (impossible?), but the market is overbought in the short and intermediate term, so it more likely to happen sooner than later.
NOTE: The market is closed Monday for Martin Luther King Day. There will be no DP ALERT or Diamonds.
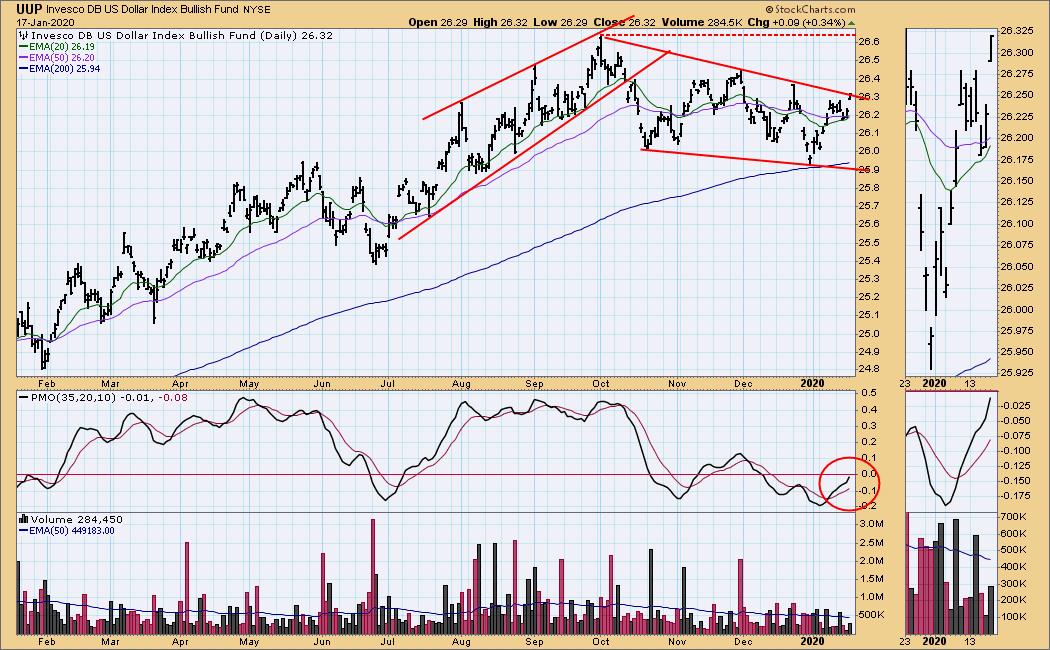
DOLLAR (UUP)
IT Trend Model: NEUTRAL as of 12/11/2019
LT Trend Model: BUY as of 5/25/2018
UUP Daily Chart: Price gapped up on Friday, nearly breaking above the top of the falling wedge pattern, a pattern we normally expect to resolve upward.
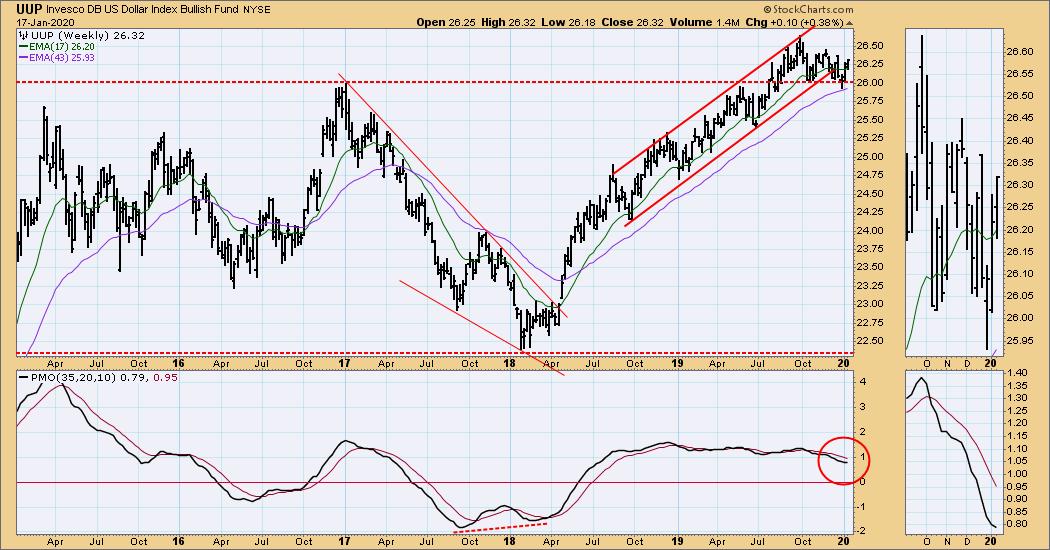
UUP Weekly Chart: Long-term support has held.
GOLD
IT Trend Model: BUY as of 12/26/2019
LT Trend Model: BUY as of 1/8/2019
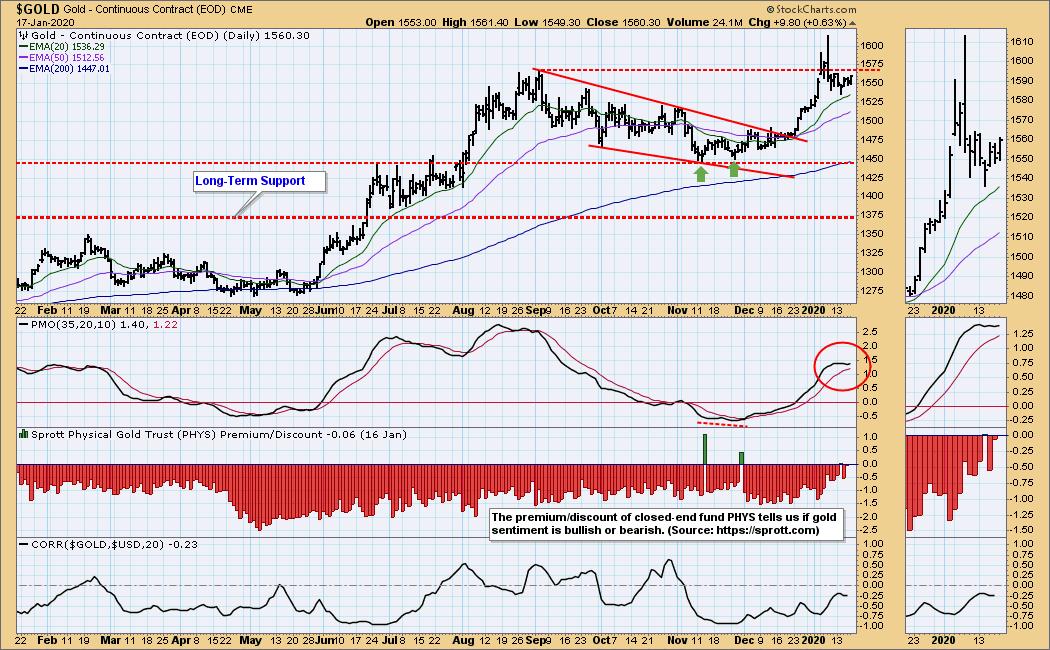
GOLD Daily Chart: Price is consolidating just below the line of resistance drawn across the September top, and the daily PMO looks as if it is turning up again.
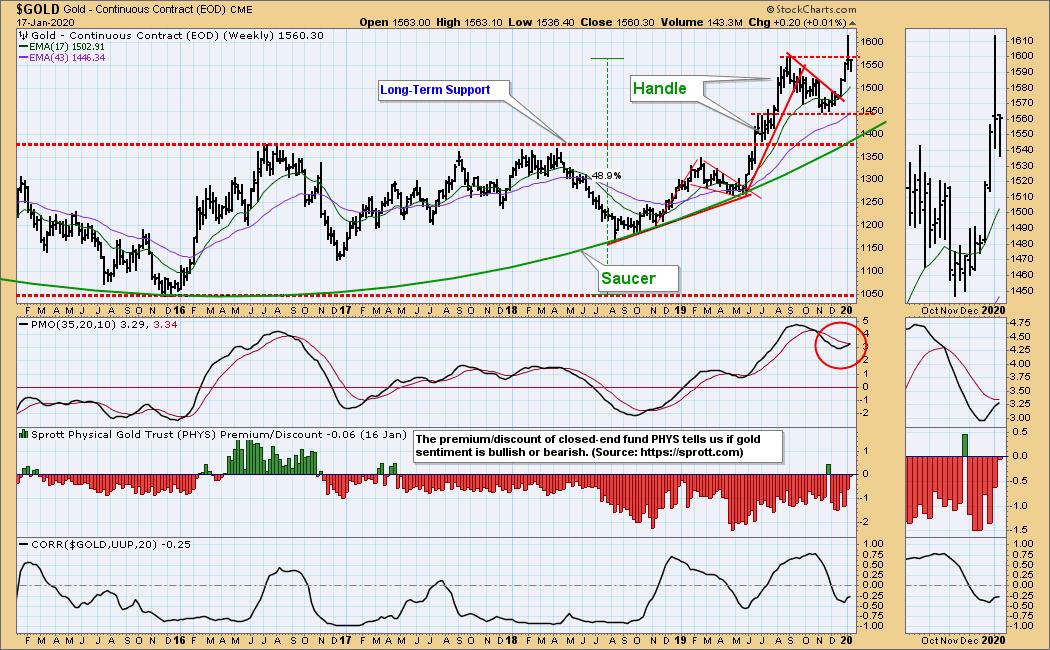
GOLD Weekly Chart: This chart continues to look bullish with the weekly PMO rising.
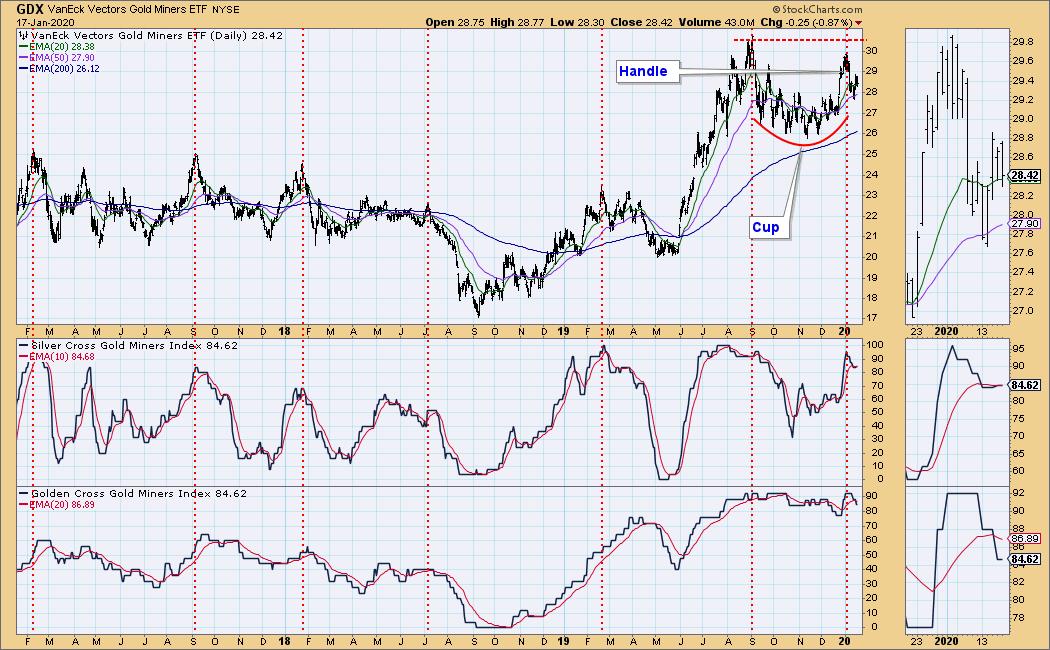
GOLD MINERS Golden and Silver Cross Indexes: The cup with handle is a bullish formation, and the Golden and Silver Cross indicators show strong participation in the IT and LT time frames.
CRUDE OIL (USO)
IT Trend Model: BUY as of 11/6/2019
LT Trend Model: BUY as of 12/16/2019
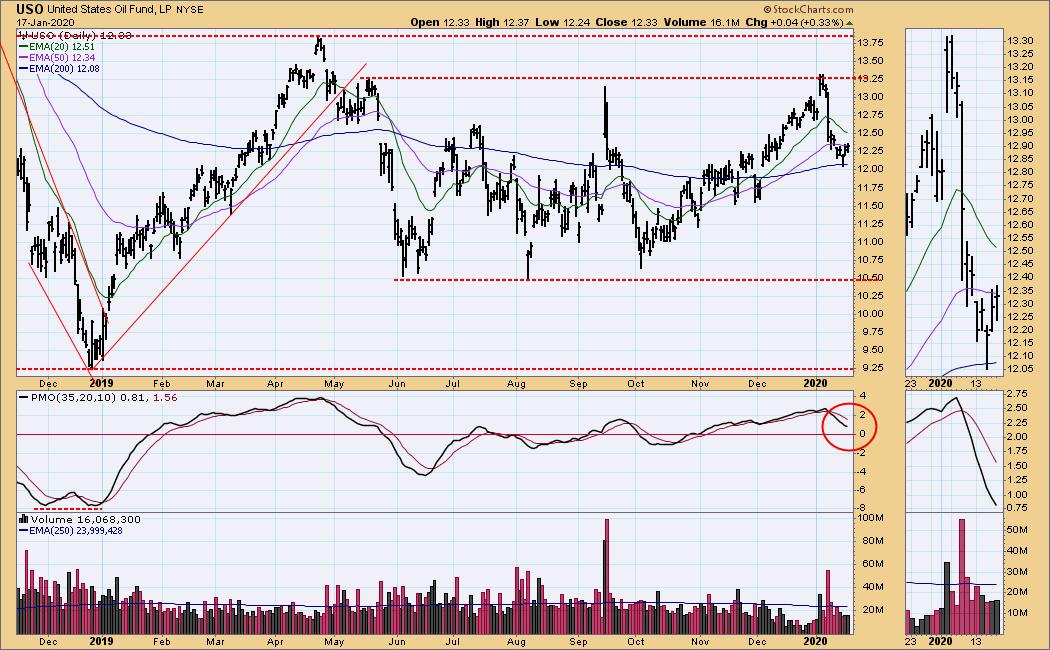
USO Daily Chart: The 20EMA has whipsawed above and below the 50EMA seven times in the one year shown. I see no reason why this won't continue.
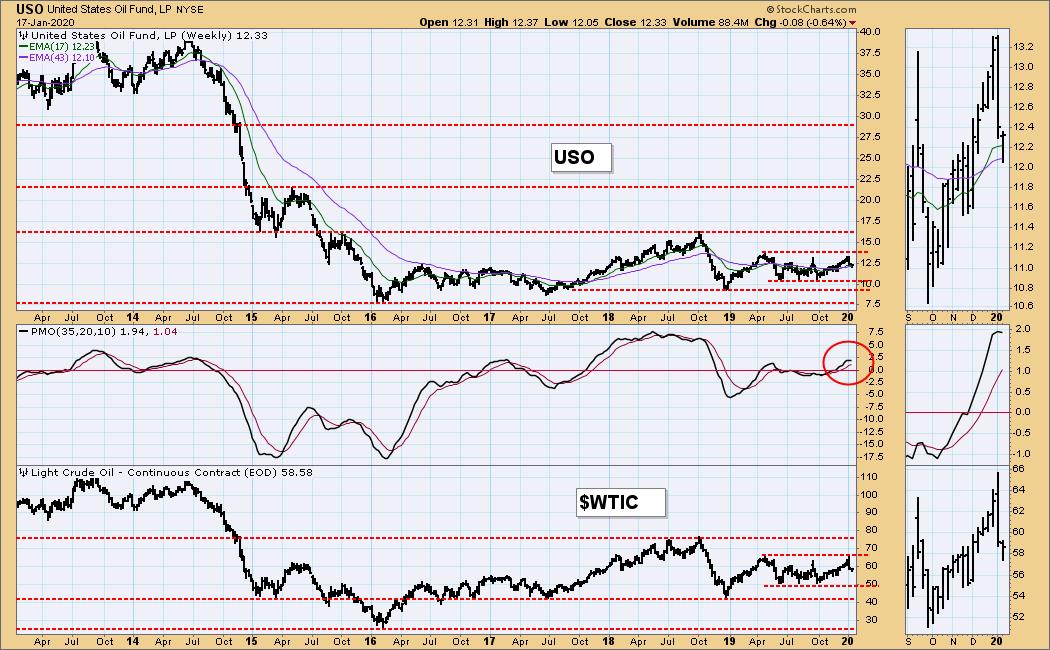
USO Weekly Chart: The basing pattern continues.
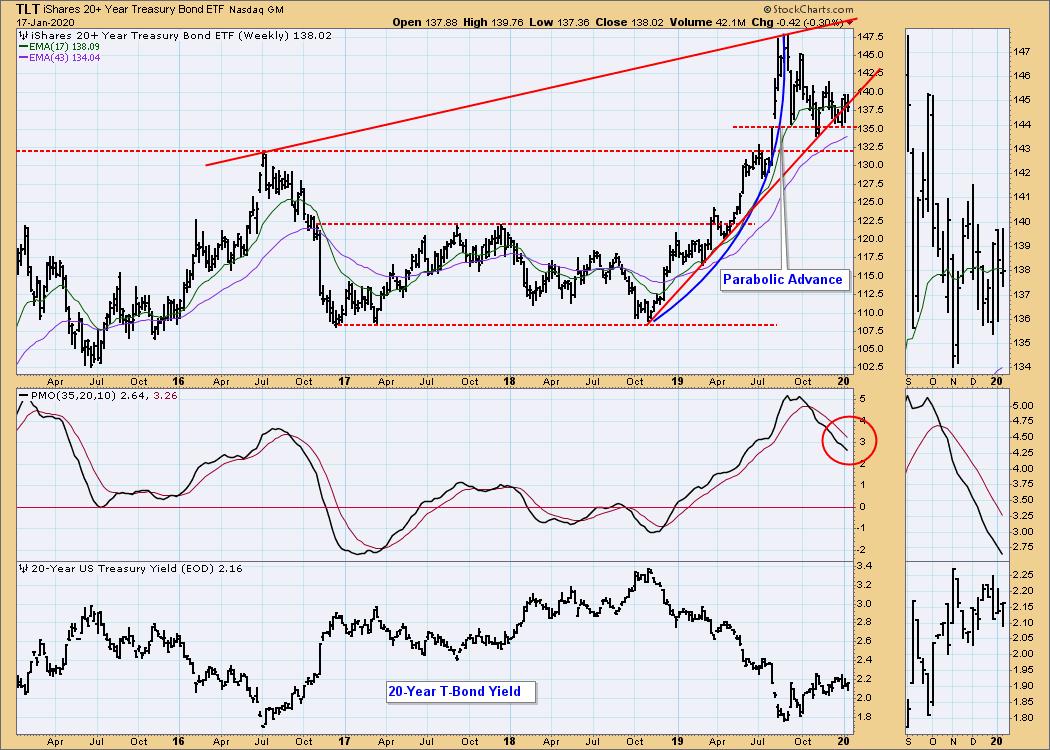
BONDS (TLT)
IT Trend Model: NEUTRAL as of 12/12/2019
LT Trend Model: BUY as of 1/2/2019
TLT Daily Chart: Price attempted a breakout this week, but has fallen back into the falling wedge formation.
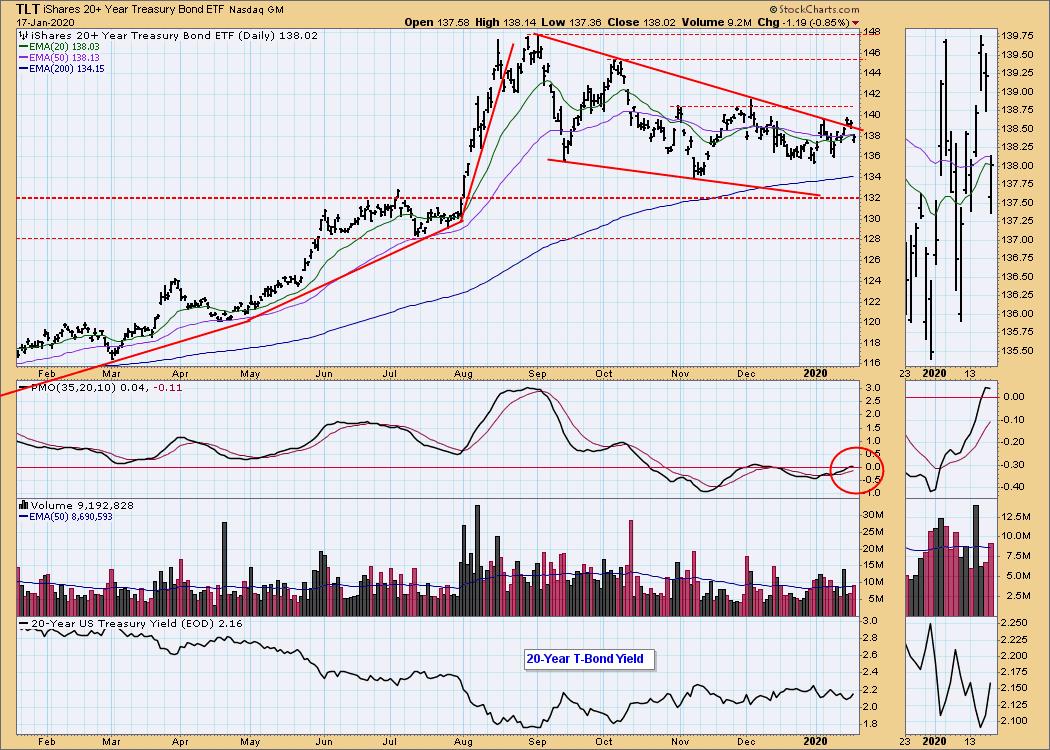
TLT Weekly Chart: The parabolic advance resolved down and sideways, and the rising trend line and horizontal support are preventing further decline.
Technical Analysis is a windsock, not a crystal ball.
Happy Charting! - Carl
NOTE: The signal status reported herein is based upon mechanical trading model signals, specifically, the DecisionPoint Trend Model. They define the implied bias of the price index based upon moving average relationships, but they do not necessarily call for a specific action. They are information flags that should prompt chart review. Further, they do not call for continuous buying or selling during the life of the signal. For example, a BUY signal will probably (but not necessarily) return the best results if action is taken soon after the signal is generated. Additional opportunities for buying may be found as price zigzags higher, but the trader must look for optimum entry points. Conversely, exit points to preserve gains (or minimize losses) may be evident before the model mechanically closes the signal.
Helpful DecisionPoint Links:
DecisionPoint Alert Chart List
DecisionPoint Golden Cross/Silver Cross Index Chart List
DecisionPoint Sector Chart List
Price Momentum Oscillator (PMO)
Swenlin Trading Oscillators (STO-B and STO-V)