
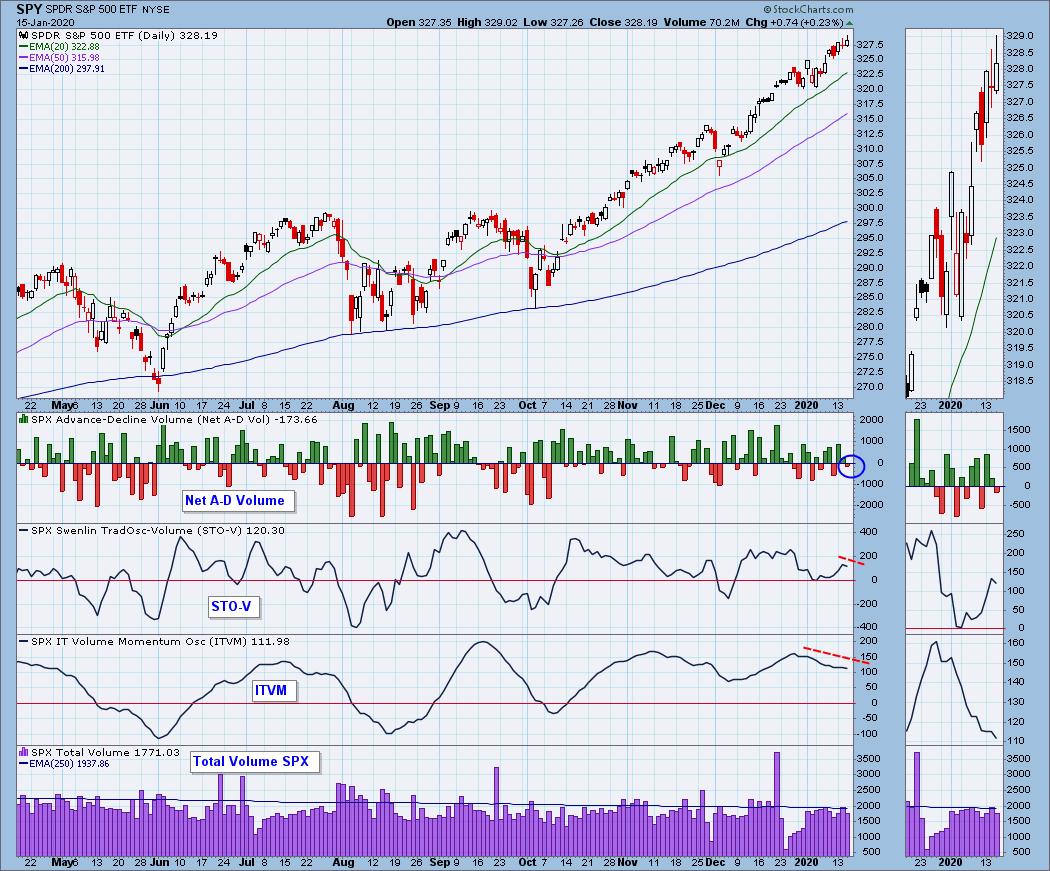
The market continues to move higher and most of our indicators are confirming in the shorter term. As I looked at our primary indicator charts I realized that the volume indicators aren't looking so hot. On today's rally that logged a new intraday all-time high, we actually can observe that the Net A-D volume was negative today. Additionally, the STO-V turned down. The ITVM has yet to turn up. Volume isn't 'drying up' given SPX total volume is comparable to the last few weeks. I prefer to see breakout volume when all-time highs are being challenged, and today it stayed below the 250-EMA today.
TODAY'S Action:
The DecisionPoint Alert Weekly Wrap presents an end-of-week assessment of the trend and condition of the stock market (S&P 500), the U.S. Dollar, Gold, Crude Oil, and Bonds. Monday through Thursday the DecisionPoint Alert daily report is abbreviated and covers changes for the day.
Watch the latest episode of DecisionPoint on StockCharts TV's YouTube channel here!
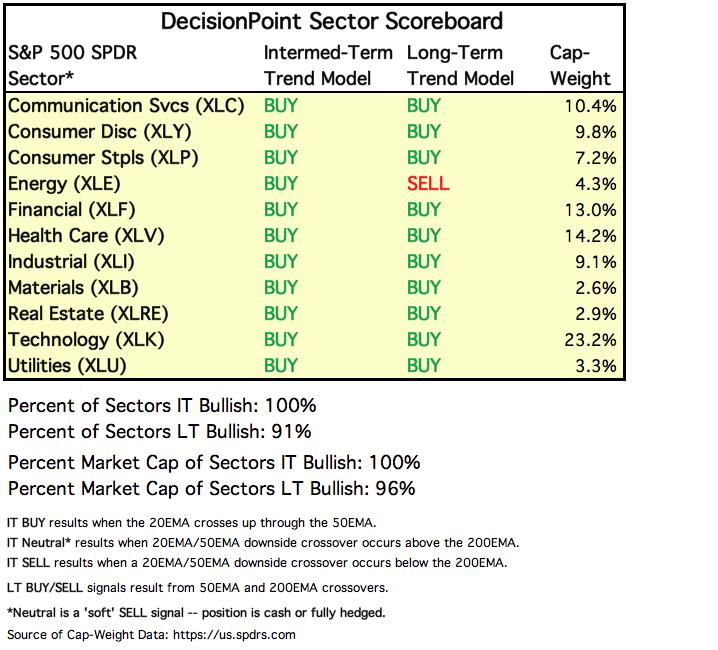
SECTORS
SIGNALS:
Each S&P 500 Index component stock is assigned to one, and only one, of 11 major sectors. This is a snapshot of the Intermediate-Term (Silver Cross) and Long-Term (Golden Cross) Trend Model signal status for those sectors.
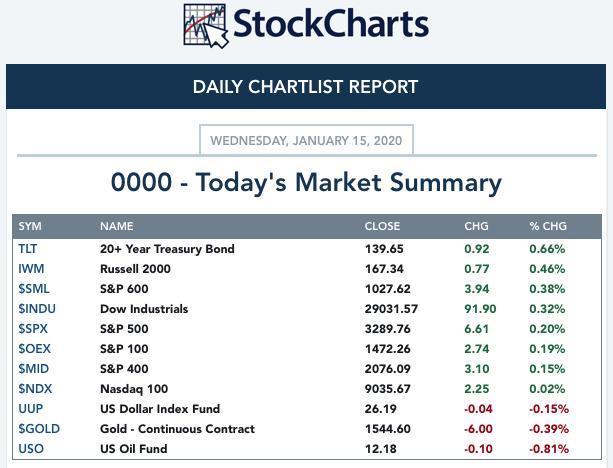
TODAY'S RESULTS:
STOCKS
IT Trend Model: BUY as of 9/6/2019
LT Trend Model: BUY as of 2/26/2019
SPY Daily Chart: The PMO is continuing to rise, but it is getting overbought. Typically the range for the PMO on the SPY is between -2 and +2; today's reading is 1.59. The OBV continues to confirm the rally so volume as I noted above isn't horrible, just mediocre.
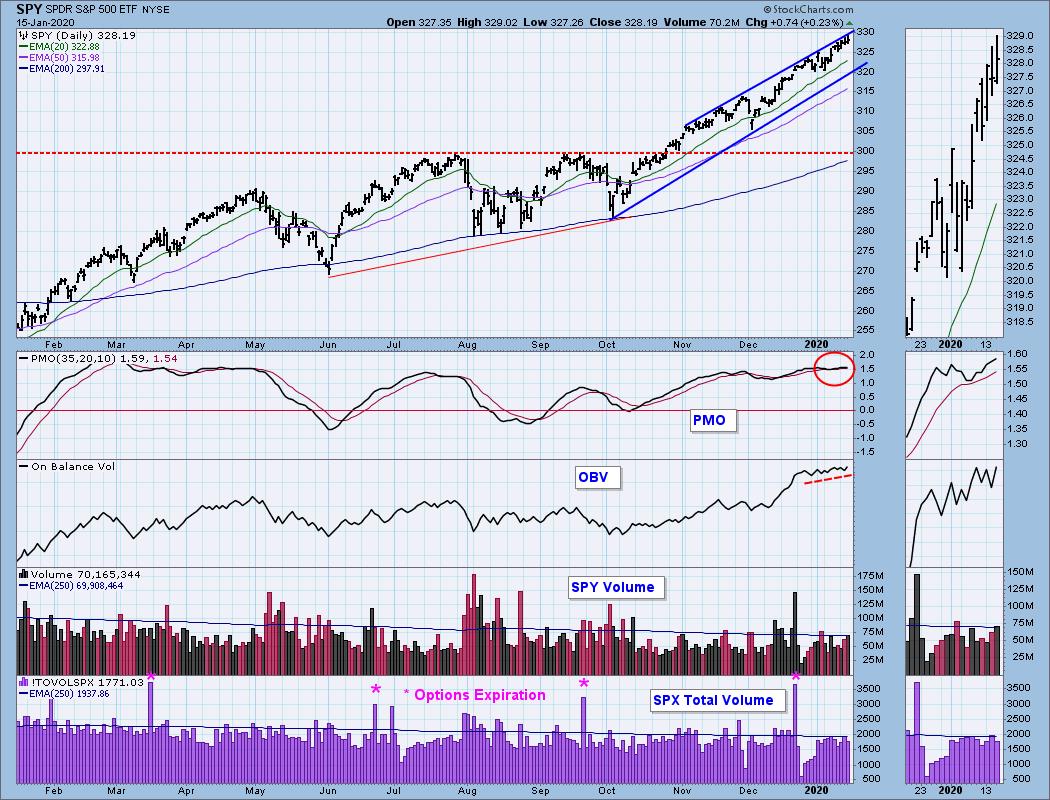
Climactic Market Indicators: The squeeze is still on for the VIX. It hasn't penetrated the upper Bollinger Band so I think we should still look for short-term upside. New Highs are still on the climactic side and I believe that also bodes well in the very short term. As I pointed out earlier, I don't like to see negative readings on the Net A-D Volume, but they aren't climactic to negative side.
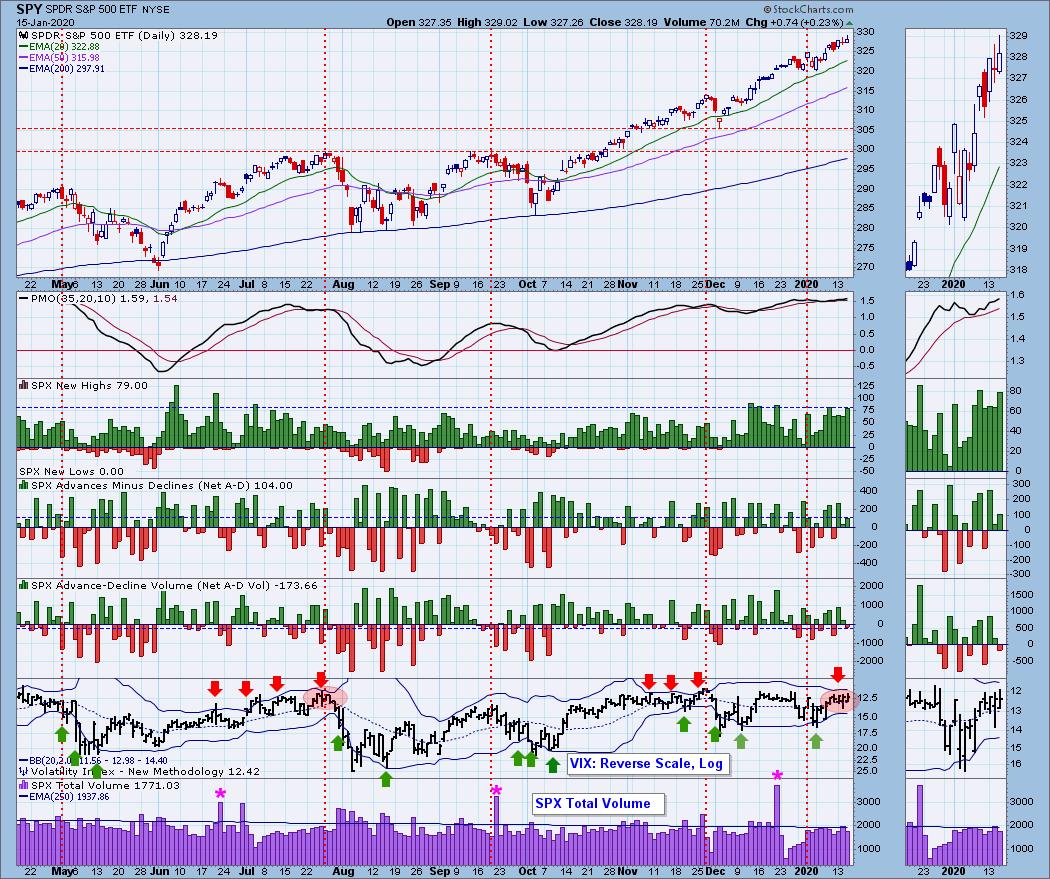
Short-Term Market Indicators: The STO-B decelerated a bit, but the STO-V turned down. I think it is interesting, but overall these indicators are rising and improving. I even note that we are seeing a small expansion in stocks above their 20-EMA and stock on PMO BUY signals.
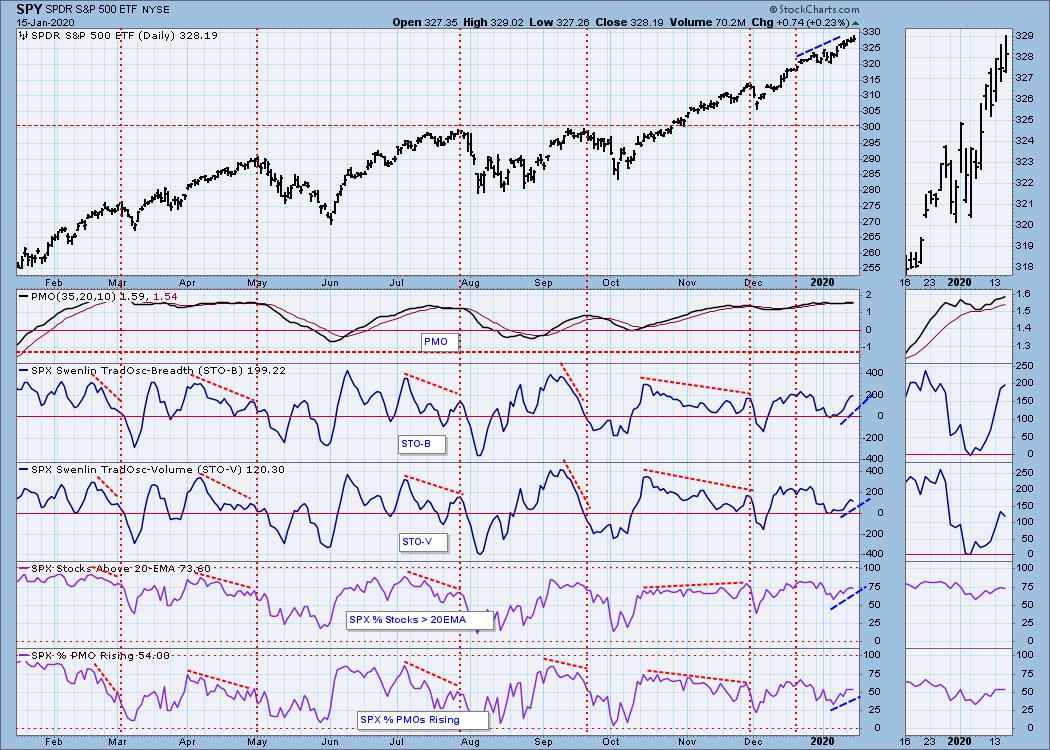
Intermediate-Term Market Indicators: SCI ticked lower today causing a negative divergence with price tops. Just one more thing in the intermediate term that looks a little fishy on a rally.
The ITVM is not confirming the ITBM's positive crossover.
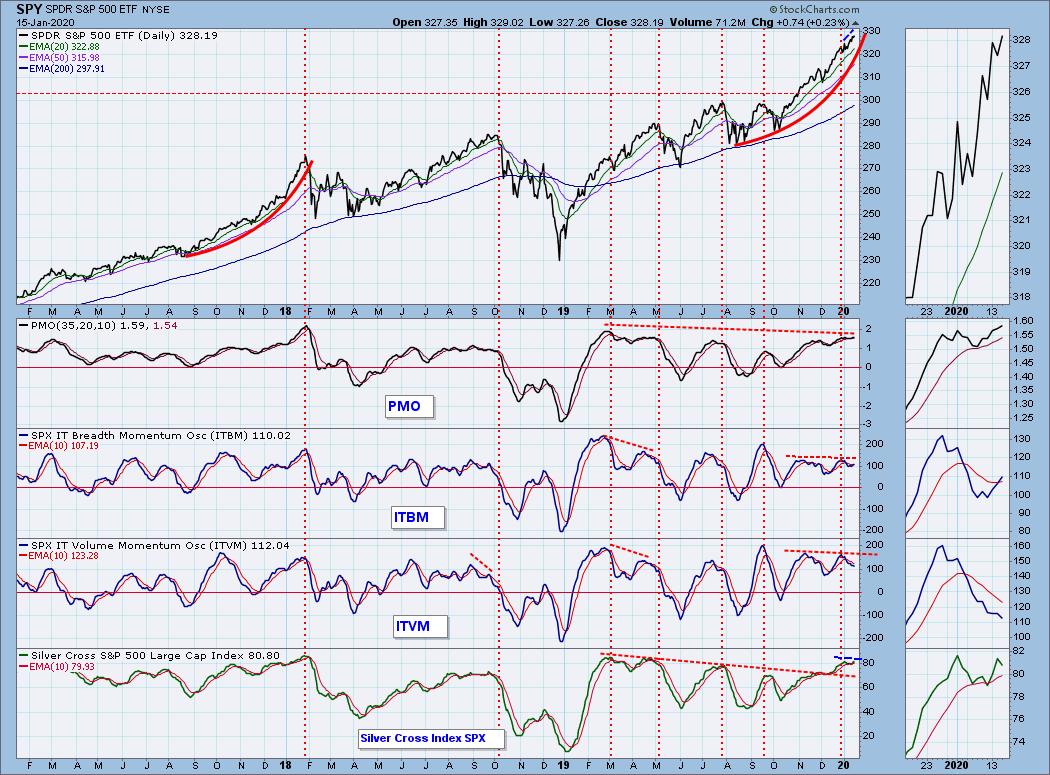
CONCLUSION: The trend of the market is clearly bullish right now and I'm not going to argue against it given the bullish ST indicators, the VIX is still within the top side of its Bollinger Bands and the OBV is confirming the rising trend. The market is overbought given the PMO is moving to the top of its range and there are negative divergences out there that haven't cleared. Overall I'm still short-term bullish but unconvinced in the intermediate term.
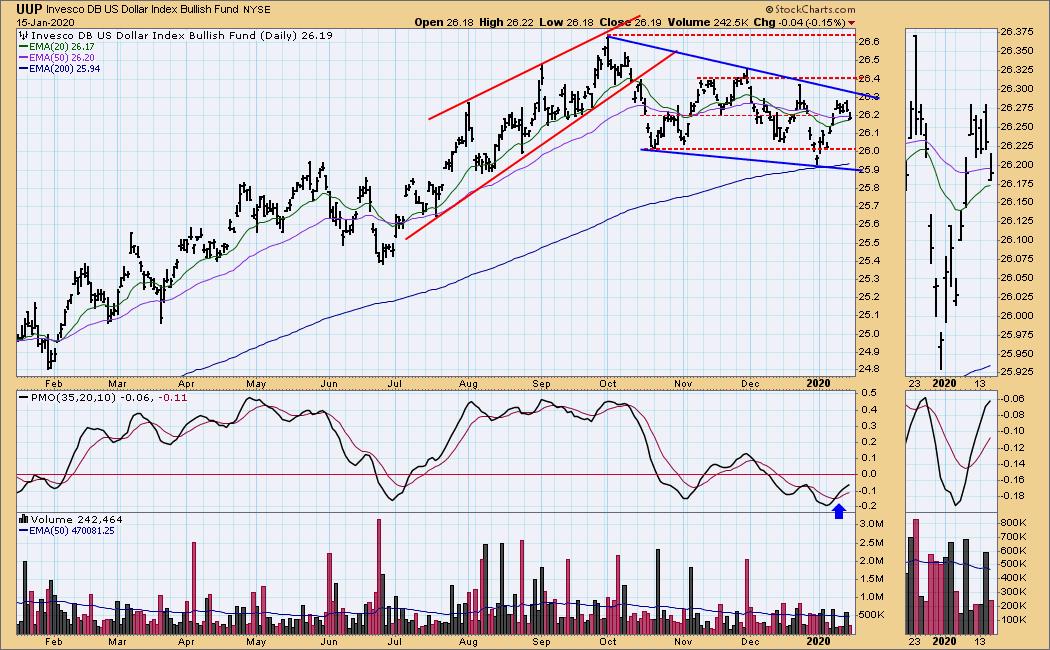
DOLLAR (UUP)
IT Trend Model: NEUTRAL as of 12/11/2019
LT Trend Model: BUY as of 5/25/2018
UUP Daily Chart: Despite the conditions being ripe for a rally, the Dollar dropped today. It remains above the 20-EMA and the PMO is very positive so I'm still expecting an upside breakout from the descending wedge.
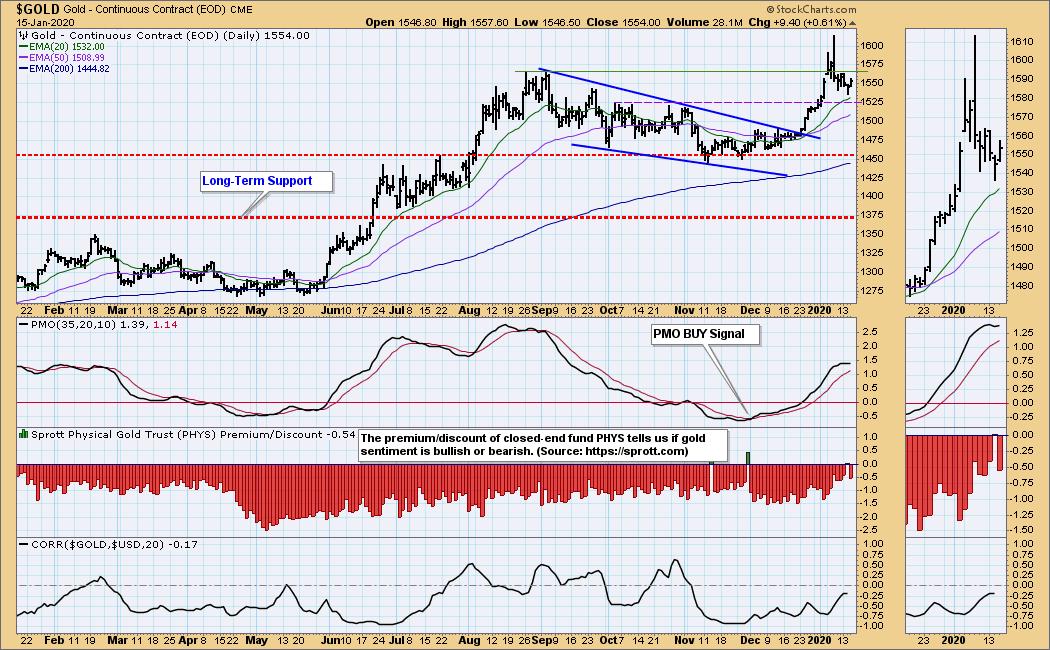
GOLD
IT Trend Model: BUY as of 12/26/2019
LT Trend Model: BUY as of 1/8/2019
GOLD Daily Chart: With the Dollar dropping and interest beginning to return to Gold as noted by the premium logged yesterday on PHYS, Gold rose .61%. The PMO is now beginning to turn back up. This is exactly what we wanted to see: a pullback on Gold that would negate the parabolic rally and keep the PMO from getting overbought. I expect to see more good things from Gold. Currently the short-term correlation between Gold and the Dollar is close to zero which means that Gold could rise even as the Dollar rises.
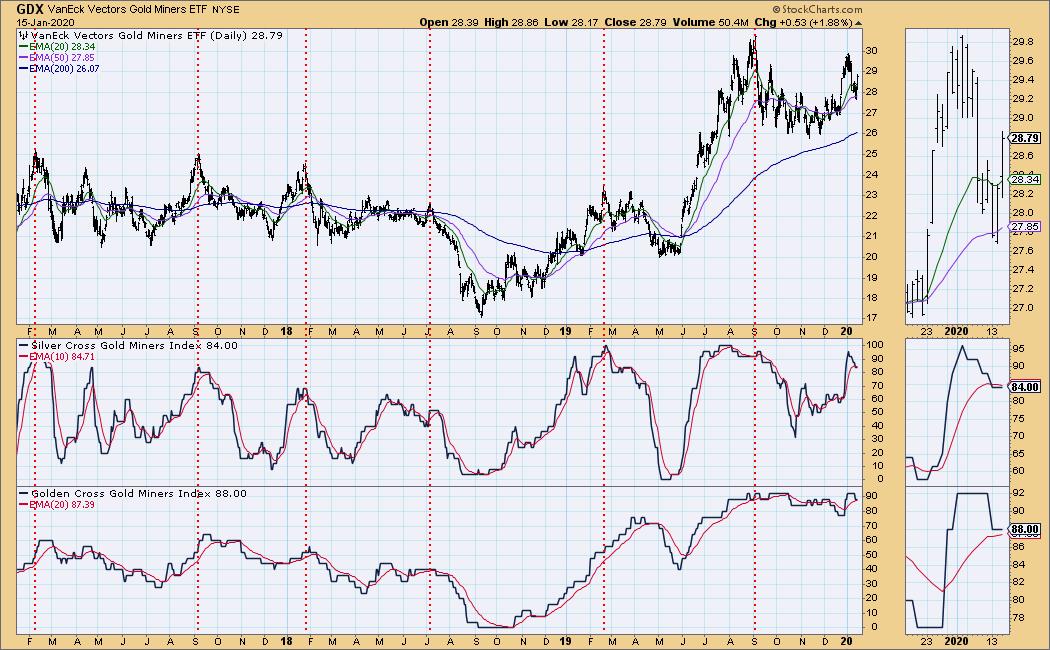
GOLD MINERS Golden and Silver Cross Indexes: Very nice rally going on for GDX, yesterday it was up well over 1% and today it was up 1.88%. Price bounced off the 50-EMA and could continue higher from here.
CRUDE OIL (USO)
IT Trend Model: BUY as of 11/6/2019
LT Trend Model: BUY as of 12/16/2019
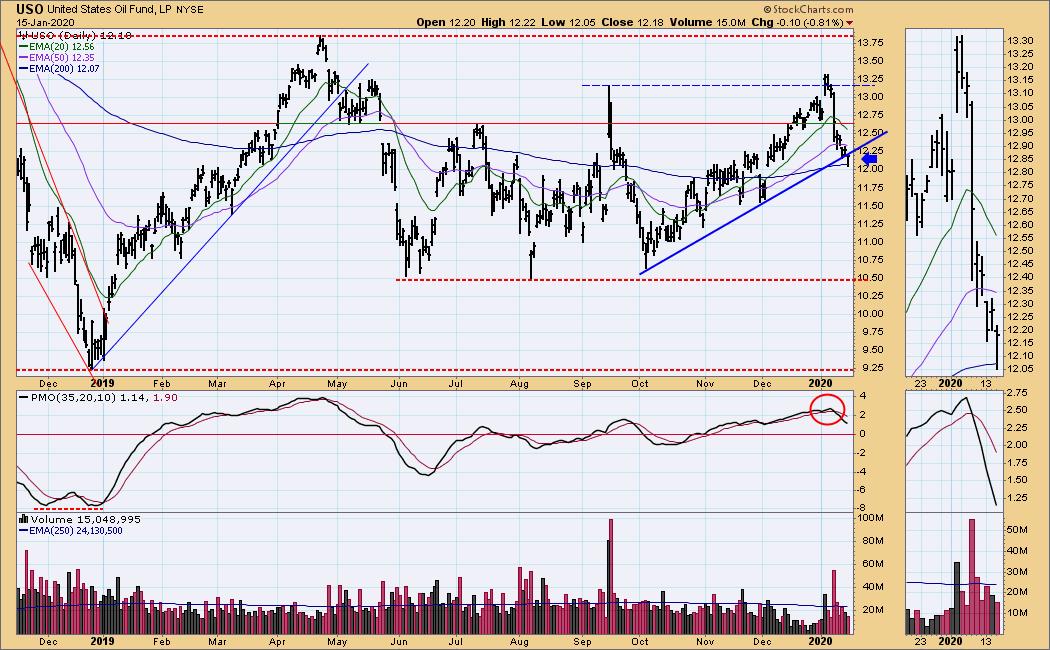
USO Daily Chart: Oil lost its rising trend, but the breakdown was far from the 'decisive' 3%. The 200-EMA held up as support and there is a long tail on today's OHLC bar which gives us a hammer on a candlestick chart. That's a bullish candlestick. I do see a terrible looking PMO, but volume is contracting. If the 200-EMA can hold, I'll start looking for higher prices on Oil. If it fails...look out below.
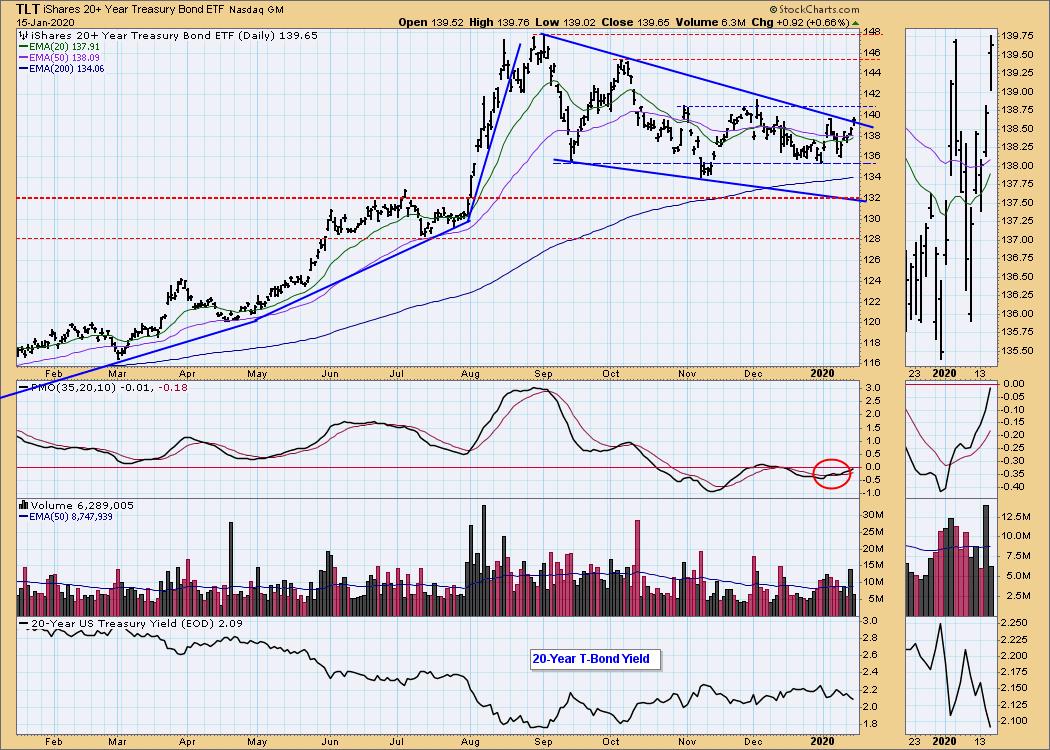
BONDS (TLT)
IT Trend Model: NEUTRAL as of 12/12/2019
LT Trend Model: BUY as of 1/2/2019
TLT Daily Chart: TLT is giving it a go on executing the bullish falling wedge. I'm looking for higher prices to challenge the top of the current trading range.

**Don't miss any of the DecisionPoint commentaries! Go to the "Notify Me" box toward the end of this blog page to be notified as soon as they are published.**
Technical Analysis is a windsock, not a crystal ball.
Happy Charting! - Erin
Email: erin@decisionpoint.com

Erin Swenlin will be presenting at the The MoneyShow Las Vegas May 11-13, 2020! You'll have an opportunity to meet Erin and discuss the latest DecisionPoint news and Diamond Scans. The conference is free to attend or view online!
NOTE: The signal status reported herein is based upon mechanical trading model signals, specifically, the DecisionPoint Trend Model. They define the implied bias of the price index based upon moving average relationships, but they do not necessarily call for a specific action. They are information flags that should prompt chart review. Further, they do not call for continuous buying or selling during the life of the signal. For example, a BUY signal will probably (but not necessarily) return the best results if action is taken soon after the signal is generated. Additional opportunities for buying may be found as price zigzags higher, but the trader must look for optimum entry points. Conversely, exit points to preserve gains (or minimize losses) may be evident before the model mechanically closes the signal.
Helpful DecisionPoint Links (Can Be Found on DecisionPoint.com Links Page):
DecisionPoint Shared ChartList and DecisionPoint Chart Gallery
Price Momentum Oscillator (PMO)
Swenlin Trading Oscillators (STO-B and STO-V)