
 Recently, I received an email from a reader who basically said he found that, if he traded in a bull market, he made money, whereas when he traded in a choppy or bear market, he lost money. The lesson learned is that, despite the best attempts to find the best stocks, your odds of success are much lower if the trend is not in your favor. While we aren't in a bear market, we are in a market that has lacked a solid uptrend all summer.
The Diamonds I present today are mostly small-caps with one mid-cap thrown in. While I like them all, I remain cautious about adding to my positions, given I'm more bearish right now than bullish. However, every Diamond Report gives you the insight into my analysis process and remains, of course, a "must-read"!
I love to get your feedback on these reports, so shoot me an email at erinh@stockcharts.com. I read every one of them!
Welcome to "DecisionPoint Daily Diamonds," a newsletter in which I highlight five "diamonds in the rough" taken from the results of one of my DecisionPoint scans. Remember, these are not recommendations to buy or sell, but simply stocks that I found interesting. The objective is to save you the work of the initial, tedious culling process, but you need to apply your own analysis to see if these stocks pique your interest as well. There are no guaranteed winners here!
Current Market Outlook:
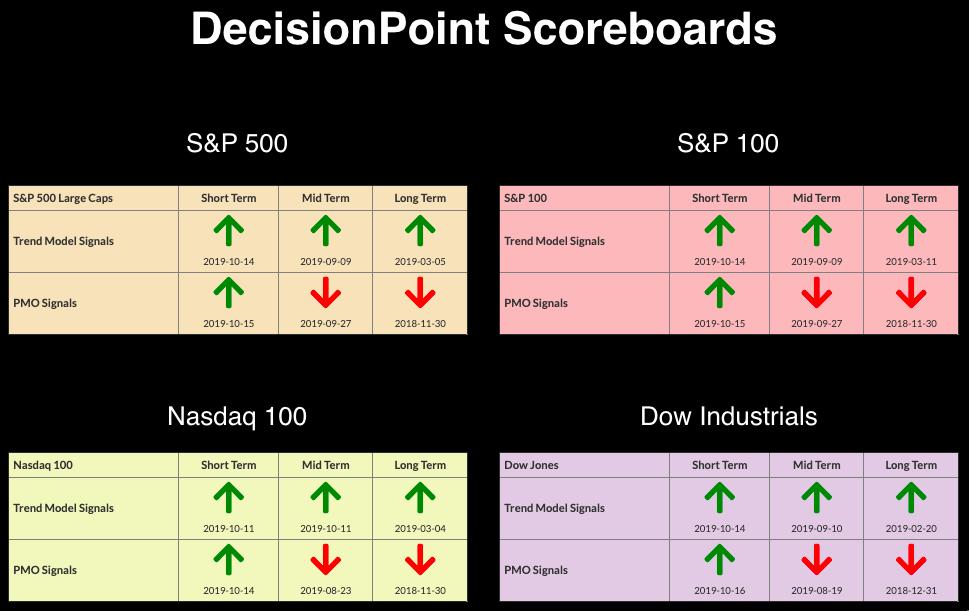
Market Trend: Currently, we have Trend Model BUY signals in all three timeframes on the DP Scoreboard Indexes.
Market Condition: The market is overbought and struggling to reach all-time highs, despite Price Momentum Oscillator (PMO) BUY signals on the DP Scoreboards. Caution is still warranted.
Market Environment: It is important to consider the "odds" for success. Here are the current percentages on the Silver and Golden Cross Indexes:
- Silver Cross: 59.4% SPX ITTM Buy Signals (20-EMA > 50-EMA)
- Golden Cross: 65.4% SPX LTTM Buy Signals (50-EMA > 200-EMA)
Diamond Index:
- Diamond Scan Results: 17
- Diamond Dog Scan Results: 12
- Diamond Bull/Bear Ratio: 1.42
Advanced Emissions Solutions Inc (ADES) - Earnings: N/A (Last reported 5/12/2017)
It took a while for the PMO to turn around and start rising, but it has indeed begun to do so. Price is remaining above the 20-EMA and looks poised to test overhead resistance at $14.75. The bounce off support at $13.00 is great. Looking in the thumbnail, you can see the positive volume coming in. The OBV reflects this with rising bottoms.
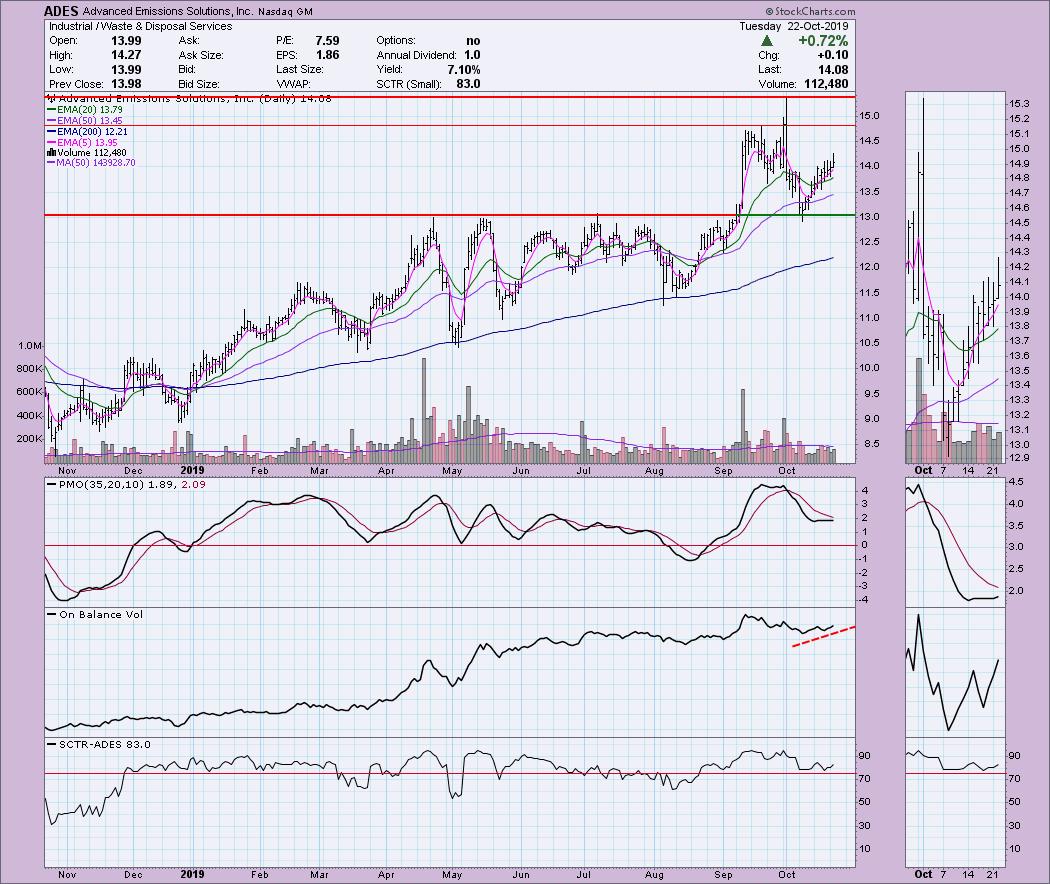
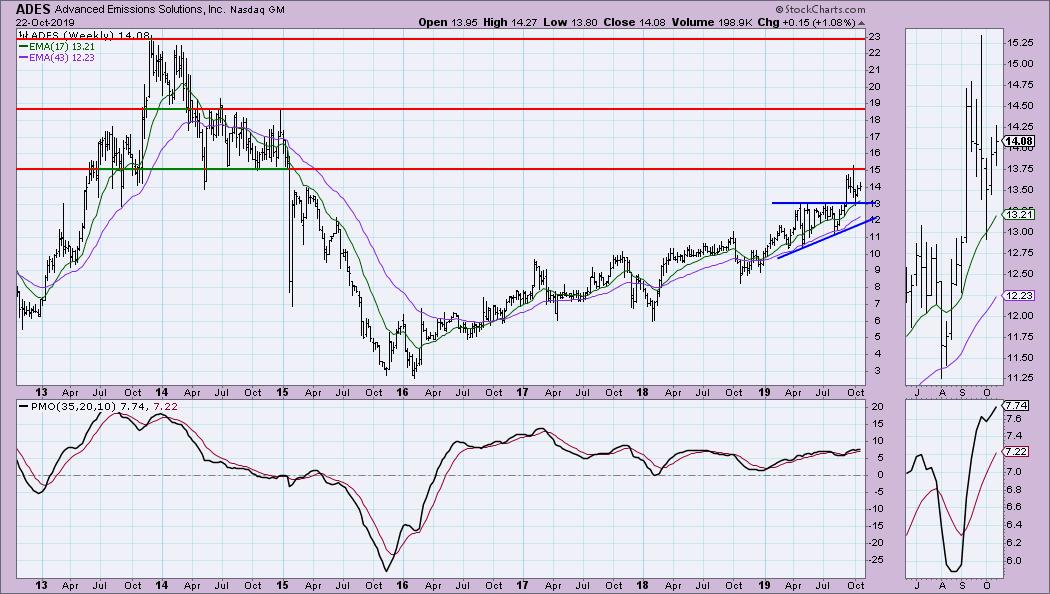
The $15 overhead resistance area could be a problem, as that was the floor back in 2014. If we get a successful breakout, I like the upside target right around $19.
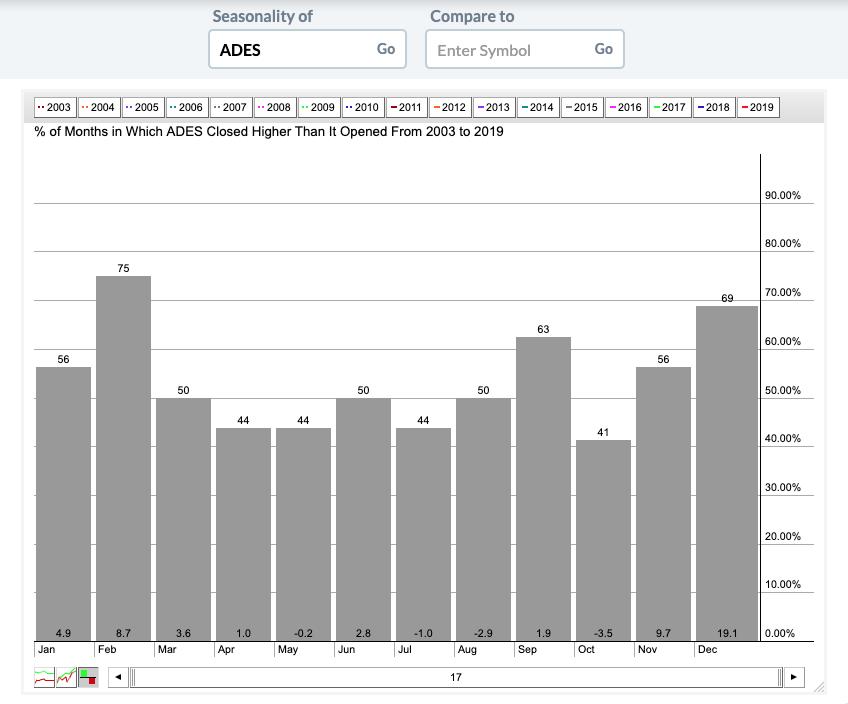
November and December (especially December!) show great seasonality that even carries into January and February. I don't trade seasonality, but it is nice to see this kind of confirmation.
Apollo Global Management LLC (APO) - Earnings: 10/31/2019
Price popped back into the previous trading range and looks ready to make a run at overhead resistance at $41.50. The PMO is reacting a bit slowly to the recent rally, but the momentum on that drop last month is what has held it back. It's like turning a giant bus around while it accelerates down a hill... it takes lots of effort to slow and redirect. The OBV bottoms are confirming the rally and the SCTR is above 90, which implies internal and relative strength.
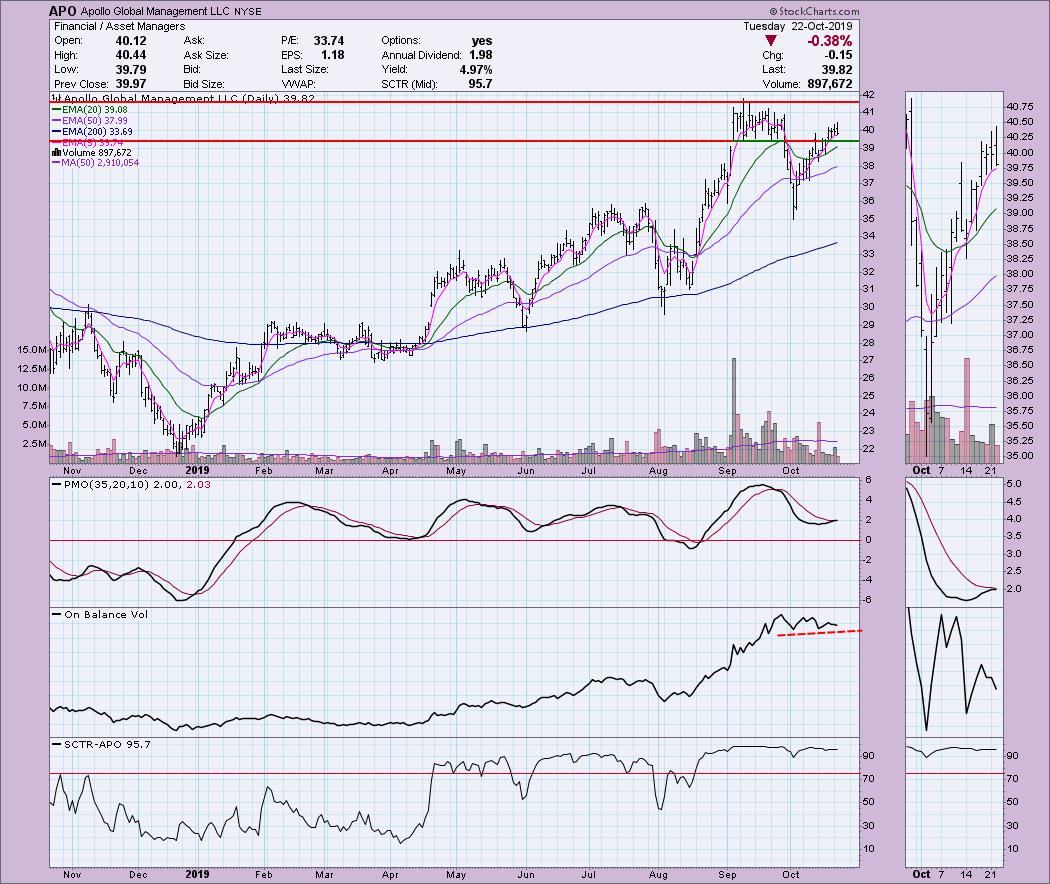
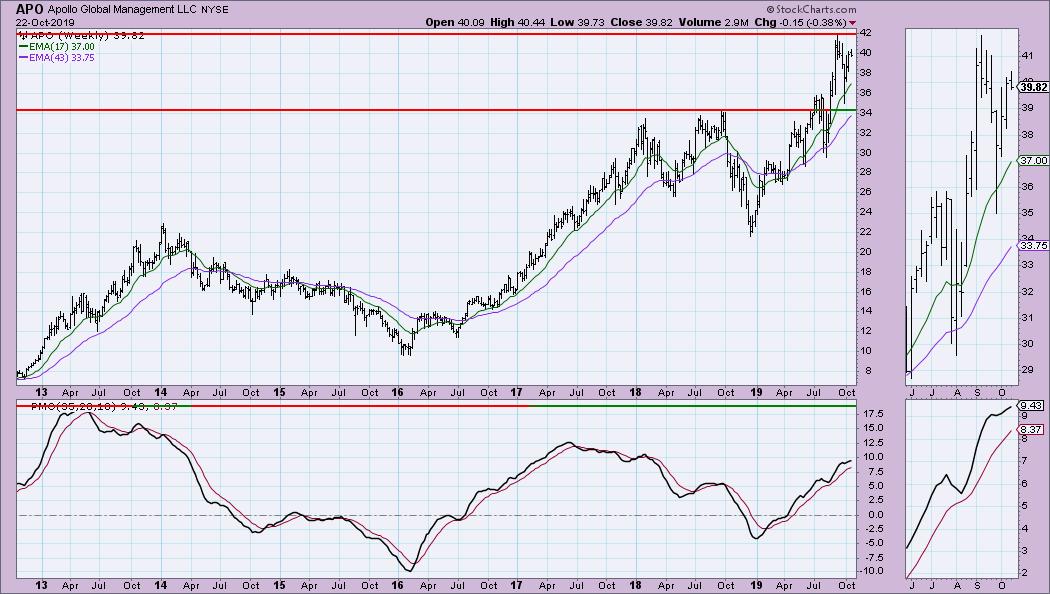
The weekly chart does show us how "stout" that overhead resistance could be, but the PMO is starting to accelerate upward and is far from being overbought.
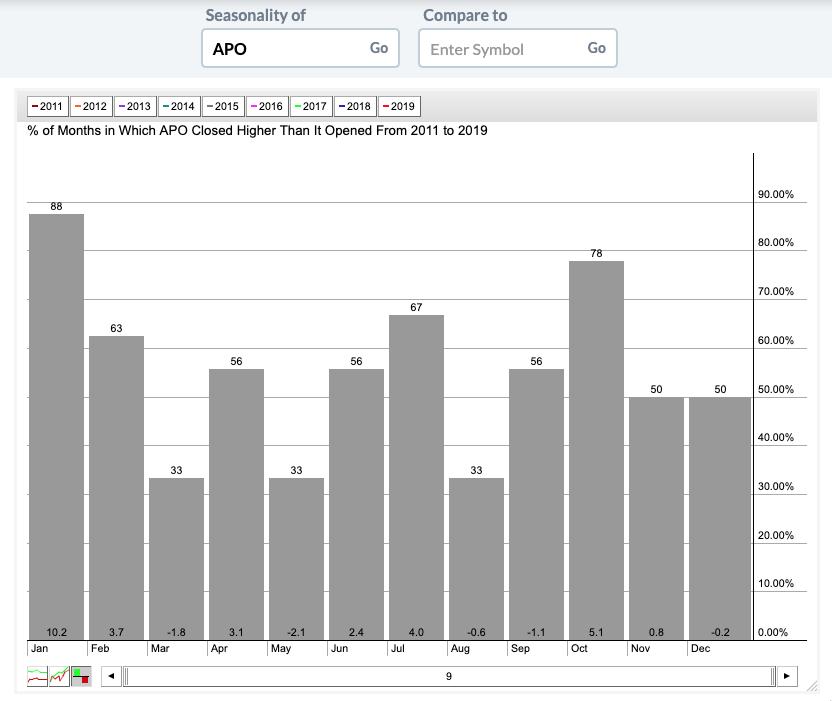
November/December seasonality could be better, but look at January! However, do note this is only 9 years worth of data, which means it can be somewhat skewed.
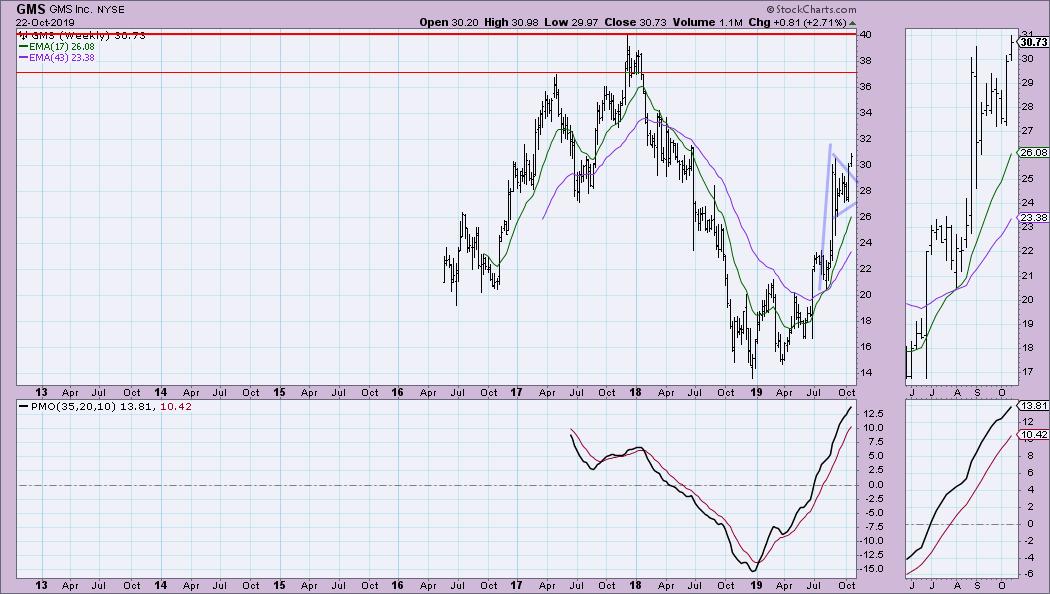
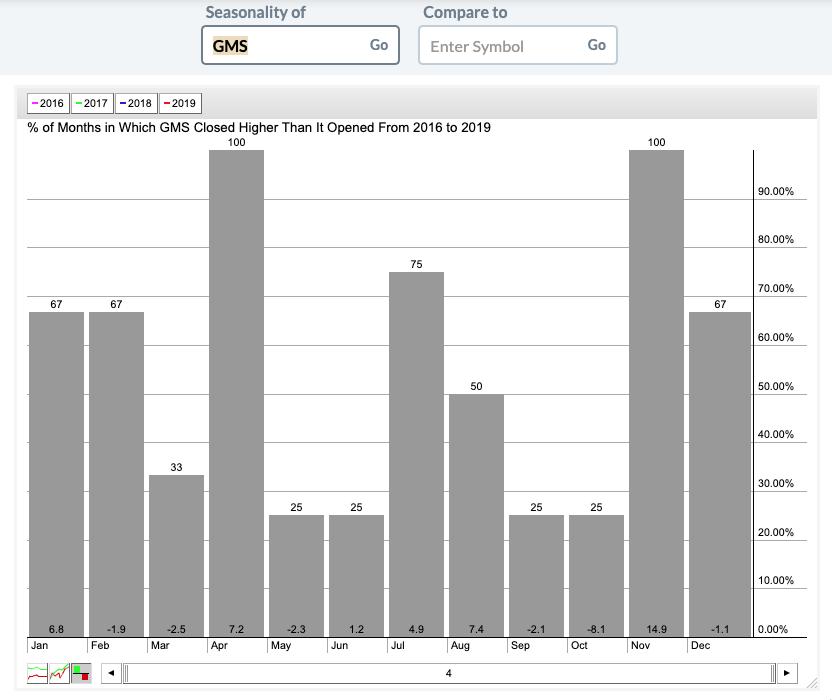
GMS Inc (GMS) - Earnings: 12/2 - 12/6/2019
The volume is certainly coming in on this rally. Price closed above overhead resistance. The OBV shows rising bottoms, which confirms the rally, and I always like to see higher OBV tops when we get a breakout. A 98.3 SCTR defines this stock as cream of the crop.
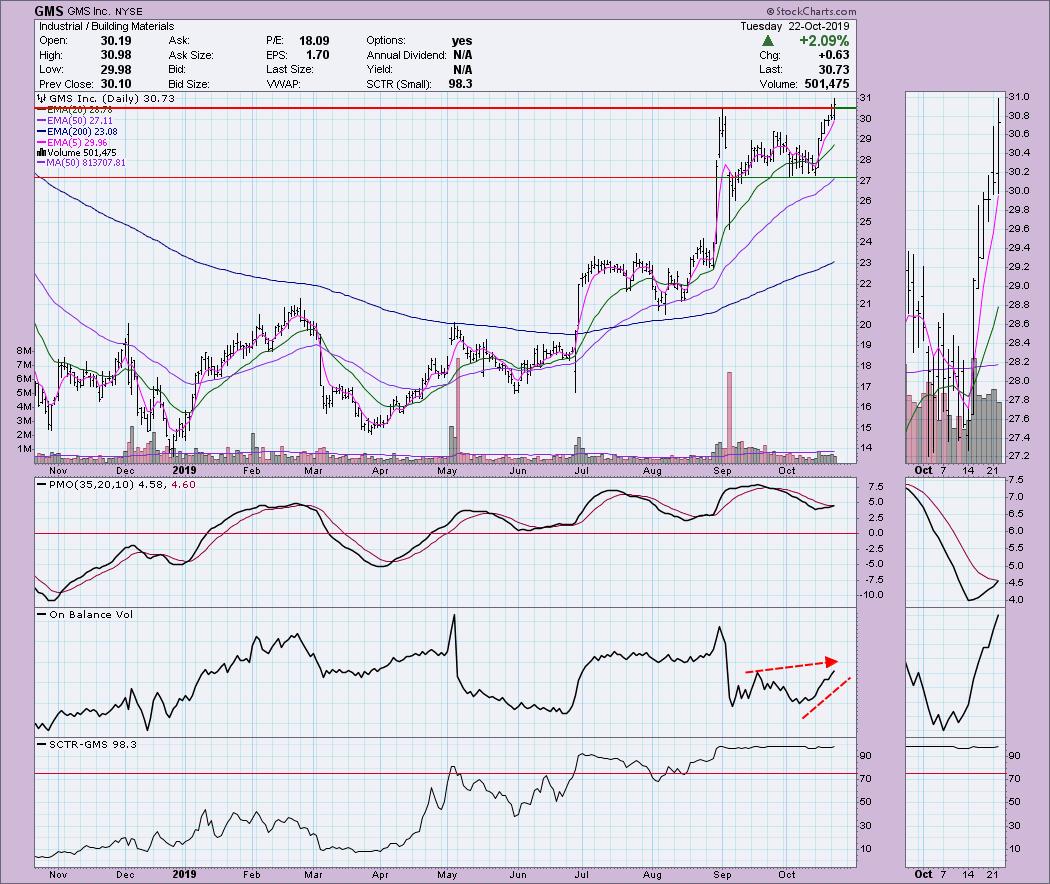
There is a nice bull flag on the weekly chart that isn't as visible on the daily chart above. We don't have much data for the weekly PMO, but it did reach lows of -15, so a 13.8 reading isn't necessarily overbought.
The seasonality is stunning for November, but there is a dearth of data. I wouldn't count on a 14.9% rise next month, but it looks to me that next month should be favorable.
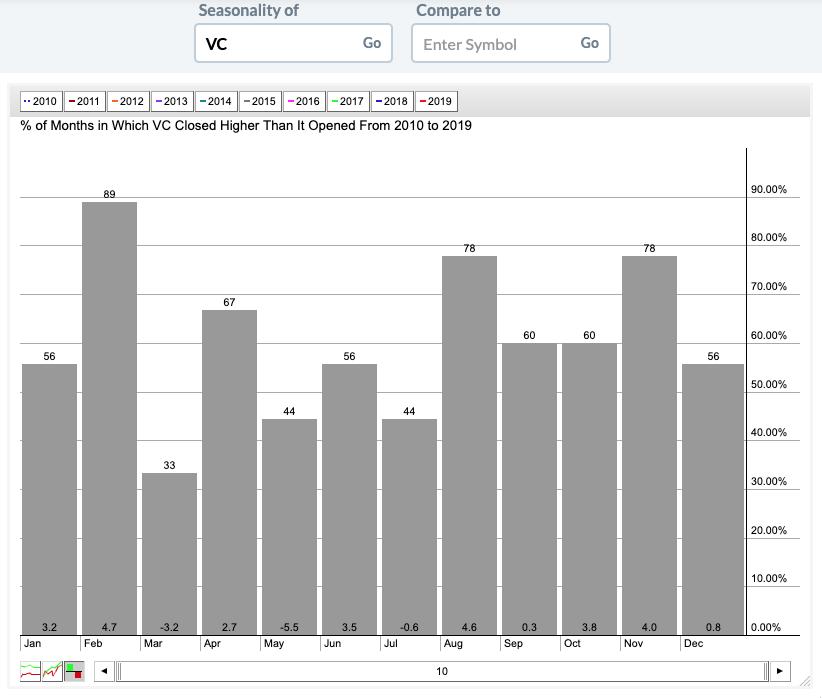
Visteon Corp (VC) - Earnings: 10/24/2019
An ascending triangle is being executed right now, suggesting we should look for a breakout above the February high. The PMO turned up above the zero line and the OBV is confirming this rally as positive volume is coming in strongly. Another >90 SCTR ranking suggests price should make its way toward the $93 level.
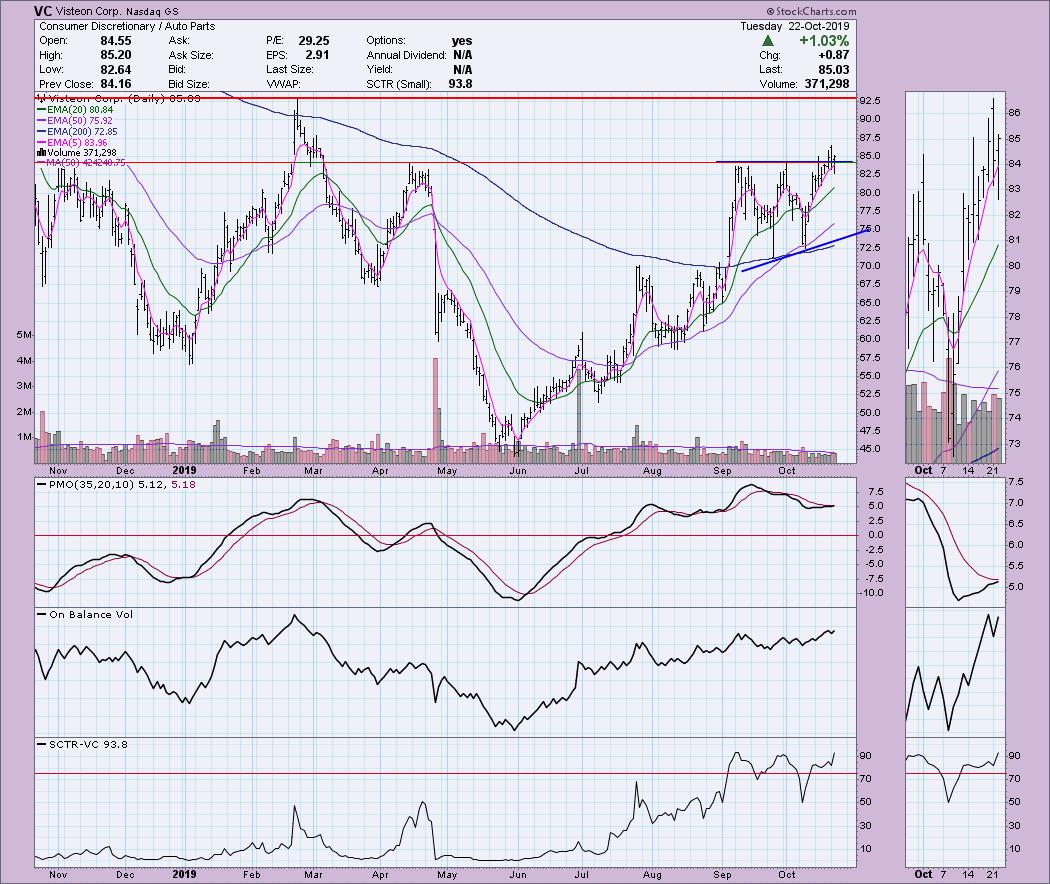
If we see a breakout above $93, the next area of overhead resistance would be $105. The PMO is not overbought; additionally, notice we just had a positive 17/43-week crossover.
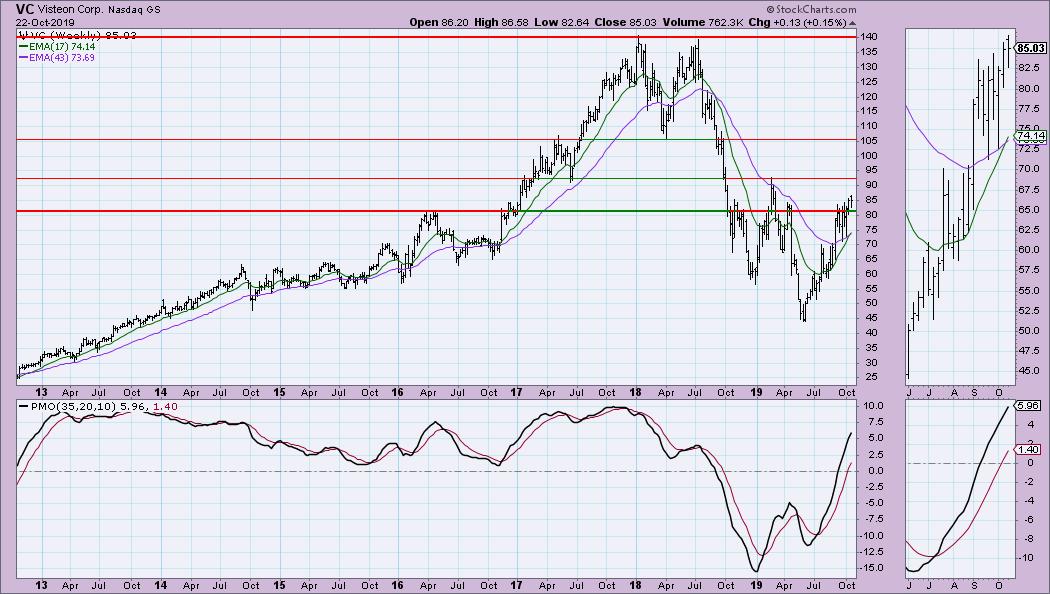
November is a good month for seasonality, which remains mostly positive through February.
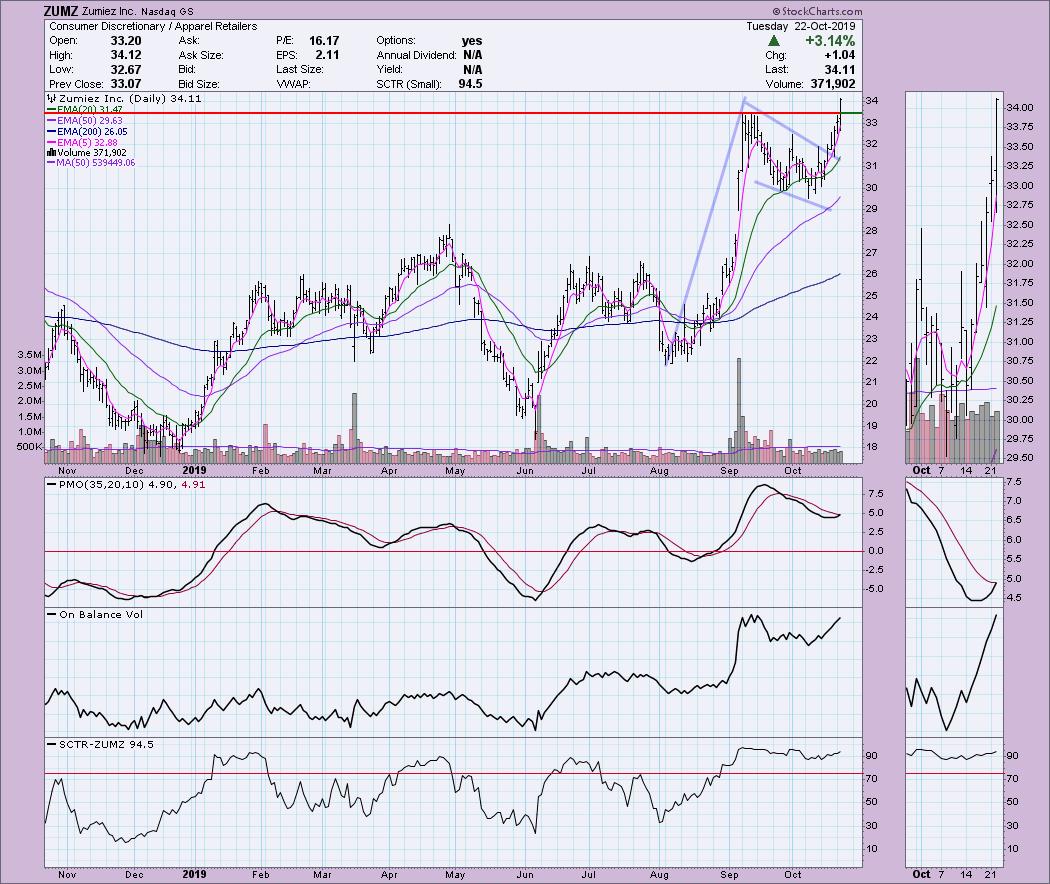
Zumiez Inc (ZUMZ) - Earnings: 12/4 - 12/9/2019
I think ZUMZ is one of the best diamonds today. The PMO is nearing a BUY signal. Positive volume has been coming in for some time, giving the OBV its steep rise. It has executed a flag. You could look at the "flag portion" as a declining wedge, which is also a bullish formation. I will be watching this one on the open for what I hope will be a small pullback toward the breakout point around $33.50. If I see this, I likely will give this one a try.
The weekly chart is great. This breakout is very significant as it lines up with the 2013 and 2018 tops. It could find a problem at $36, which was the floor of the early 2015 trading range, but I'm looking for a move to test all-time highs. The PMO appears overbought, but, given we've seen negative readings at -15 and -12, I believe there is more room for it to move higher.
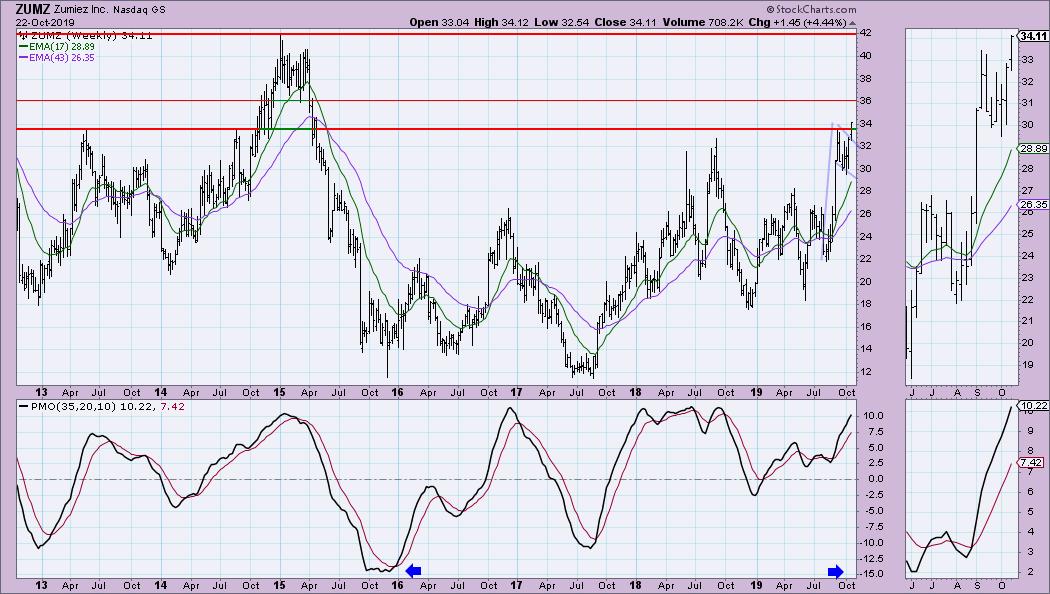
Admittedly, seasonality kinda sucks going into November and December, but I'm willing to give it a go.

Full Disclosure: I do not own any of the stocks above, but I will be watching ZUMZ on the open tomorrow. If price pulls back but remains mostly above the breakout point, I'll likely add it to my portfolio. I'll let you know in tomorrow's report what happens there. I'm currently about 60% in cash.

SAVE THE DATE!!
Erin Swenlin will be presenting at the TradersExpo in New York City on March 15-17, 2020! You'll have an opportunity to meet Erin and discuss the latest DecisionPoint news and Diamond Scans. The conference is free to attend or view online!
Watch the latest episode of DecisionPoint with Carl & Erin Swenlin LIVE on Mondays 5:00p EST or on the StockCharts TV YouTube channel here!
Technical Analysis is a windsock, not a crystal ball.
Happy Charting!
- Erin
erinh@stockcharts.com
NOTE: The stocks reported herein are from mechanical trading model scans that are based upon moving average relationships, momentum and volume. DecisionPoint analysis is then applied to get five selections from the scans. The selections given should prompt readers to do a chart review using their own analysis process. This letter is not a call for a specific action to buy, sell or short any of the stocks provided. There are NO sure things or guaranteed returns on the daily selection of "diamonds in the rough."
Helpful DecisionPoint Links:
DecisionPoint Shared ChartList and DecisionPoint Chart Gallery
Price Momentum Oscillator (PMO)
Swenlin Trading Oscillators (STO-B and STO-V)
**Don't miss DecisionPoint Commentary! Add your email below to be notified of new updates"**