
The ETF scans were not plentiful but I did find some interesting candidates without having to go to our ETF Tracker for more ideas.
I nearly presented UGL which is a bullishly leveraged Gold fund. I like Gold very much and was close to including it today. Instead I decided to just give you my thoughts and pick three other ETFs.
Another interesting catch was the Communication Services ETF (XLC), but I opted not to include it today.
Bonds were plentiful in today's scans, but I'm not feeling bullish on Bonds right now as I think yields will be making their way higher a bit longer.
International Equity funds also were on the radar today, but all of them were overbought as their rallies have been going on for quite awhile. They are due for a pullback.
I think you'll like today's selections. One is leveraged, YINN, the 3x Bull ETF for China. I am not in the habit of including leveraged ETFs, but the flag formation looked too good not to present. AVEM is an Emerging Markets ETF and EWL, the Switzerland ETF.
Tomorrow is Reader Request Day! If you have a moment send me some symbols that interest you. It's a good opportunity to test yourself and see if you can find some "Diamonds in the Rough"!
Good Luck & Good Trading,
Erin
Today's "Diamonds in the Rough": AVEM, EWL and YINN.
Runner-ups: AIQ and UGL.

Diamond Mine Trading Room:
RECORDING & DOWNLOAD LINK (5/30/2025):
Topic: DecisionPoint Diamond Mine (5/30/2025) LIVE Trading Room
Download & Recording LINK
Passcode: May#30th
REGISTRATION for 6/6/2025:
When: June 6, 2025 09:00 AM Pacific Time (US and Canada)
Topic: DecisionPoint Diamond Mine LIVE Trading Room
Register in advance for this webinar HERE
After registering, you will receive a confirmation email containing information about joining the webinar.
Welcome to DecisionPoint Diamonds, wherein I highlight ten "Diamonds in the Rough" per week. These are selected from the results of my DecisionPoint Scans which search for stocks that could benefit from the trend and condition of the market. Remember, these are not recommendations to buy or sell, but are the most interesting of the stocks that surfaced in my scans. My objective is to save you the work of the initial, tedious culling process, but you need to apply your own analysis to see if these stocks pique your interest as well. There are no guaranteed winners here!
"Predefined Scans Triggered" are taken from StockCharts.com using the "Symbol Summary" option instead of a "SharpChart" on the workbench.
Stop levels are all rounded down.
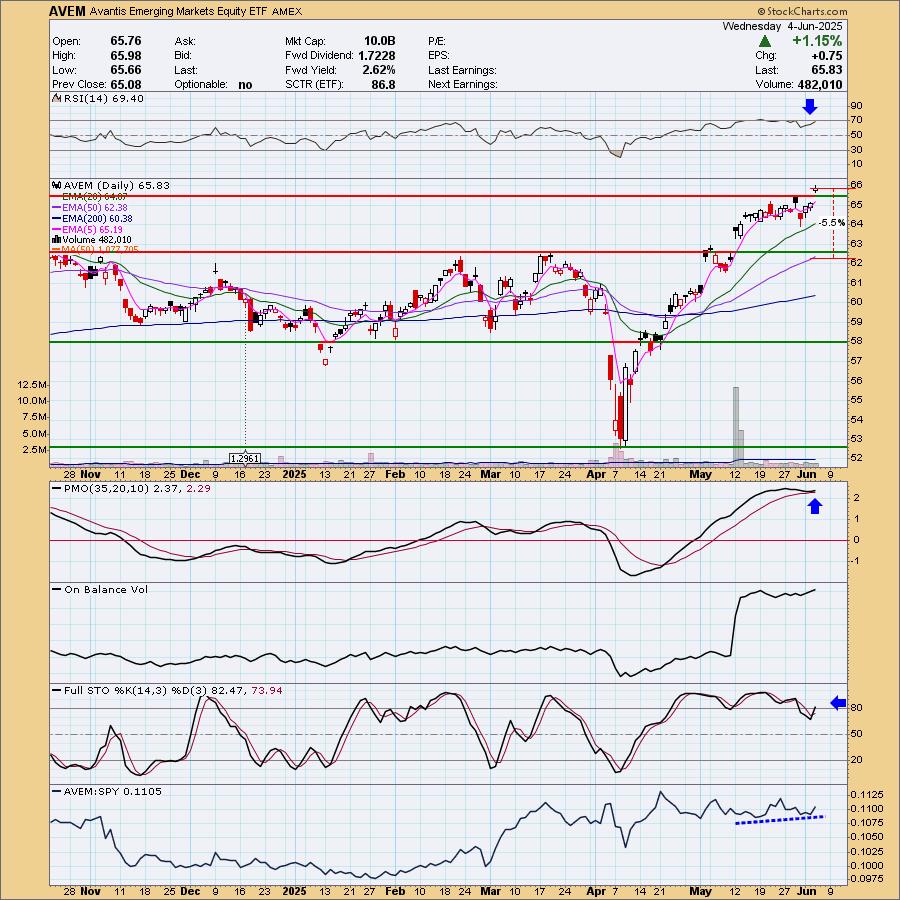
Avantis Emerging Markets Equity ETF (AVEM)
EARNINGS: N/A
AVEM is an actively managed fund that holds emerging-market stocks of all market capitalizations considered favorable on multiple factors. The fund seeks to provide capital appreciation. Click HERE for more information.
Predefined Scans Triggered: Elder Bar Turned Green, New CCI Buy Signals, Moved Above Upper Keltner Channel, New 52-week Highs, Moved Above Upper Price Channel, Parabolic SAR Buy Signals, P&F Double Top Breakout, P&F Triple Top Breakout and P&F Quadruple Top Breakout.
AVEM is unchanged in after-hours trading. The rally has been going on for quite some time, but it did have a period of consolidation and now we have a breakout from that congestion zone. The RSI is positive, though getting a bit overbought. The PMO has surged (bottomed) above the signal line. Plenty of volume has come in based on the jump for On Balance Volume (OBV). Stochastics have moved back above 80 and we do see some outperformance for the ETF against the SPY. We don't need a deep stop based on support. I chose 5.5% or $62.20.
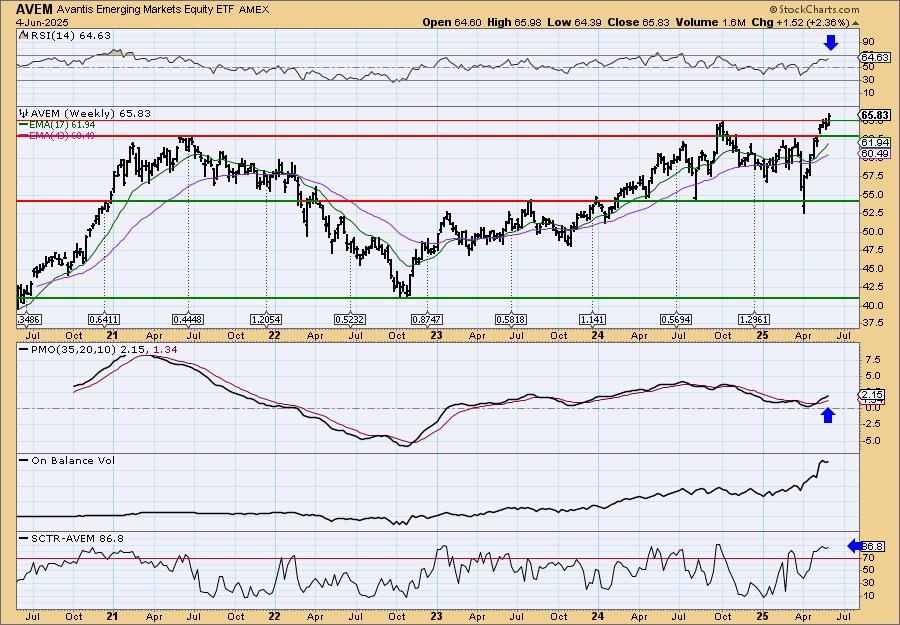
The breakout looks impressive on the weekly chart as it hits new 52-week highs. The weekly RSI is positive and not overbought despite the recent rally. The weekly PMO is rising on a Crossover BUY Signal above the zero line. The StockCharts Technical Rank (SCTR) is well within the hot zone* above 70. Consider a 17% upside target to $77.02.
*If a stock is in the "hot zone" above 70, it implies that it is stronger than 70% of its universe (large-, mid-, small-caps and ETFs) primarily in the intermediate to long terms.
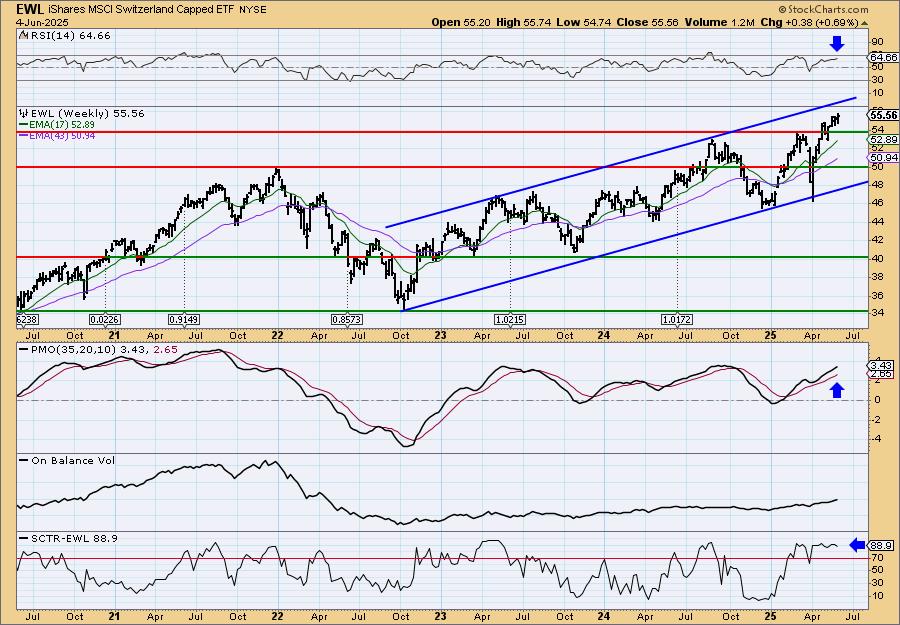
iShares MSCI Switzerland Capped ETF (EWL)
EARNINGS: N/A
EWL tracks a market-cap-weighted index of Swiss stocks. It captures 85% of the publicly available market, excluding small-caps. Click HERE for more information.
Predefined Scans Triggered: Elder Bar Turned Green, P&F Double Top Breakout, P&F Triple Top Breakout and New 52-week Highs.
EWL is unchanged in after-hours trading. We have a small breakout today with price melting up in a rising trend. I like that it is making new 52-week highs. The RSI is positive and not at all overbought. The PMO has surged above the signal line and is flattening out which indicates pure strength. Stochastics are above 80 and have begun to rise again. Relative strength is in a rising trend. We don't need a deep stop here. I put the stop beneath the prior bottom at 5.4% or $52.55.
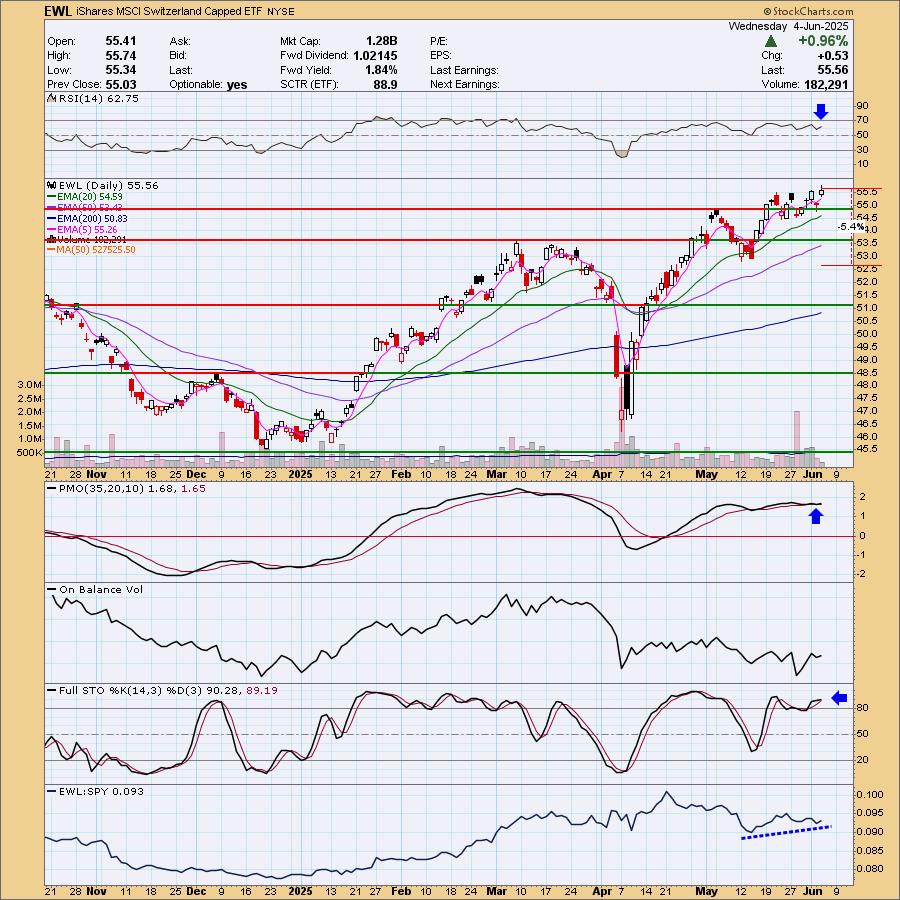
Price is traveling within a long-term rising trend channel. It is near the top, but I think it will hug the top of the channel as it moves higher. The weekly RSI is not overbought. The weekly PMO is rising and putting margin between it and its signal line. The SCTR is in the hot zone. Consider a 17% upside target to about $65.00.
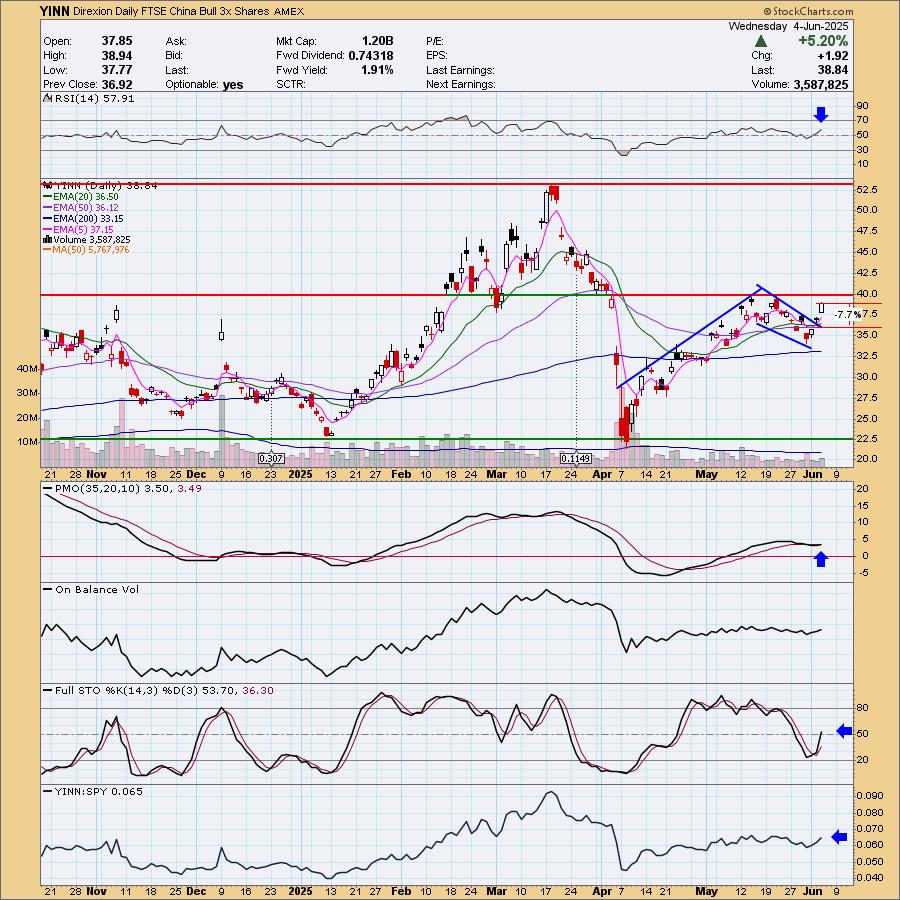
Direxion Daily FTSE China Bull 3x Shares (YINN)
EARNINGS: N/A
YINN provides daily 3x leveraged exposure to a market-cap-weighted index of the 50 largest Chinese stocks traded in Hong Kong. Click HERE for more information.
Predefined Scans Triggered: Moved Above Ichimoku Cloud and Parabolic SAR Buy Signals.
YINN is down -0.03% in after hours trading. The bull flag sold me on this one. Resistance is nearing, but this price pattern does suggest that we'll see a breakout there. Based on the height of the flagpole, we should get a breakout above the March high. (On bull flags, you take the height of the flagpole and add it to the breakout point to get your minimum upside target.) The RSI is positive and isn't overbought yet. The PMO has whipsawed back into a Crossover BUY Signal. Stochastics just moved into positive territory. We also see a little outperformance coming in this week. The stop is set beneath the 20/50-day EMAs at 7.7% or $35.84. Because this is leveraged, you may want to expand that stop level. This one can be volatile and large declines are certainly possible so be careful. This isn't for the faint of heart.
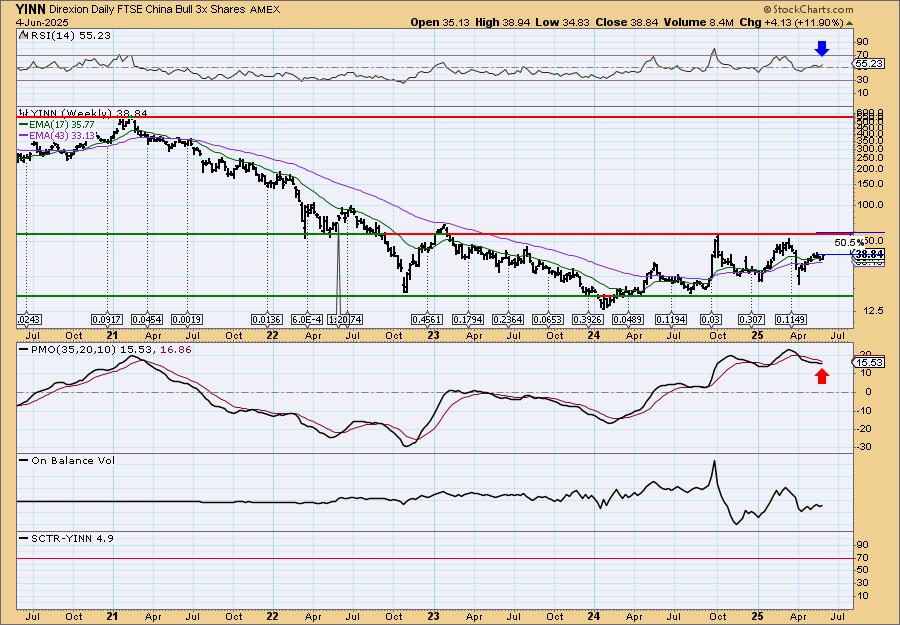
Upside potential is juicy given this is leveraged. Price does seem to be making its way to the top of the trading channel. The weekly RSI is positive. The weekly PMO hasn't turned back up yet. All leveraged funds should have a very short time horizon. This one will need to be monitored closely.
Don't forget, on Thursdays I look at reader-requested symbols, click HERE to send me an email. I read every email I receive and try to answer them all!
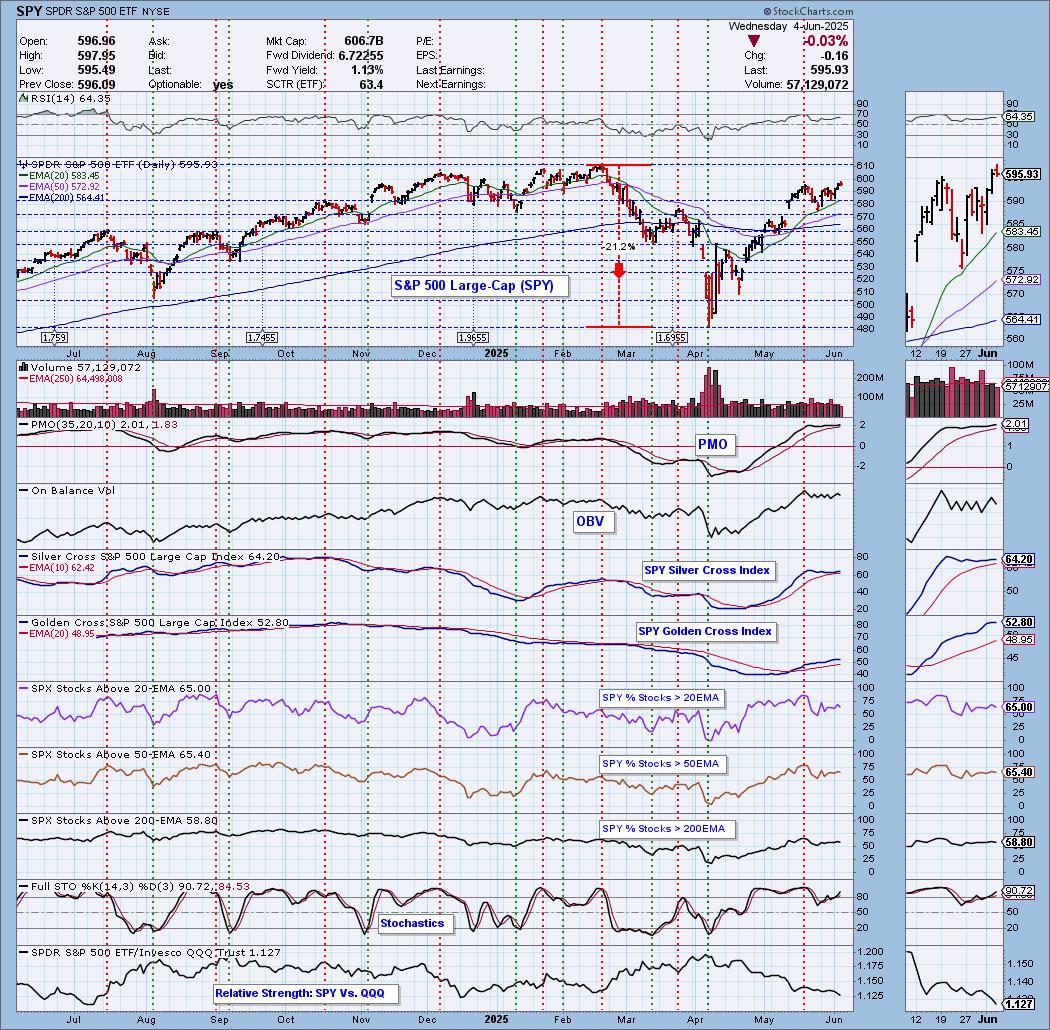
Current Market Outlook:
Market Environment: It is important to consider the odds for success by assessing the market tides. The following chart uses different methodologies for objectively showing the depth and trend of participation for intermediate- and long-term time frames.
- The Silver Cross Index (SCI) shows the percentage of SPX stocks on IT Trend Model BUY signals (20-EMA > 50-EMA)
- The Golden Cross Index (GCI) shows the percentage of SPX stocks on LT Trend Model BUY signals (50-EMA > 200-EMA)
Don't forget that as a "Diamonds" member, you have access to our "Under the Hood" curated ChartList on DecisionPoint.com. You'll find it under "Members Only" links on the left side on the Blogs and Links Page.
Here is the current chart:
Full Disclosure: I am 60% long, 0% short.
I'm required to disclose if I currently own a stock I mention and/or may buy/short it within the next 72 hours.
"Technical Analysis is a windsock, not a crystal ball." - Carl Swenlin
(c) Copyright 2025 DecisionPoint.com
Watch the latest episode of DecisionPoint Trading Room with Carl Swenlin & Erin Swenlin Mondays on the DecisionPoint YouTube channel here!
NOTE: The stocks reported herein are from mechanical trading model scans that are based upon moving average relationships, momentum and volume. DecisionPoint analysis is then applied to get five selections from the scans. The selections given should prompt readers to do a chart review using their own analysis process. This letter is not a call for a specific action to buy, sell or short any of the stocks provided. There are NO sure things or guaranteed returns on the daily selection of "Diamonds in the Rough."
Regarding BUY/SELL Signals: The signal status reported herein is based upon mechanical trading model signals and crossovers. They define the implied bias of the price index/stock based upon moving average relationships and momentum, but they do not necessarily call for a specific action. They are information flags that should prompt chart review. Further, they do not call for continuous buying or selling during the life of the signal. For example, a BUY signal will probably (but not necessarily) return the best results if action is taken soon after the signal is generated. Additional opportunities for buying may be found as price zigzags higher, but the trader must look for optimum entry points. Conversely, exit points to preserve gains (or minimize losses) may be evident before the model mechanically closes the signal.
Helpful DecisionPoint Links:
Price Momentum Oscillator (PMO)
Swenlin Trading Oscillators (STO-B and STO-V)
For more links, go to DecisionPoint.com