
ETF scans were pretty light today. It was another day with lots of Bond funds hitting the results. I'm not that bullish on Bonds right now so I opted not to include any.
I did find two of the ETFs from the scans today and then I opted to look at the ETF Tracker ChartList to see if I could find any more candidates. I did see some interesting ETFs there. Two of them which I would've liked to have presented were overbought: URA and ARKK. Still might be worth a look as I do think both will experience more upside from here, they are just very extended.
I nearly picked the Pharma ETF (XPH) as that was our Industry Group to Watch on Friday, but I liked the other charts better. It is also worth a look though.
Tomorrow is Reader Request Day! Get your symbols in before 1p PT and you might see it covered! It is always better when I have lots of symbols to choose from so send your list!
Good Luck & Good Trading,
Erin
Today's "Diamonds in the Rough": ETHW, PALL and XES.
Runner-ups: INDA, WTAI, NLR, URA, ARKK, TAN, DRIV and XPH.

Diamond Mine Trading Room:
RECORDING & DOWNLOAD LINK (6/6/2025):
Topic: DecisionPoint Diamond Mine (6/6/2025) LIVE Trading Room
Download and Recording LINK
Passcode: June#6th
REGISTRATION for 6/13/2025:
When: June 13, 2025 09:00 AM Pacific Time (US and Canada)
Topic: DecisionPoint Diamond Mine LIVE Trading Room
Register in advance for this webinar HERE
After registering, you will receive a confirmation email containing information about joining the webinar.
Welcome to DecisionPoint Diamonds, wherein I highlight ten "Diamonds in the Rough" per week. These are selected from the results of my DecisionPoint Scans which search for stocks that could benefit from the trend and condition of the market. Remember, these are not recommendations to buy or sell, but are the most interesting of the stocks that surfaced in my scans. My objective is to save you the work of the initial, tedious culling process, but you need to apply your own analysis to see if these stocks pique your interest as well. There are no guaranteed winners here!
"Predefined Scans Triggered" are taken from StockCharts.com using the "Symbol Summary" option instead of a "SharpChart" on the workbench.
Stop levels are all rounded down.
Bitwise Ethereum ETF (ETHW)
EARNINGS: N/A
ETHW is a low-cost Ethereum fund built by crypto specialists. The Fund holds ether (ETH), the second-largest crypto asset in the world and the force behind some of the most popular projects in crypto. Click HERE for more information.
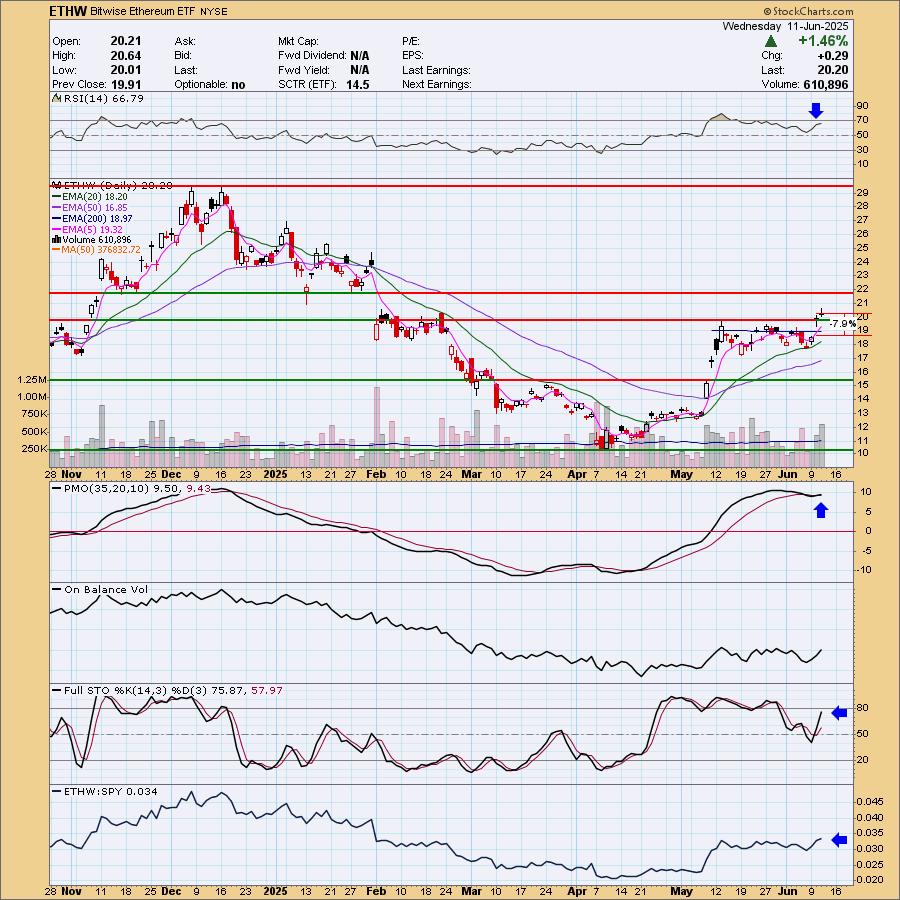
Predefined Scans Triggered: P&F Double Top Breakout.
ETHW is down -0.10% in after hours trading. I'm not usually one to present crypto, but this breakout from the consolidation zone looks very bullish. There are other Ethereum ETFs so pick the one you want, they all look like this. The RSI is not overbought and is positive. The PMO has whipsawed back into a Crossover BUY Signal. Stochastics are rising strongly toward 80 and we can see that there is some outperformance being logged with the relative strength line rising again. The stop is set beneath the 200-day EMA at 7.9% or $18.60.
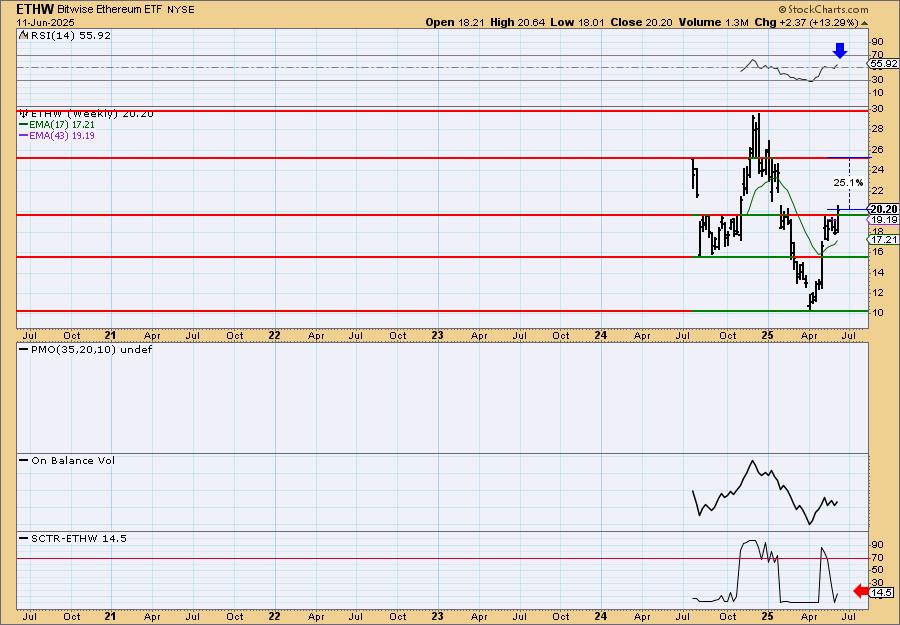
The weekly chart shows a very positive "V" Bottom pattern. We have since retraced more than 1/3rd of the pattern so it has been confirmed. The expectation is a breakout above the left side of the "V" which would mean new all-time highs. The weekly RSI is positive and not at all overbought. Unfortunately it is too new to have a weekly PMO calculated. Plenty of upside potential is available. The StockCharts Technical Rank (SCTR) is in the basement, well outside the hot zone*, so there is plenty of work to do here.
*If a stock is in the "hot zone" above 70, it implies that it is stronger than 70% of its universe (large-, mid-, small-caps and ETFs) primarily in the intermediate to long terms.
abrdn Physical Palladium Shares ETF (PALL)
EARNINGS: N/A
PALL tracks the palladium spot price, less trust expenses. Click HERE for more information.
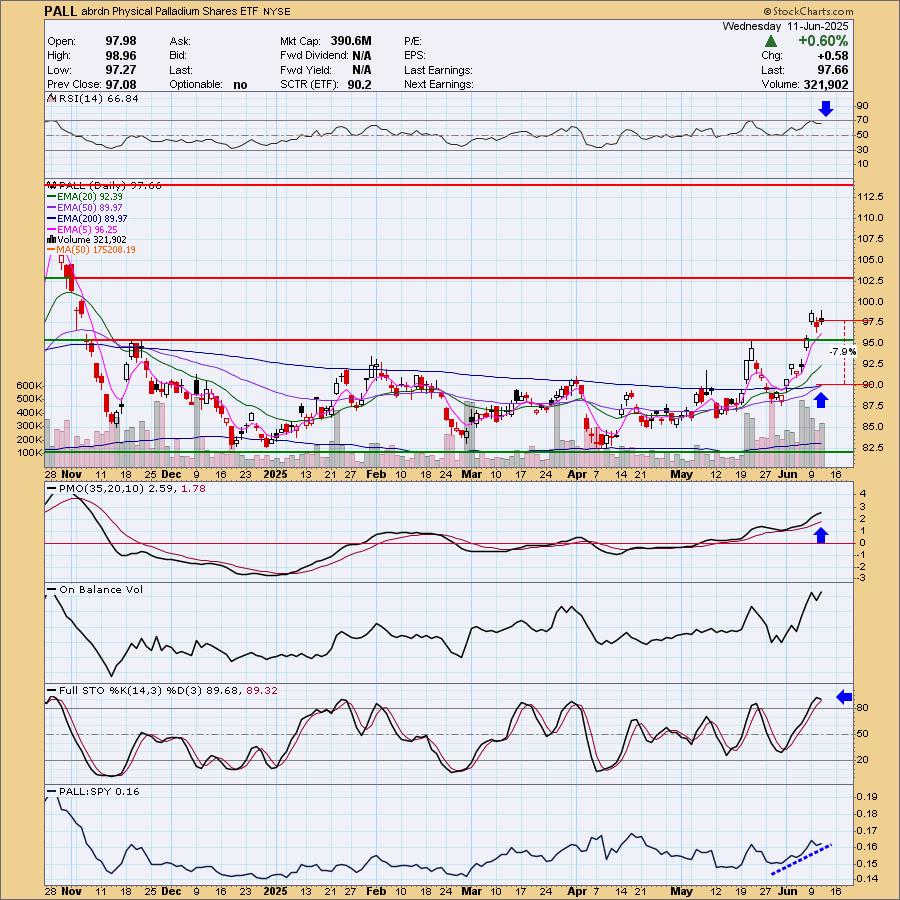
Predefined Scans Triggered: Filled Black Candles, P&F Ascending Triple Top Breakout and P&F Double Top Breakout.
PALL is up +0.40% in after-hours trading. The breakout is convincing out of the trading channel. The rally is a bit extended, but the RSI is not overbought yet. There is a new Golden Cross of the 50/200-day EMAs. The PMO is on the rise on a Crossover BUY Signal. Volume has really been coming in based on the steep rise of the On-Balance Volume (OBV). Stochastics are holding above 80, although they have topped on today's filled black candlestick. It is currently up in after-hours trading, but it is vulnerable to a decline based on that candlestick. The stop is set at the 200-day EMA at 7.9% or $89.94.
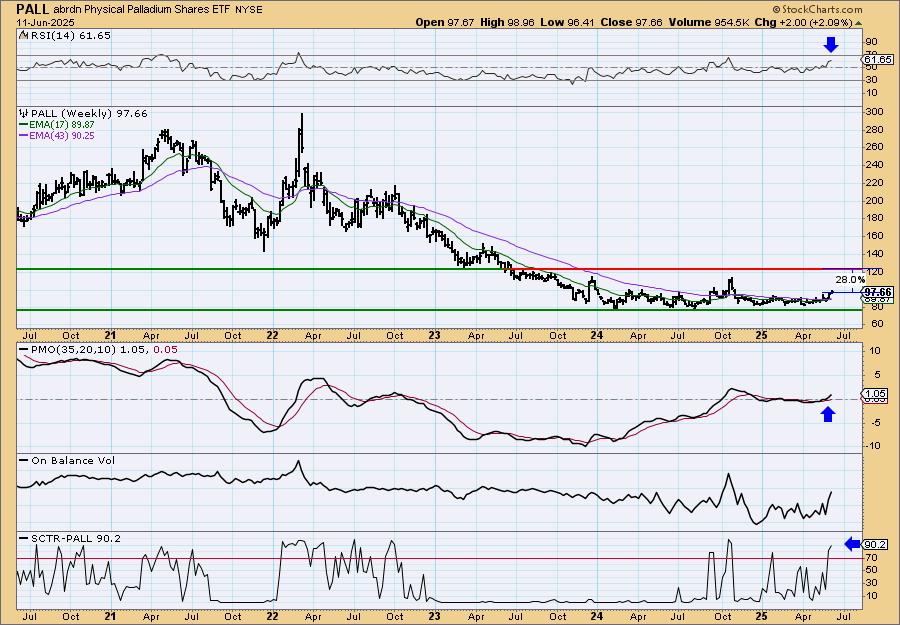
PALL is in a trading channel on the weekly chart and it appears ready to go test the top of the range. The weekly RSI is positive and not overbought. The weekly PMO is on the rise above the zero line. The SCTR is inside the hot zone above 70. There is some nice upside potential if it can reach the top of this trading range.
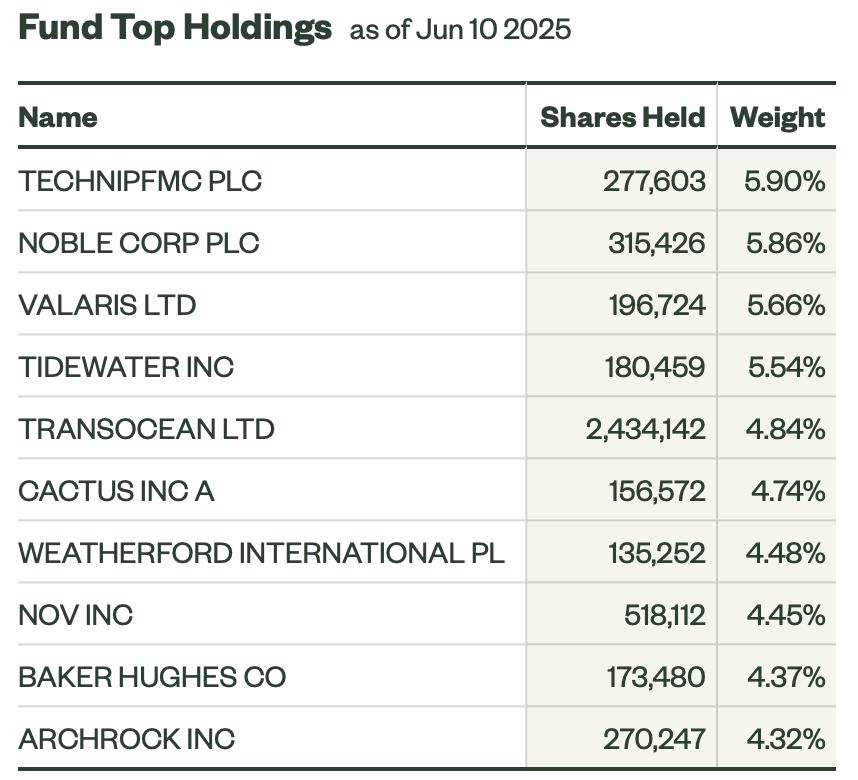
SPDR S&P Oil & Gas Equipment & Services ETF (XES)
EARNINGS: N/A
XES tracks an equal-weighted index of companies in the oil & gas equipment and services sub-industry of the S&P Total Market Index. Click HERE for more information.
Predefined Scans Triggered: Stocks in a New Uptrend (Aroon), P&F Ascending Triple Top Breakout and P&F Double Top Breakout.
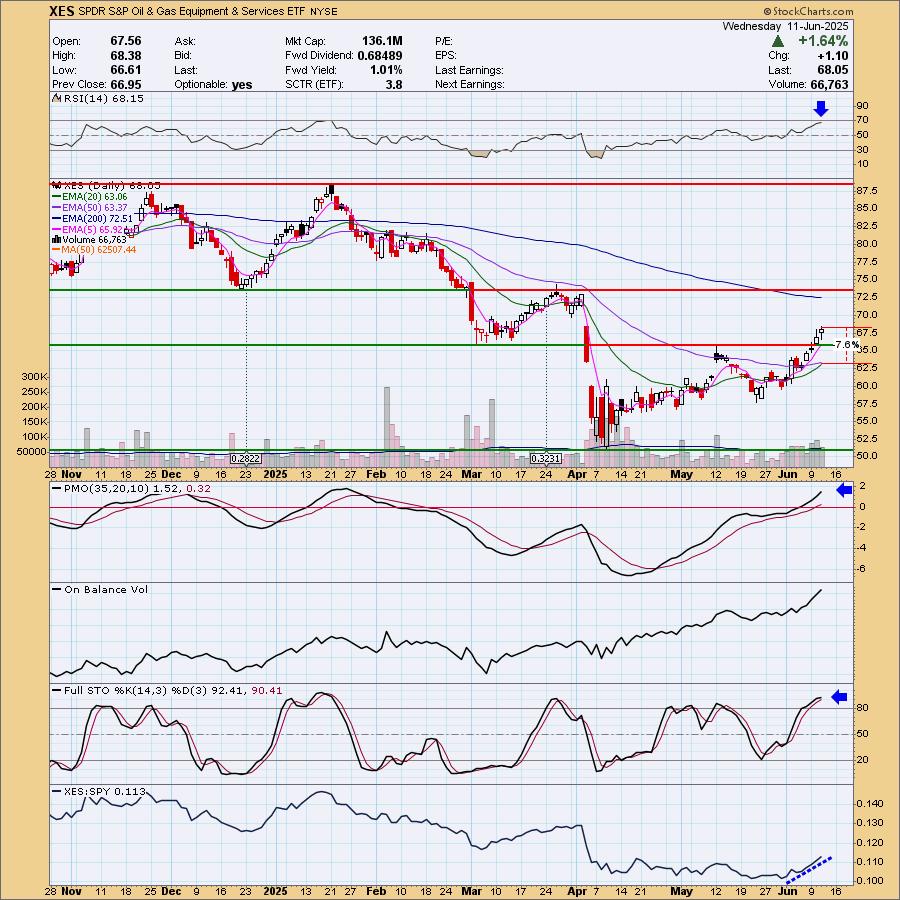
XES is down -0.01% in after-hours trading. I like the Crude Oil chart right now so this one was on my radar. The rally is a bit extended, but the RSI is not overbought. We have a nice breakout above the May top. A Silver Cross of the 20/50-day EMAs is arriving. Overhead resistance is nearing and it may struggle a bit there, but a continued move in Crude would push it past. The PMO is rising above the zero line on a Crossover BUY Signal. The OBV is rising strongly, confirming the rally. Stochastics are holding above 80 and relative strength is picking up. The stop is set near the 50-day EMA at 7.6% or $62.87.
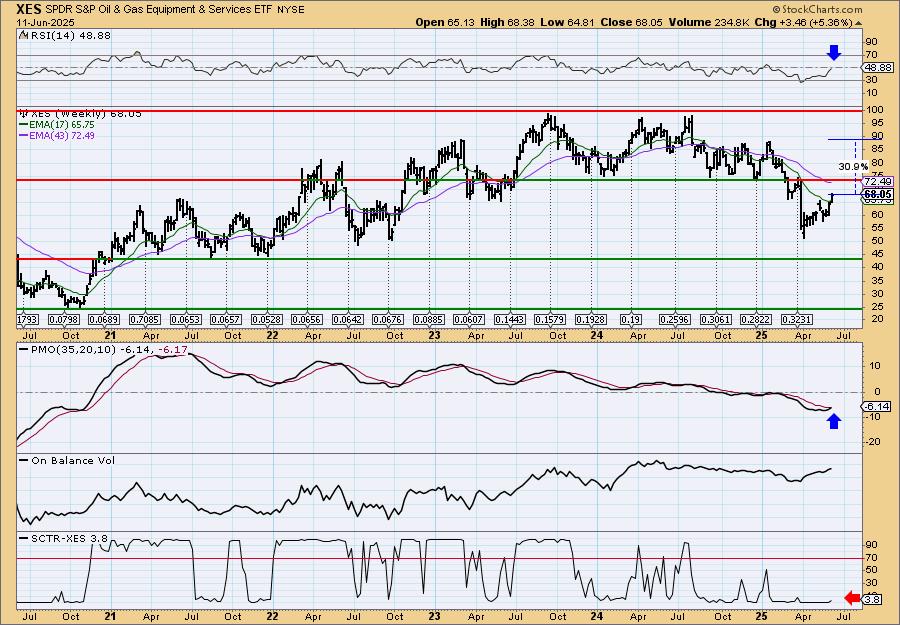
The weekly chart is positive, but it does show how strong overhead resistance is. You'll need to be nimble if it decides to turn back down there. The weekly RSI is nearly in positive territory. The weekly PMO has just triggered a Crossover BUY Signal. The OBV is rising with price. The SCTR looks terrible, another reason to stay alert on this trade. I'm looking for a move to test the 2025 top.
Don't forget, on Thursdays I look at reader-requested symbols, click HERE to send me an email. I read every email I receive and try to answer them all!
Current Market Outlook:
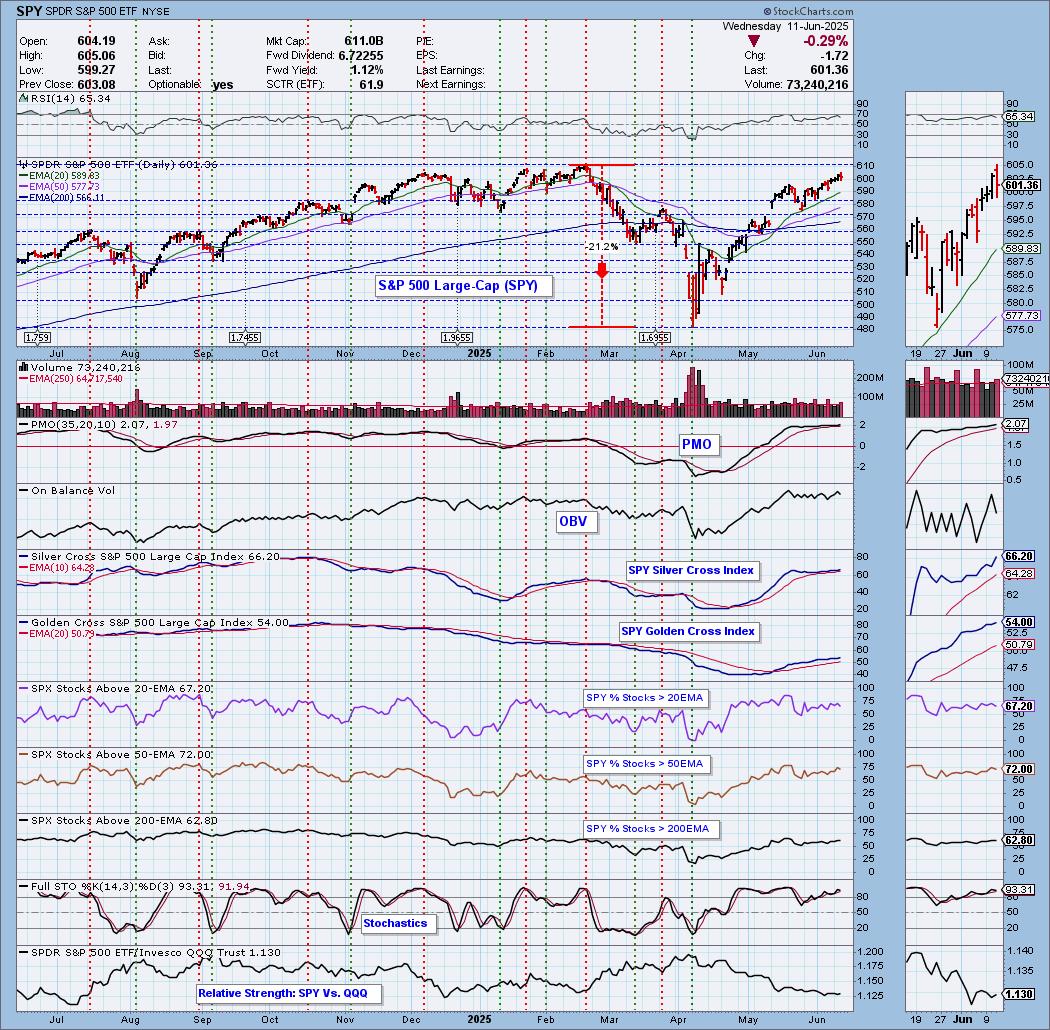
Market Environment: It is important to consider the odds for success by assessing the market tides. The following chart uses different methodologies for objectively showing the depth and trend of participation for intermediate- and long-term time frames.
- The Silver Cross Index (SCI) shows the percentage of SPX stocks on IT Trend Model BUY signals (20-EMA > 50-EMA)
- The Golden Cross Index (GCI) shows the percentage of SPX stocks on LT Trend Model BUY signals (50-EMA > 200-EMA)
Don't forget that as a "Diamonds" member, you have access to our "Under the Hood" curated ChartList on DecisionPoint.com. You'll find it under "Members Only" links on the left side on the Blogs and Links Page.
Here is the current chart:
Full Disclosure: I am 60% long, 0% short.
I'm required to disclose if I currently own a stock I mention and/or may buy/short it within the next 72 hours.
"Technical Analysis is a windsock, not a crystal ball." - Carl Swenlin
(c) Copyright 2025 DecisionPoint.com
Watch the latest episode of DecisionPoint Trading Room with Carl Swenlin & Erin Swenlin Mondays on the DecisionPoint YouTube channel here!
NOTE: The stocks reported herein are from mechanical trading model scans that are based upon moving average relationships, momentum and volume. DecisionPoint analysis is then applied to get five selections from the scans. The selections given should prompt readers to do a chart review using their own analysis process. This letter is not a call for a specific action to buy, sell or short any of the stocks provided. There are NO sure things or guaranteed returns on the daily selection of "Diamonds in the Rough."
Regarding BUY/SELL Signals: The signal status reported herein is based upon mechanical trading model signals and crossovers. They define the implied bias of the price index/stock based upon moving average relationships and momentum, but they do not necessarily call for a specific action. They are information flags that should prompt chart review. Further, they do not call for continuous buying or selling during the life of the signal. For example, a BUY signal will probably (but not necessarily) return the best results if action is taken soon after the signal is generated. Additional opportunities for buying may be found as price zigzags higher, but the trader must look for optimum entry points. Conversely, exit points to preserve gains (or minimize losses) may be evident before the model mechanically closes the signal.
Helpful DecisionPoint Links:
Price Momentum Oscillator (PMO)
Swenlin Trading Oscillators (STO-B and STO-V)
For more links, go to DecisionPoint.com