
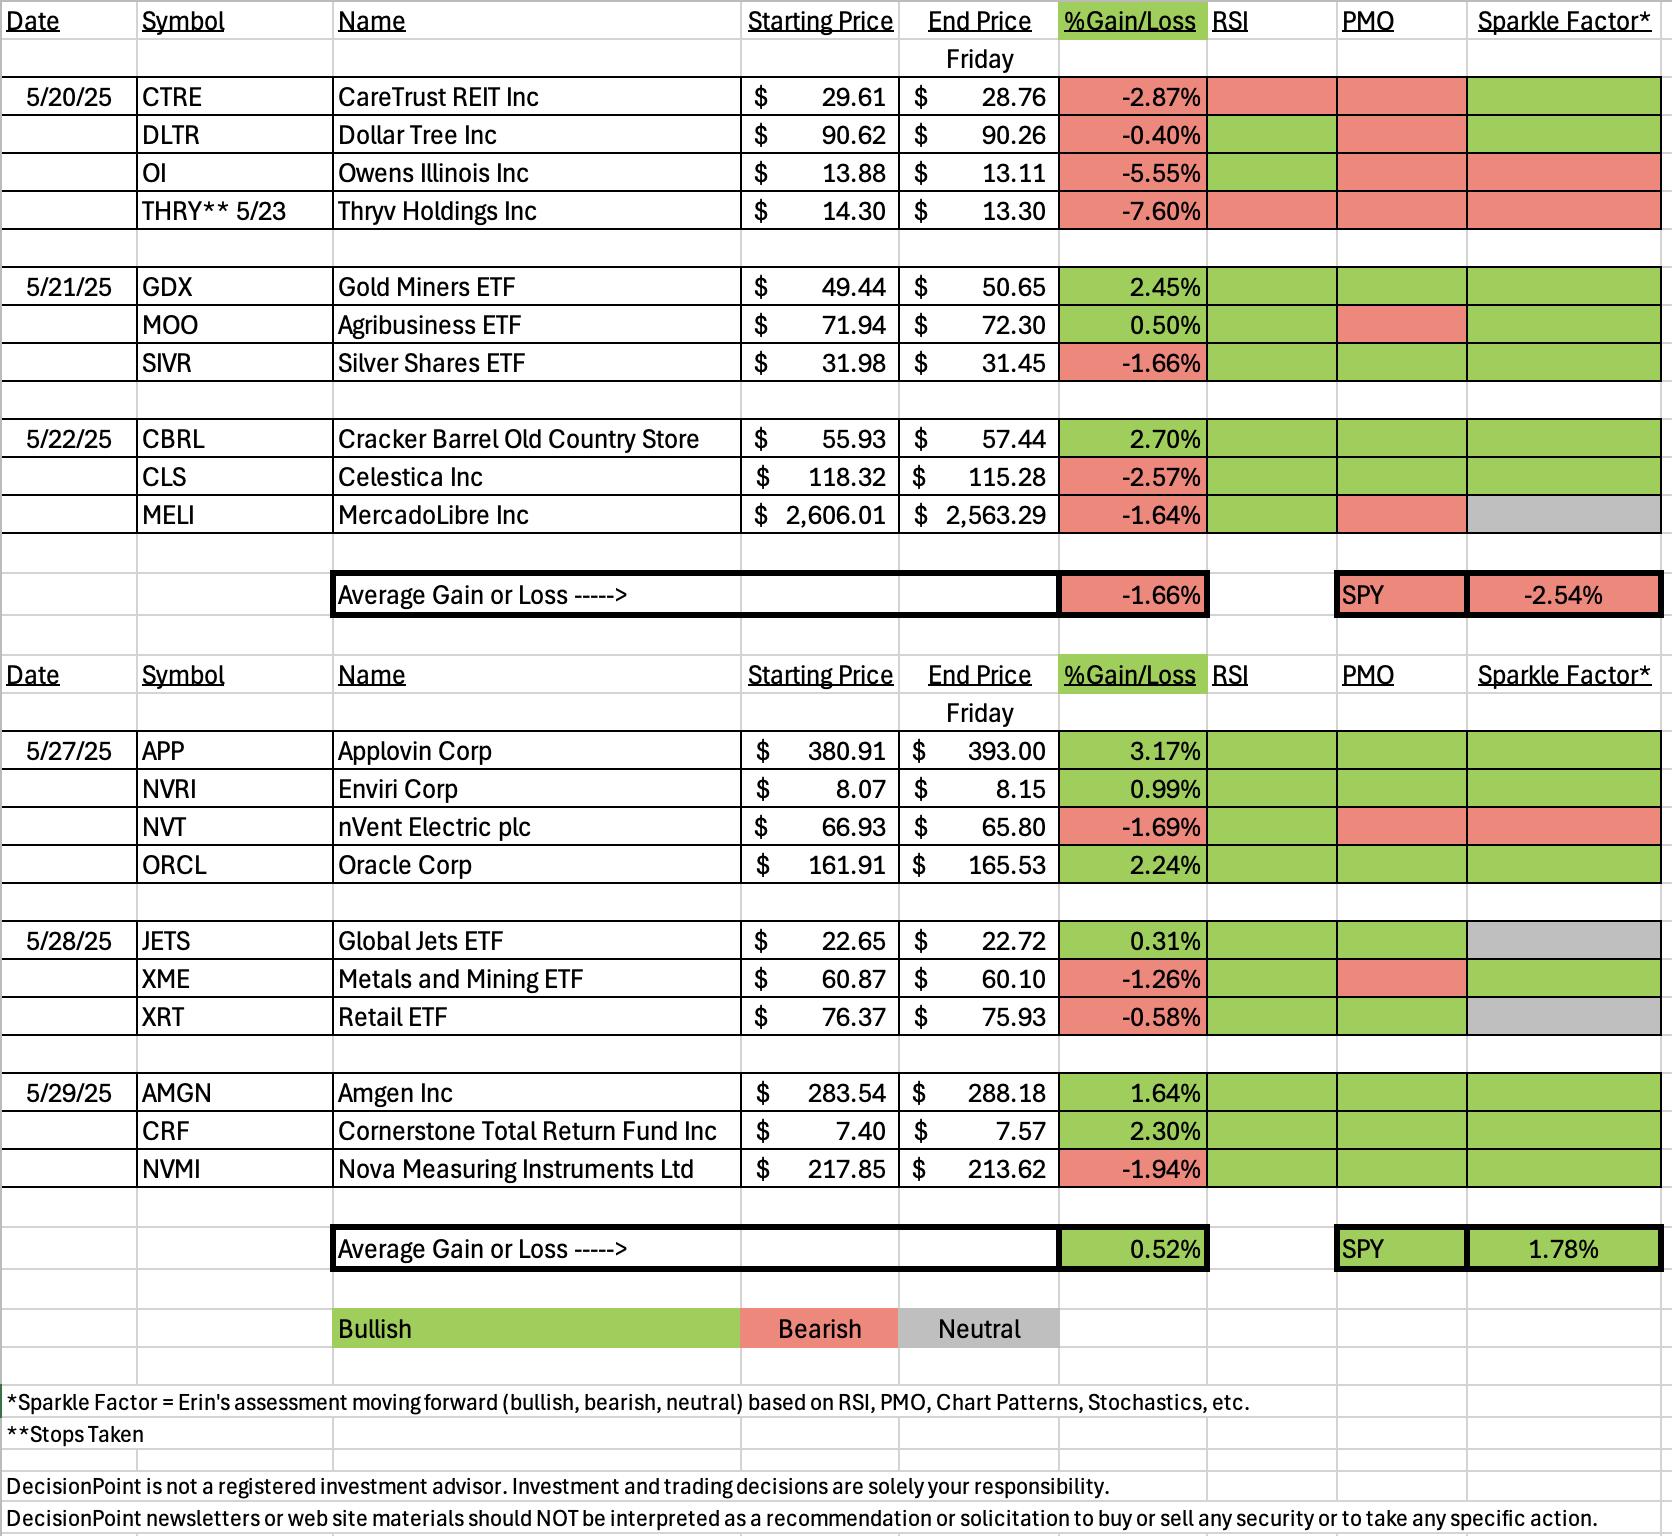
The majority of "Diamonds in the Rough" were up this week, but we didn't see a better gain than the SPY did this week. I'll give this week a B-. Let's dive in.
In today's Diamond Mine trading room we had a good sized group. We looked at the sectors and ultimately it was the defensive sectors that looked the most bullish. The majority of sectors look like they may want to double top out and PMOs had begun to fall. The majority of the room agreed with me that we should pick Consumer Staples.
It was a struggle to find an Industry Group to Watch as there were quite a few selections available with good charts. I picked Non-Durable Household Products, but we only found three stocks within as it is a small group. Those stocks were KMB, WDFC and CHD. I decided to look at Food Products which were seeing new momentum. That's the one I'm picking today. We found the following stocks within the group that looked promising: FDP, TR, CVGW and AVO.
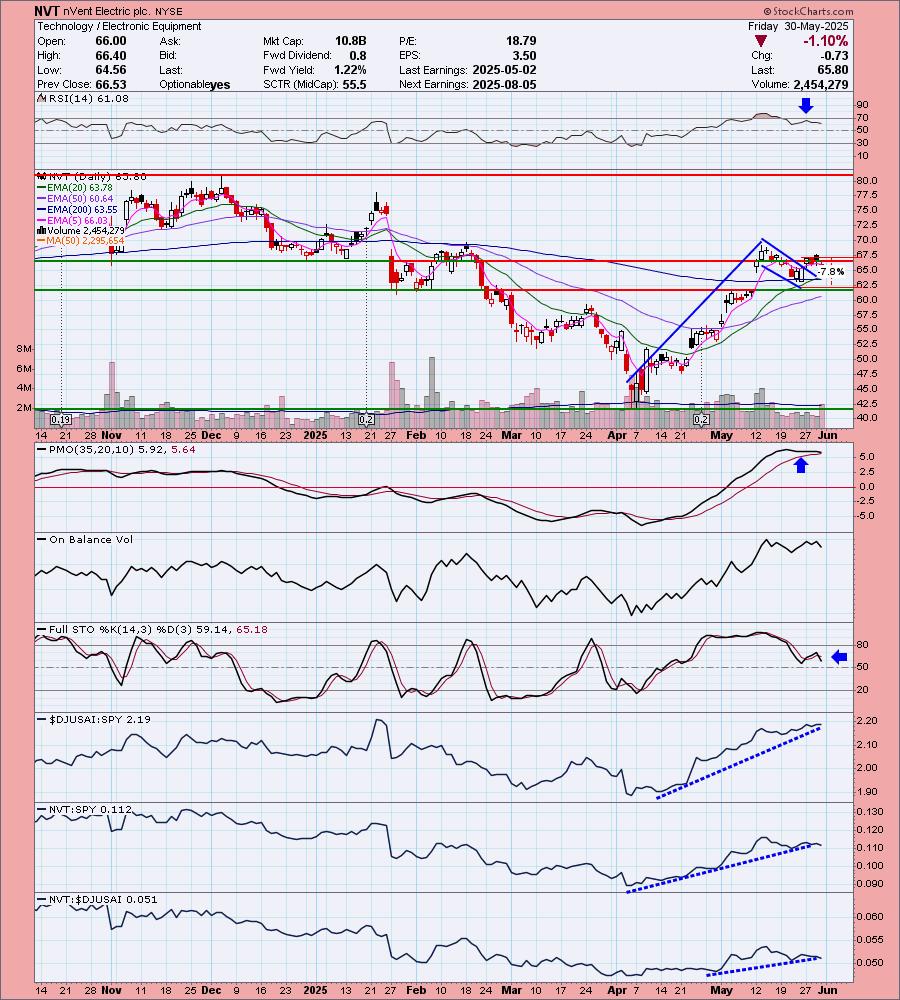
The "Darling" this week was Applovin Corp (APP) which was up +3.17% on the week. It still looks good to move higher from here. The "Dud" was nVent Electric (NVT) which was down -1.69%. Not bad, but the chart is going south. It was the only "Diamond in Rough" that I gave a bearish Sparkle Factor, meaning I don't see it as a buy anymore and could possibly be shorted.
Finally, I was able to run the Surge Scan at the end of the trading room. I found quite a few candidates that looked bullish enough to get in. Take a look at: MCY, DLR, ES, RTX, NDSN, ALL and SBCT.
Have a wonderful weekend! I'll see you next week in the Diamond Mine!
Good Luck & Good Trading,
Erin

Diamond Mine Trading Room:
RECORDING & DOWNLOAD LINK (5/30/2025):
Topic: DecisionPoint Diamond Mine (5/30/2025) LIVE Trading Room
Download & Recording LINK
Passcode: May#30th
REGISTRATION for 6/6/2025:
When: June 6, 2025 09:00 AM Pacific Time (US and Canada)
Topic: DecisionPoint Diamond Mine LIVE Trading Room
Register in advance for this webinar HERE
After registering, you will receive a confirmation email containing information about joining the webinar.
A few items about the spreadsheet: I've put on the spreadsheet whether the RSI is positive (green) or negative (red). The PMO column tells you if it is rising (green) or falling (red). Finally I've added my own "Sparkle Factor" that gives you my assessment going forward, bullish (green), bearish (red) or neutral (gray). The Sparkle Factor is basically my thoughts on whether I expect it to rise or fall. A neutral means it could really go either way so it could be added to a watch list. If you're in a stock I consider "neutral" going forward, the ball is in your court.
Darling:
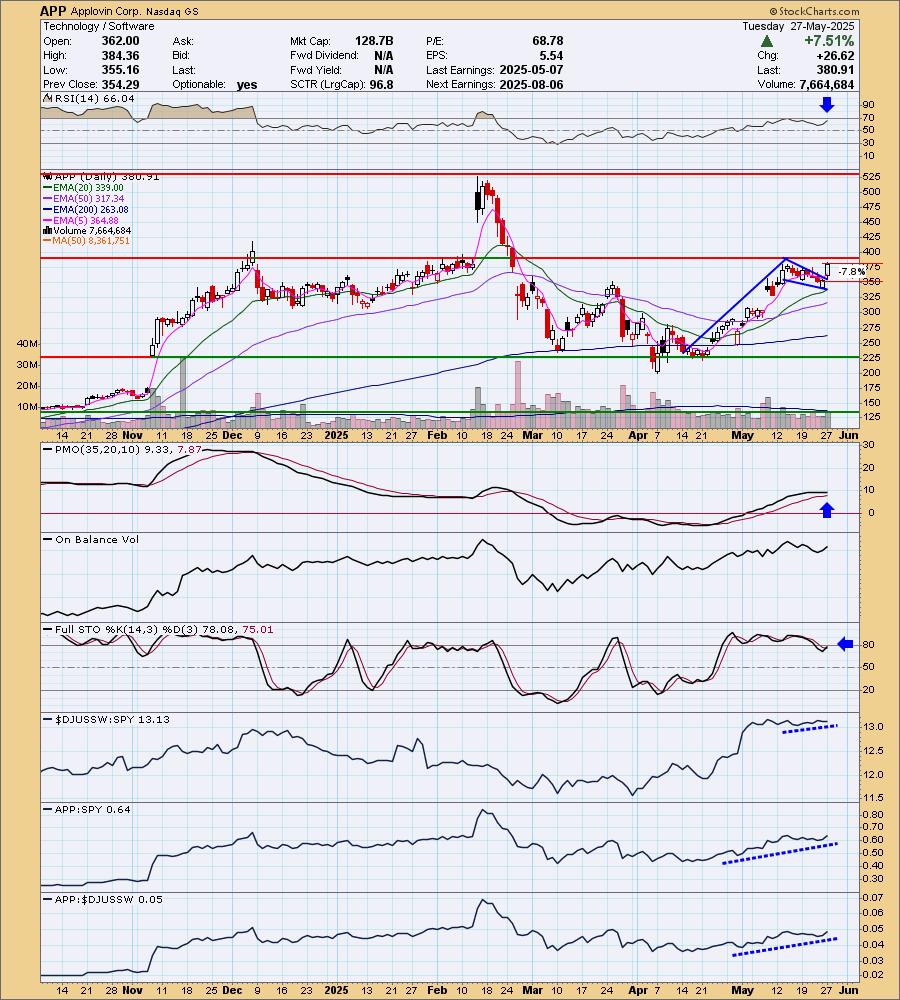
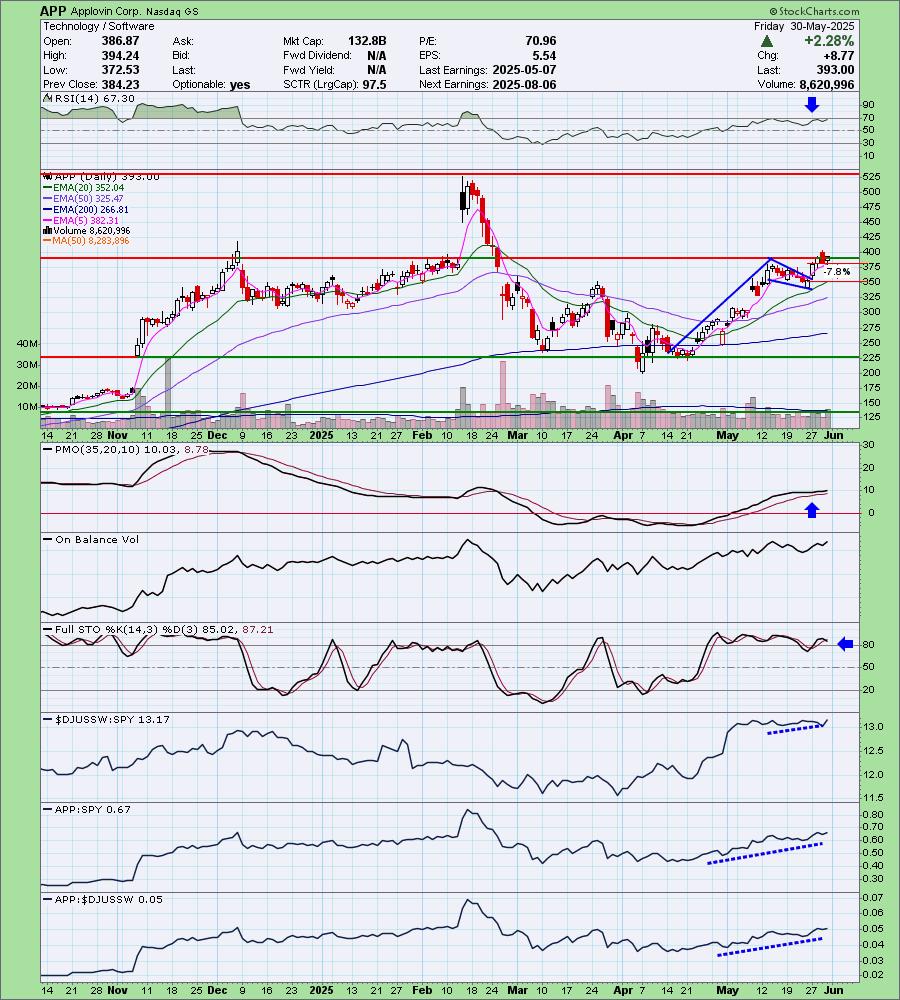
Applovin Corp. (APP)
EARNINGS: 2025-08-06 (AMC)
AppLovin Corp. engages in the development and operation of a mobile marketing platform. It offers AppDiscovery, MAX, Adjust, and SparkLabs. Its software-based platform caters to mobile application developers to improve the marketing and monetization of applications. The company was founded by Andrew Karam, John Krystynak, and Adam Foroughi in 2011 and is headquartered in Palo Alto, CA.
Predefined Scans Triggered: Moved Above Ichimoku Cloud, Elder Bar Turned Green, Moved Above Upper Price Channel, Parabolic SAR Buy Signals and P&F Double Top Breakout.
Below are the commentary and chart from Tuesday, 5/27:
"APP is down -0.04% in after-hours trading. As you'll note on all of today's charts, we have a bull flag. I didn't annotate it, but we also have a large bullish double bottom on the chart as well. It was quite a thrust upward today so we could see a small pullback that would offer a better entry. The RSI is positive and not overbought. The PMO has bottomed above the signal line. Stochastics have reversed higher and relative strength lines are all rising right now. The stop is set as close to support as possible at 7.8% or $351.19."
Here is today's chart:
It struggled yesterday, but today it had an excellent rally. It still isn't above resistance, but given the indicators, I would expect it to break out very soon. This was one flag from Tuesday that is working the way it is supposed to. Stochastics have topped, but they remain above 80 so there is still some internal strength. Technology may struggle next week as the market is looking questionable right now. Definitely use a stop if you get involved here.
Don't forget, on Thursdays I look at reader-requested symbols, so shoot me an email at erin@decisionpoint.com. I read every email I receive and try to answer them all!
Dud:
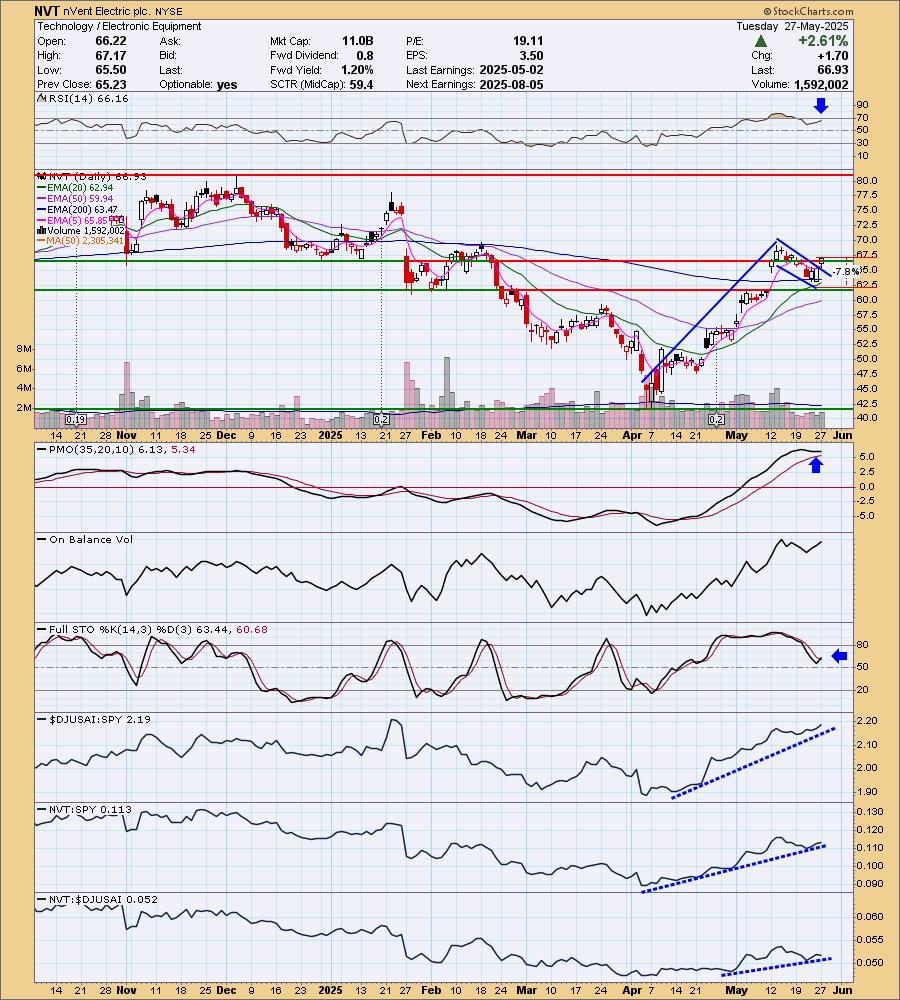
nVent Electric plc. (NVT)
EARNINGS: 2025-08-05 (BMO)
nVent Electric Plc engages in the provision of electrical connection and protection solutions. Their solutions support data centers, industrial automation, commercial buildings, power utilities, renewable energy, infrastructure, and energy storage applications globally. It operates through the following segments: Systems Protection and Electrical Connections. The Systems Protection Business segment includes enclosures, power distribution units, cooling solutions, both liquid and air, and control buildings and provide customers with products and solutions that protect electronics, systems, and data. The Electrical Connections Business segment includes power connections, cable management and electrical solutions. The company was founded on May 30, 2017 and is headquartered in London, the United Kingdom.
Predefined Scans Triggered: None.
Below are the commentary and chart from Tuesday, 5/27:
"NVT is down -0.46% in after-hours trading. Here we have yet another bull flag formation that has been confirmed with a breakout. The RSI is positive and not quite overbought yet. The OBV is rising strongly. Stochastics have turned back up in positive territory. Of course we have a PMO Surge above the signal line. Relative strength looks very positive with rising trend lines across the board. The stop is set beneath support at 7.8% or $61.70."
Here is today's chart:
I really liked the breakout from the bull flag on the chart above. I was surprised it didn't perform for us. Instead, it formed a bearish filled black candlestick that was followed by a decline today. This is starting to look like a double top formation which is why I don't believe I would enter at this juncture. The PMO is going in for Crossover SELL Signal, so maybe this one could be considered for a short.
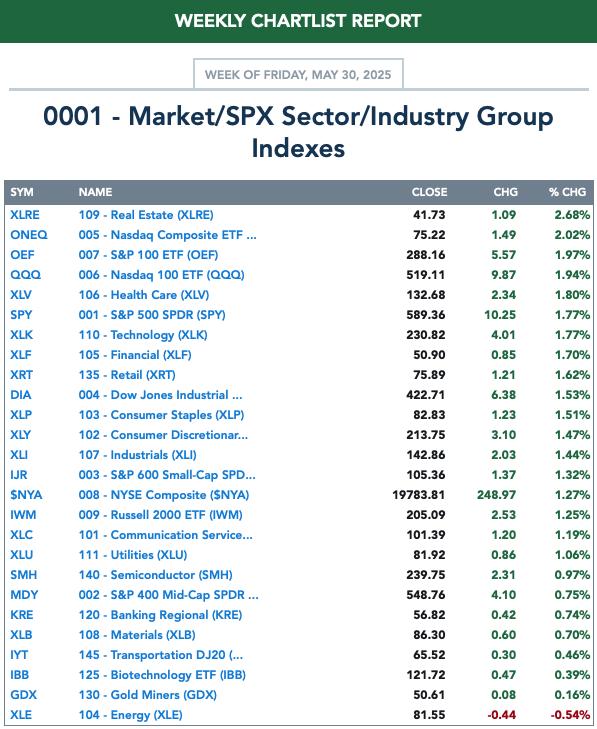
THIS WEEK's Performance:
DecisionPoint Market Scoreboard (Mechanical Trend Model Signals):
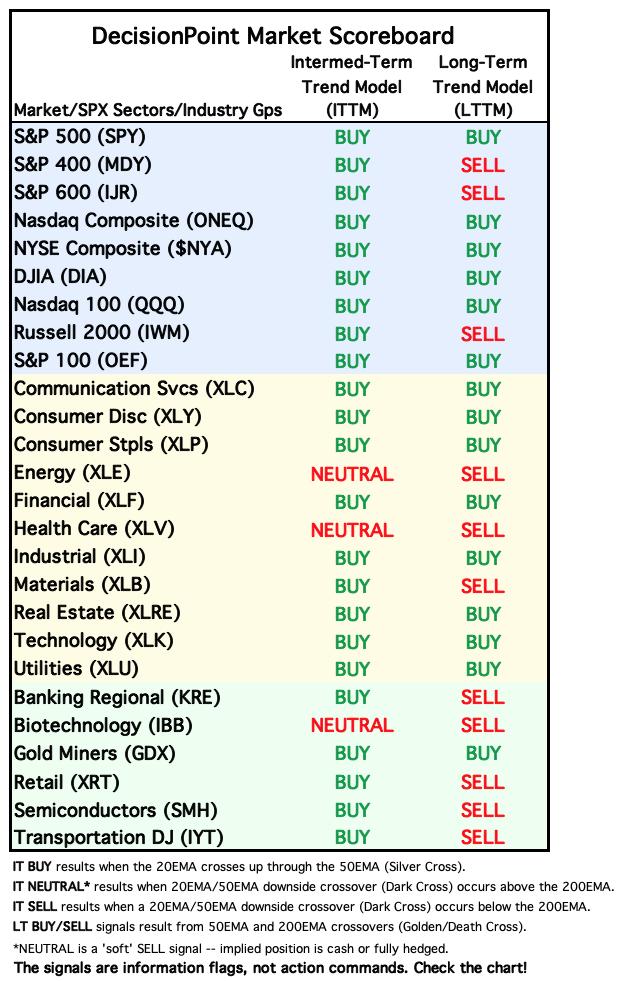
Friday signal changes are outlined in purple.
Click Here to view Carl's annotated "Under the Hood" ChartList!
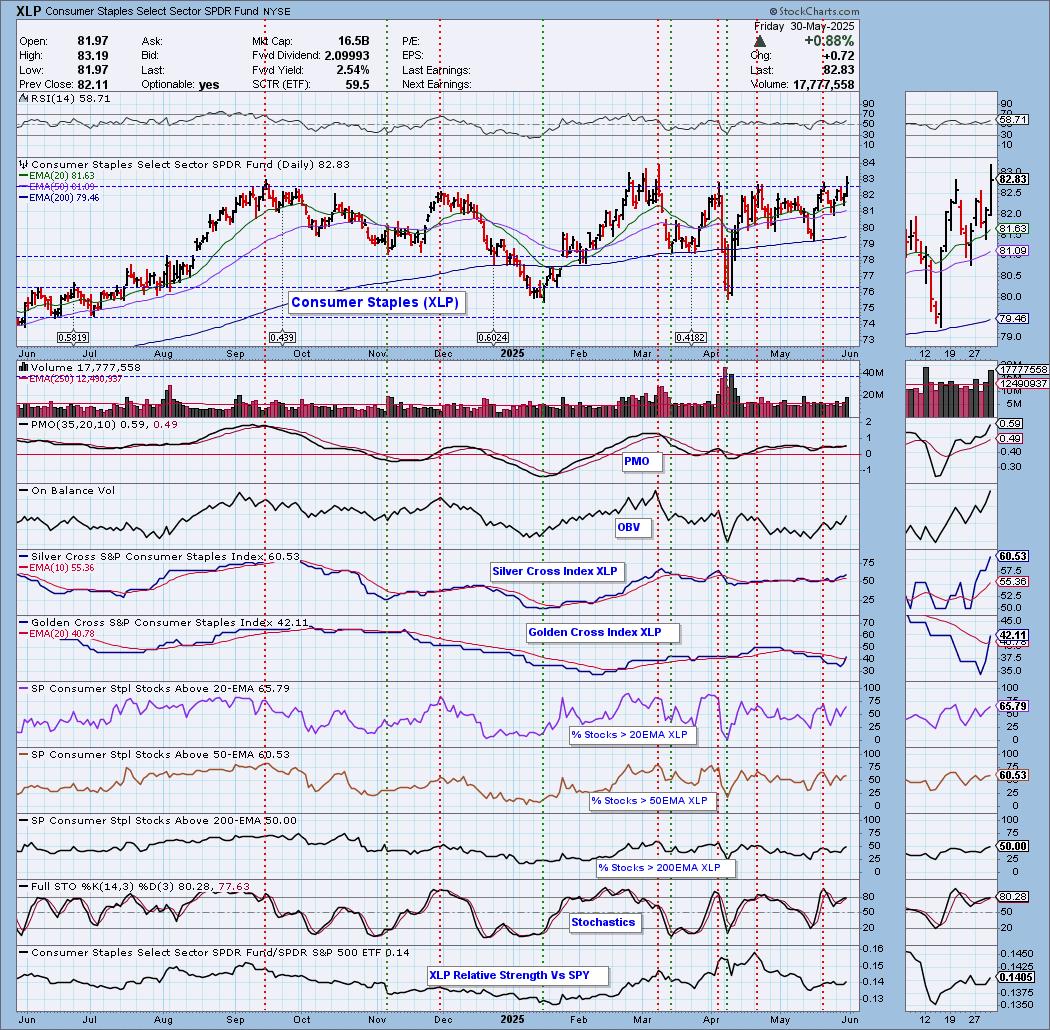
Sector to Watch: Consumer Staples (XLP)
The market may be weakening and that generally means a possible flight to defensive areas of the market. Consumer Staples (XLP) fits that bill. We do have new momentum as the PMO is accelerating higher again. It surged (bottomed) above the signal line twice leading into this advance. Price did rally above near-term resistance. It should see a breakout from the next level of resistance if it can hold together its participation readings. The RSI is positive and not overbought. The OBV is rising and confirming the latest rally. The Silver Cross Index is above its signal line giving us a BULLISH IT Bias. The Golden Cross Index just had a Bullish Shift across the signal line, moving the LT Bias to BULLISH. Participation of stocks above their 20/50/200-day EMAs is at or above our bullish 50% threshold. Stochastics are above 80 and we can see relative strength to the SPY rising. Keep an eye on this sector next week.
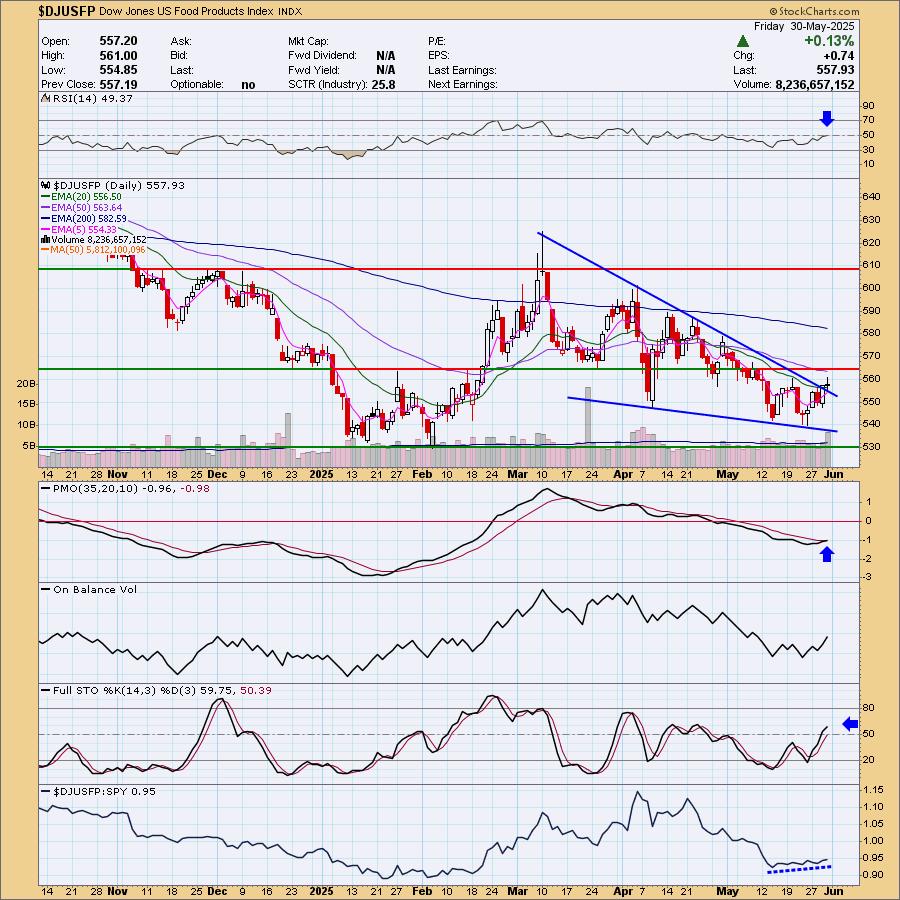
Industry Group to Watch: Food Products ($DJUSFP)
After reviewing the charts, I decided to go with Food Products as it is showing new momentum and a breakout from a bullish falling wedge. The PMO is nearing a Crossover BUY Signal. It is below the zero line as this group has been pretty beat up, but this breakout has me optimistic that this group is ready to shine again. The RSI isn't positive, but it is very close. Stochastics are rising in positive territory. We can even see that relative strength is picking back up. The stocks I liked in this group were: FDP, TR, CVGW and AVO.
Go to our Under the Hood ChartList on DecisionPoint.com to get an in-depth view of all the sectors. On StockCharts.com you can find the Industry Summary.
Good Luck & Good Trading!
- Erin
erin@decisionpoint.com
Full Disclosure: I'm 65% long, 0% short.
Watch the latest episode of the DecisionPoint Trading Room with Carl & Erin Swenlin HERE!
Technical Analysis is a windsock, not a crystal ball. --Carl Swenlin
NOTE: The stocks reported herein are from mechanical trading model scans that are based upon moving average relationships, momentum and volume. DecisionPoint analysis is then applied to get selections from the scans. The selections given should prompt readers to do a chart review using their own analysis process. This letter is not a call for a specific action to buy, sell or short any of the stocks provided. There are NO sure things or guaranteed returns on the selection of "diamonds in the rough."
Helpful DecisionPoint Links:
DecisionPoint Shared ChartList and DecisionPoint Chart Gallery
Price Momentum Oscillator (PMO)
Swenlin Trading Oscillators (STO-B and STO-V)
(c) Copyright 2025 DecisionPoint.com