
Yesterday's longs aren't working out so well so I guess I should've gone with shorts rather than longs. Today I'm going to give you some hedges.
First is the inverse for the 7-10 year Bonds (PST). I see a shift in interest rates. They are moving higher again and this will set up this inverse ETF well.
The second is the inverse of the ARKK fund (SARK) which I'm counting on to do well as the market rolls over.
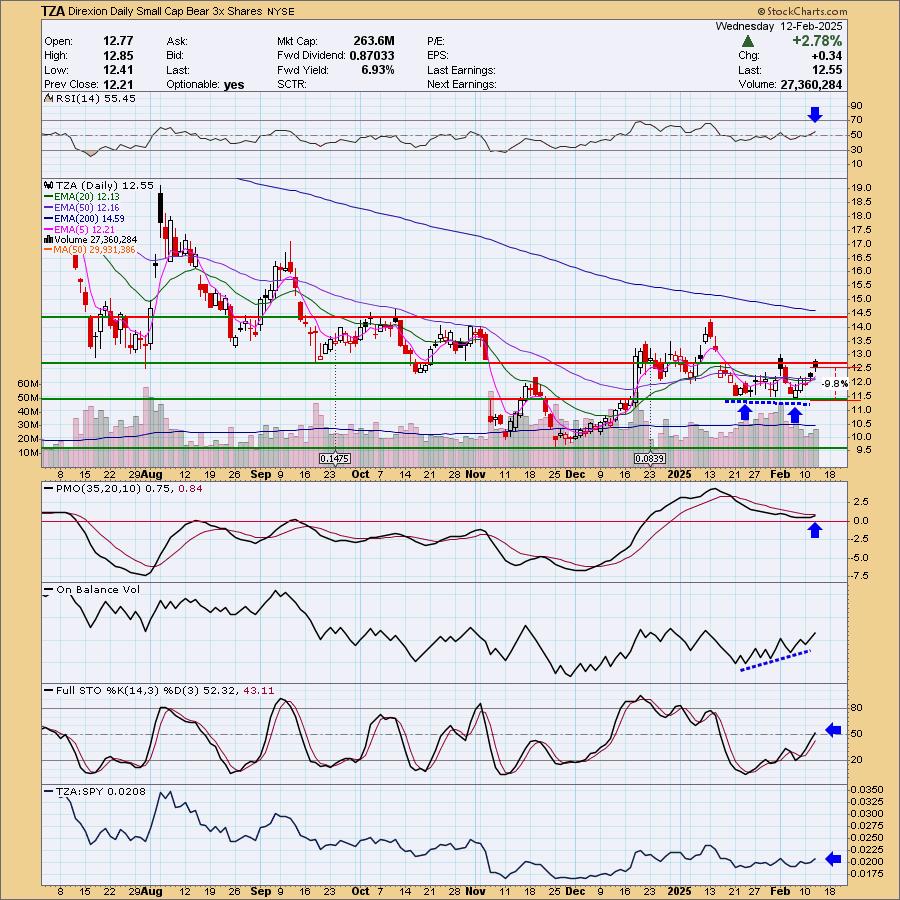
The third is the inverse of the SP600 (TZA) which is a 3x leveraged ETF so if I'm right about the market, I believe we'll see some serious declines in the small-caps.
These are some of my favorite shorting ETFs, but you could also look at others that you favor.
I've sold nearly all of my positions, but am looking at adding a hedge. PST looks great to me and I'm partial to TZA, but SARK is certainly in the running.
By the way, only SARK came up in my scans today. The others were picked based on my outlook for both the market and Bonds.
Tomorrow is Reader Request Day. I have a feeling it will be light on the long side. See what you can come up with on the short side too!
Good Luck & Good Trading,
Erin
Today's "Diamonds in the Rough": PST, SARK and TZA.

Diamond Mine Trading Room:
RECORDING & DOWNLOAD LINK (2/7/2025):
Topic: DecisionPoint Diamond Mine (2/7/2025) LIVE Trading Room
Download & Recording LINK
Passcode: February#7
REGISTRATION for 2/14/2025:
When: February 14, 2025 09:00 AM Pacific Time (US and Canada)
Topic: DecisionPoint Diamond Mine LIVE Trading Room
Register in advance for this webinar HERE
After registering, you will receive a confirmation email containing information about joining the webinar.

Below is the latest free DecisionPoint Trading Room recording from 2/10. You'll find these recordings posted on Mondays to our DP YouTube Channel. Be sure and subscribe HERE.
Welcome to DecisionPoint Diamonds, wherein I highlight ten "Diamonds in the Rough" per week. These are selected from the results of my DecisionPoint Scans which search for stocks that could benefit from the trend and condition of the market. Remember, these are not recommendations to buy or sell, but are the most interesting of the stocks that surfaced in my scans. My objective is to save you the work of the initial, tedious culling process, but you need to apply your own analysis to see if these stocks pique your interest as well. There are no guaranteed winners here!
"Predefined Scans Triggered" are taken from StockCharts.com using the "Symbol Summary" option instead of a "SharpChart" on the workbench.
Stop levels are all rounded down.
ProShares UltraShort 7-10 Year Treasury (PST)
EARNINGS: N/A
PST provides 2x inverse daily resetting exposure to a market-value-selected and -weighted index of US Treasury bonds with remaining maturities between 7 and 10 years. Click HERE for more information.
Predefined Scans Triggered: None.
PST is down -1.81% in after hours trading so a better entry may be available tomorrow. The 10-year yield chart that I look at everyday looks nearly the same, bullish with a breakout as the declining trend has now been broken. The RSI is now in positive territory. The PMO is turning back up above the zero line. We see a slight positive divergence between OBV lows and price lows. Stochastics are rising strongly and relative strength is picking up. One nice thing is that you don't have to set a very deep stop. This also means that upside potential could be somewhat limited as it is a somewhat slow mover typically. The stop is set below the 200-day EMA at 5.6% or $23.07.
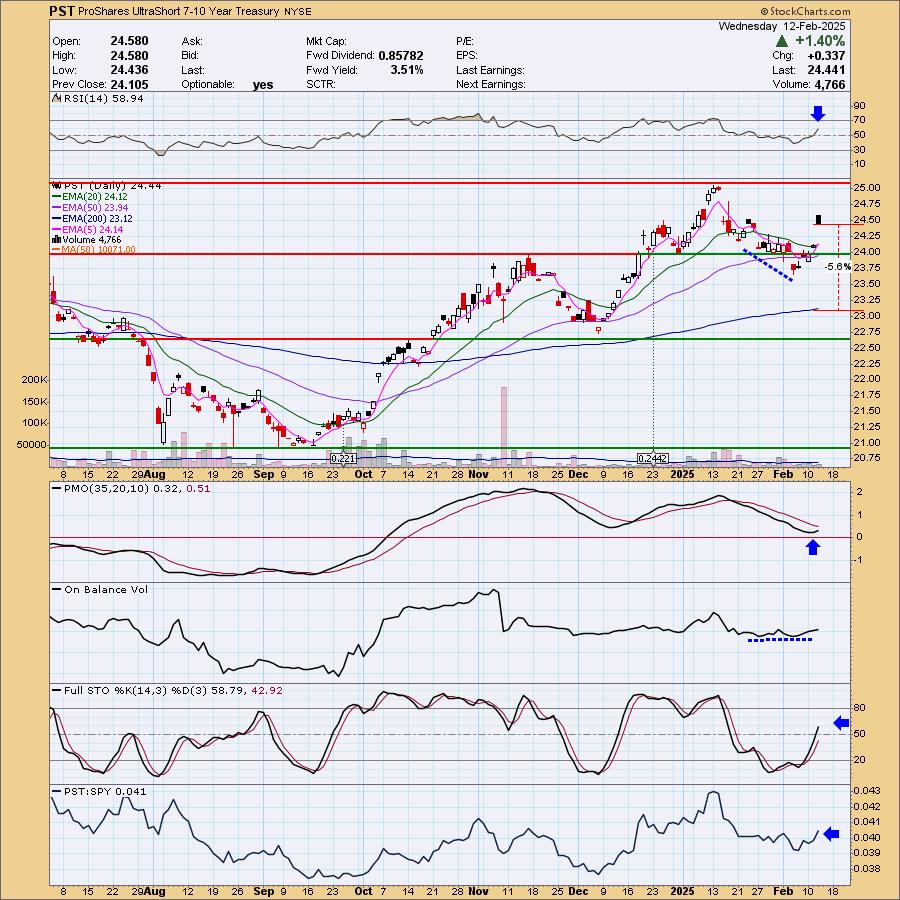
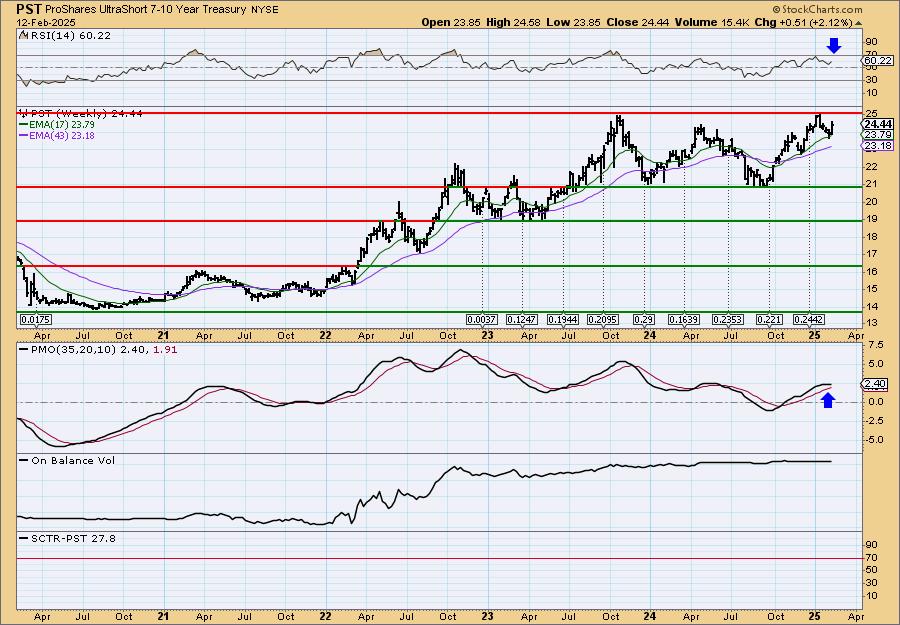
We do have very strong resistance arriving soon, but I believe we'll see a breakout. There is a positive weekly RSI and the weekly PMO has surged above the signal line. Since upside potential could be limited, I would look at a 12% upside target to about $27.37.
*If a stock is in the "hot zone" above 70, it implies that it is stronger than 70% of its universe (large-, mid-, small-caps and ETFs) primarily in the intermediate to long terms.
Tradr 2X Short Innovation Daily ETF (SARK)
EARNINGS: N/A
SARK is an actively managed fund that seeks to achieve -2x the return, for a single day, of the ARK Innovation ETF (ARKK) through swap agreements with major global financial institutions. Click HERE for more information.
Predefined Scans Triggered: Bearish Engulfing and Elder Bar Turned Red.
SARK is down -0.12% in after hours trading. The price pattern isn't that positive right now, but remember, this is a hedge in case the market takes a turn for the worse. Price is trying to form a cup shaped bottom. The RSI is unfortunately negative below net neutral (50), but the PMO is still rising despite today's big decline. There is a positive OBV divergence. Stochastics have stagnated, but are still technically rising. Given this is leveraged, I'm going with a deep stop at 9.4% or $30.25.
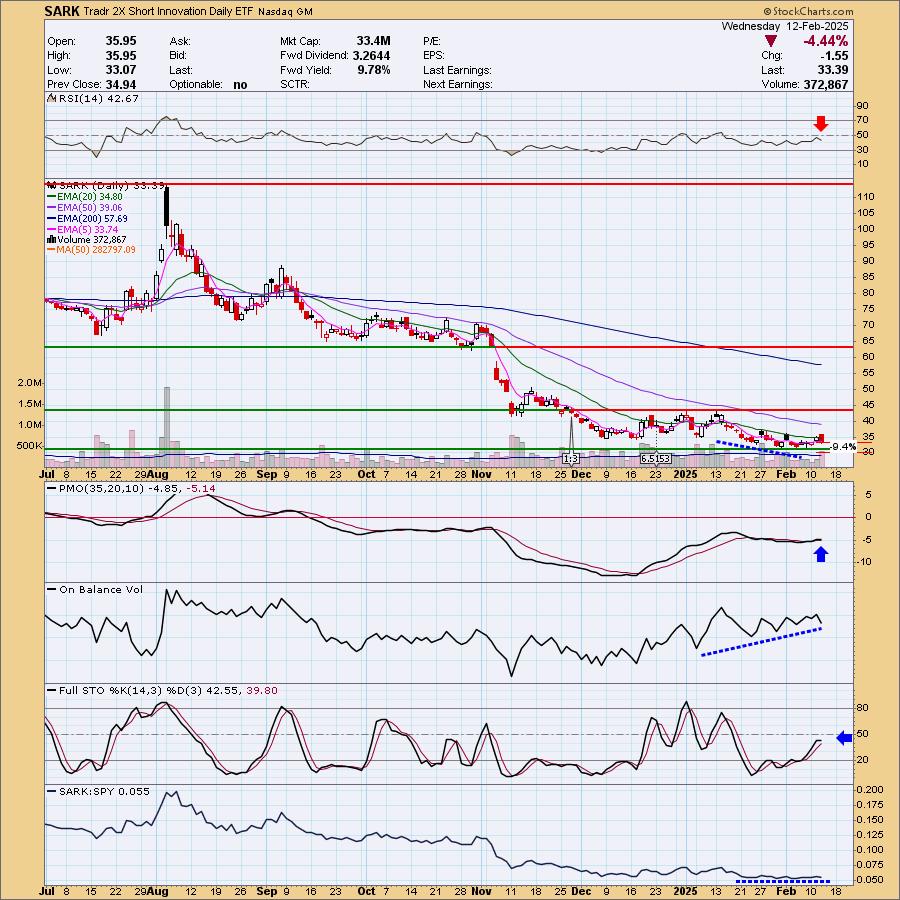
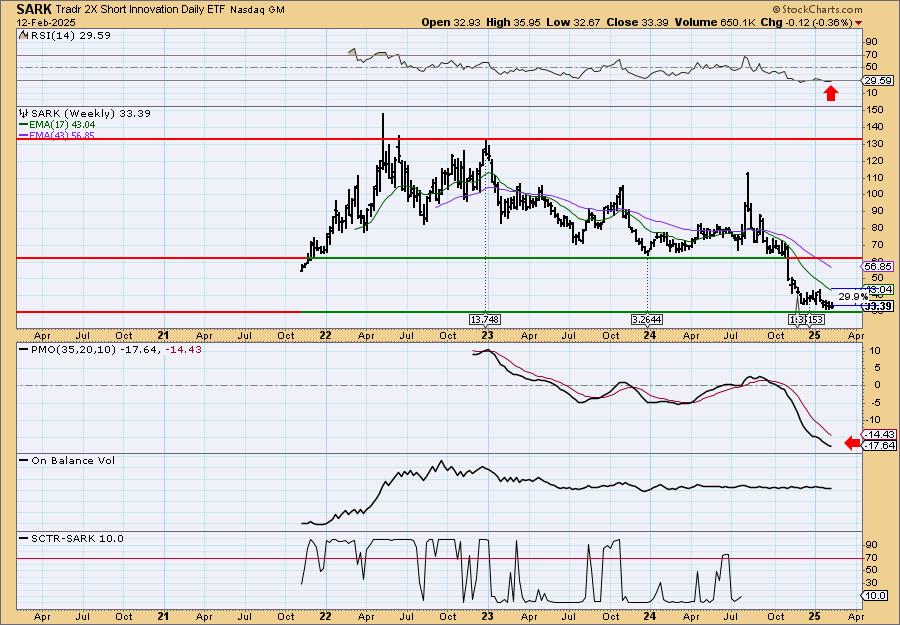
The weekly chart looks terrible, but again this is a hedge against a decline in Technology & Innovation. That area has been performing fairly well and that put this ETF in the tank. The weekly RSI is very oversold, but consequently very weak. The weekly PMO is in decline and the StockCharts Technical Rank (SCTR) is in the basement (but it is rising again). We want to see the SCTR in the hot zone* above 70. If price can get to the prior top it would be a sizable profit.
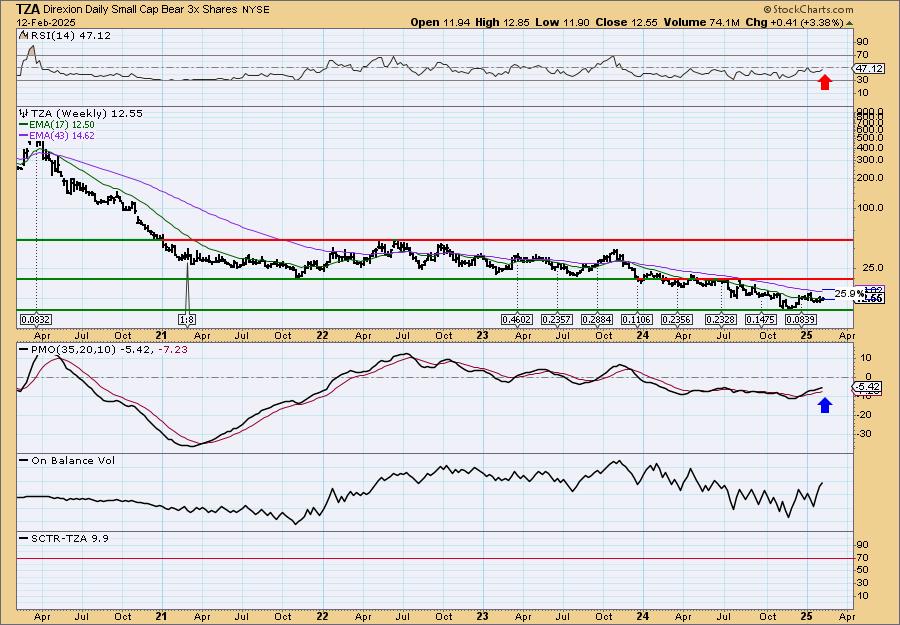
Direxion Daily Small Cap Bear 3x Shares (TZA)
EARNINGS: N/A
TZA provides -3x leveraged exposure to a market-cap-weighted index of US small-cap companies. Click HERE for more information.
Predefined Scans Triggered: Filled Black Candles, Bullish MACD Crossovers and New CCI Buy Signals.
TZA is down -0.16% in after hours trading. It was a filled black candle at overhead resistance, so I would say there is a chance that it will move lower tomorrow, but that would offer a better entry on this hedge. We have a positive RSI that is not at all overbought. There is a bullish double bottom on the chart. The PMO is rising toward a Crossover BUY Signal. We have a positive OBV divergence as more volume is arriving in this ETF. Stochastics are now in positive territory and we are seeing a little bit of outperformance. This is leveraged so the stop is deep. The stop is set beneath support at 9.8% or $11.32.
This does look like a very interesting bottom on the weekly chart. While the weekly RSI is negative, the weekly PMO is on the rise. If it can get above the next top it would be an excellent return.
Don't forget, on Thursdays I look at reader-requested symbols, click HERE to send me an email. I read every email I receive and try to answer them all!
Current Market Outlook:
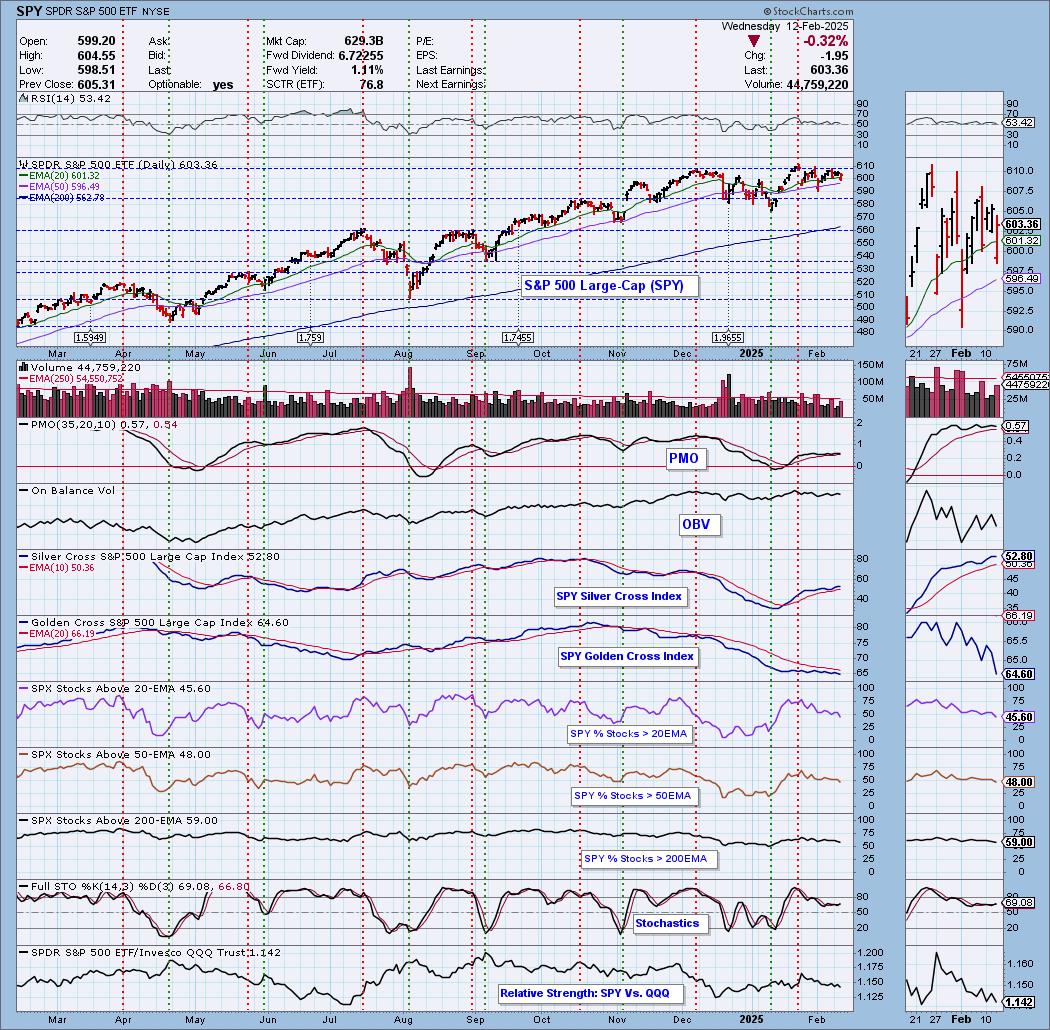
Market Environment: It is important to consider the odds for success by assessing the market tides. The following chart uses different methodologies for objectively showing the depth and trend of participation for intermediate- and long-term time frames.
- The Silver Cross Index (SCI) shows the percentage of SPX stocks on IT Trend Model BUY signals (20-EMA > 50-EMA)
- The Golden Cross Index (GCI) shows the percentage of SPX stocks on LT Trend Model BUY signals (50-EMA > 200-EMA)
Don't forget that as a "Diamonds" member, you have access to our "Under the Hood" curated ChartList on DecisionPoint.com. You'll find it under "Members Only" links on the left side on the Blogs and Links Page.
Here is the current chart:
Full Disclosure: I am 15% long, 0% short. Looking at all three ETFs for possible adds.
I'm required to disclose if I currently own a stock I mention and/or may buy/short it within the next 72 hours.
"Technical Analysis is a windsock, not a crystal ball." - Carl Swenlin
(c) Copyright 2025 DecisionPoint.com
Watch the latest episode of DecisionPoint Trading Room with Carl & Erin Swenlin Mondays on the DecisionPoint YouTube channel here!
NOTE: The stocks reported herein are from mechanical trading model scans that are based upon moving average relationships, momentum and volume. DecisionPoint analysis is then applied to get five selections from the scans. The selections given should prompt readers to do a chart review using their own analysis process. This letter is not a call for a specific action to buy, sell or short any of the stocks provided. There are NO sure things or guaranteed returns on the daily selection of "Diamonds in the Rough."
Regarding BUY/SELL Signals: The signal status reported herein is based upon mechanical trading model signals and crossovers. They define the implied bias of the price index/stock based upon moving average relationships and momentum, but they do not necessarily call for a specific action. They are information flags that should prompt chart review. Further, they do not call for continuous buying or selling during the life of the signal. For example, a BUY signal will probably (but not necessarily) return the best results if action is taken soon after the signal is generated. Additional opportunities for buying may be found as price zigzags higher, but the trader must look for optimum entry points. Conversely, exit points to preserve gains (or minimize losses) may be evident before the model mechanically closes the signal.
Helpful DecisionPoint Links:
Price Momentum Oscillator (PMO)
Swenlin Trading Oscillators (STO-B and STO-V)
For more links, go to DecisionPoint.com