
I'd like a "do over" this week. It wasn't good and I owe you better. The market is the main culprit as it slides in a declining trend channel. The internals on the indexes are weak and getting weaker so I would expect more downside in our future. This means adhering to your stops and possibly adding some shorts. In the coming week, I do plan on including some shorting opportunities. We discussed inverse ETFs this morning in the trading room.
This week's "Darling" was Grid Dynamics (GDYN) which was up +2.87% this week since being picked on Tuesday. It was the only position up on the week, but I will say that I'm not ready to dump all of the other picks. In fact, this week's "Dud" CF Industries (CF) which hit its stop, looks encouraging in that it has reached strong support and could reverse from here. We have similar setups that I've marked with "Neutral" Sparkle Factors. So while we did see them decline, there is a possibility of some rally ahead. With market weak, it will be tough to get those turnarounds, but they still seem okay as holds, not necessarily buys.
The Sector to Watch this week is Utilities (XLU). With the market showing weakness I'm expecting this defensive group to hang in there. I could also have picked Financials (XLF) or Real Estate (XLRE) which also looked good under the hood.
The Industry Group to Watch is Multiutilities. We were going to go with Conventional Electricity, but I couldn't find any bullish charts within the group so we went with Multiutilities which did have some symbols of interest: AEE, WEC, DUK and ED.
I ran a few scans at the end of the trading room. They weren't very prolific, but we did manage to find some possibly choices for next week: EXPE, LNC, UBER and SLM.
Have a wonderful weekend!
Good Luck & Good Trading,
Erin

Diamond Mine Trading Room:
RECORDING & DOWNLOAD LINK (2/7/2025):
Topic: DecisionPoint Diamond Mine (2/7/2025) LIVE Trading Room
Download & Recording LINK
Passcode: February#7
REGISTRATION for 2/14/2025:
When: February 14, 2025 09:00 AM Pacific Time (US and Canada)
Topic: DecisionPoint Diamond Mine LIVE Trading Room
Register in advance for this webinar HERE
After registering, you will receive a confirmation email containing information about joining the webinar.

Below is the latest free DecisionPoint Trading Room recording from 2/3. You'll find these recordings posted on Mondays to our DP YouTube Channel. Be sure and subscribe HERE.
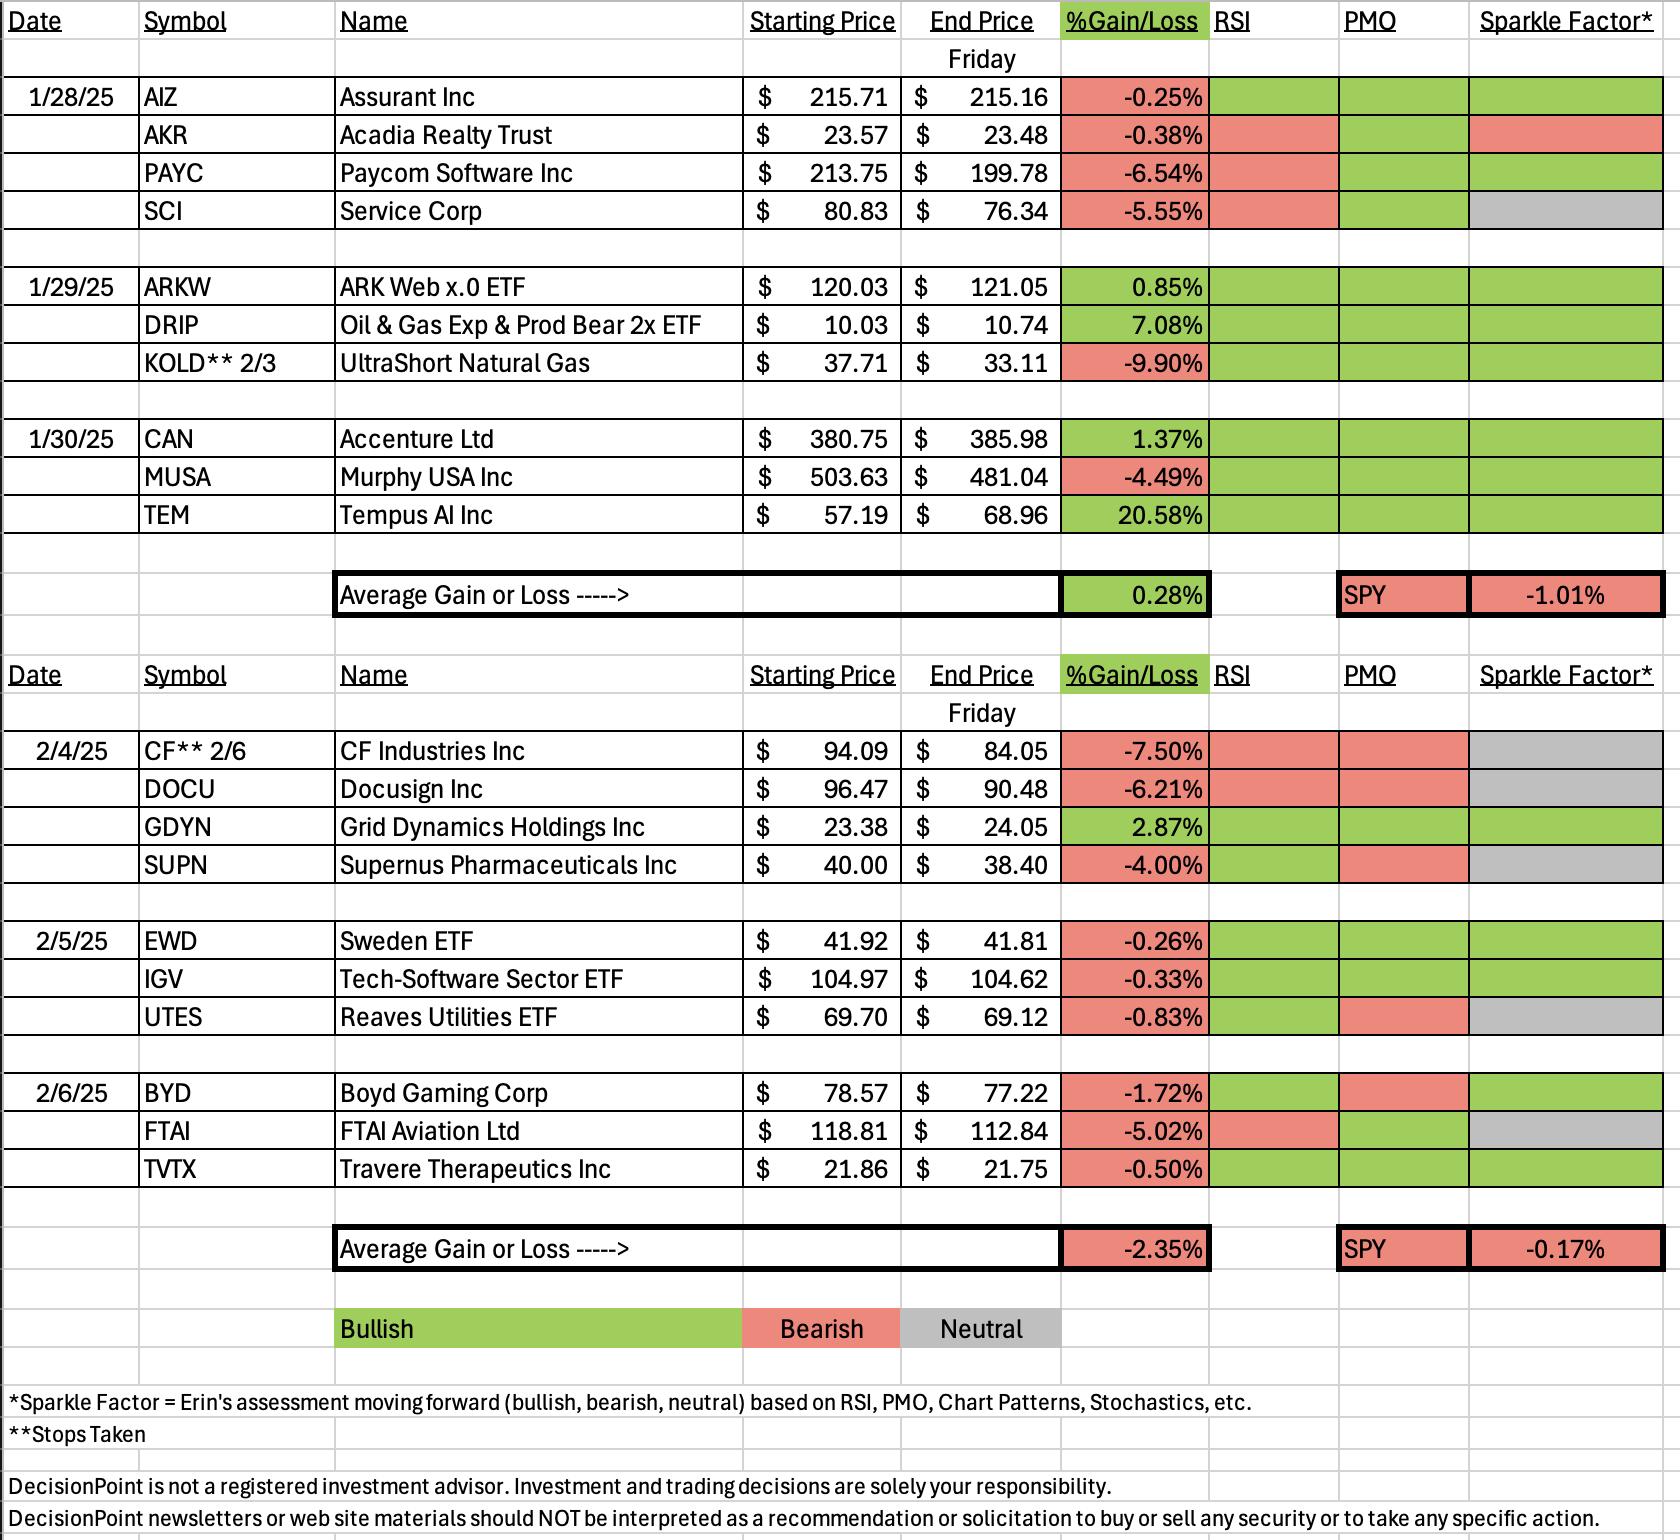
A few items about the spreadsheet: I've put on the spreadsheet whether the RSI is positive (green) or negative (red). The PMO column tells you if it is rising (green) or falling (red). Finally I've added my own "Sparkle Factor" that gives you my assessment going forward, bullish (green), bearish (red) or neutral (gray). The Sparkle Factor is basically my thoughts on whether I expect it to rise or fall. A neutral means it could really go either way so it could be added to a watch list. If you're in a stock I consider "neutral" going forward, the ball is in your court.
Darling:
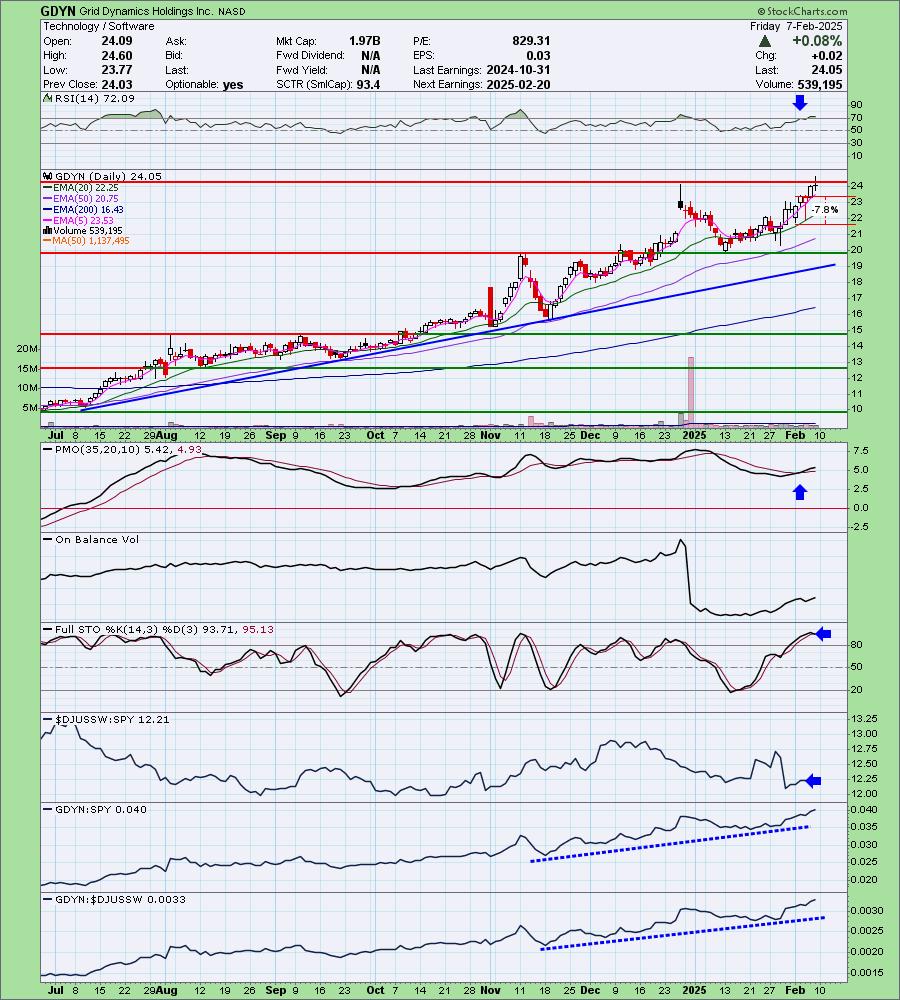
Grid Dynamics Holdings Inc. (GDYN)
EARNINGS: 2025-02-20 (AMC)
Grid Dynamics Holdings, Inc. provides digital engineering and information technology services. The firm core business is to deliver focused and complex technical consulting, software design, development, testing and internet service operations. It also helps organizations become more agile and create innovative digital products and experiences through its deep expertise in emerging technology, such as AI, data science, cloud computing, big data and DevOps, lean software development practices and a performance product culture. The company was founded by Victoria Livschitz in 2006 and is headquartered in San Ramon, CA.
Predefined Scans Triggered: Improving Chaikin Money Flow, Moved Above Upper Bollinger Band and Moved Above Upper Price Channel.
Below are the commentary and chart from Tuesday, 2/4:
"GDYN is down -1.63% in after hours trading so we could get a better entry. We have a nice rally off support. I'd prefer it not to be so close to overhead resistance, but selections were slim as I said. The RSI looks good in positive territory and the PMO is giving us a Crossover BUY Signal well above the zero line. Stochastics are rising above 80. This is another Software company. GDYN has been outperforming the group and the SPY for some time. The stop is set beneath the 20-day EMA at 7.8% or $21.55."
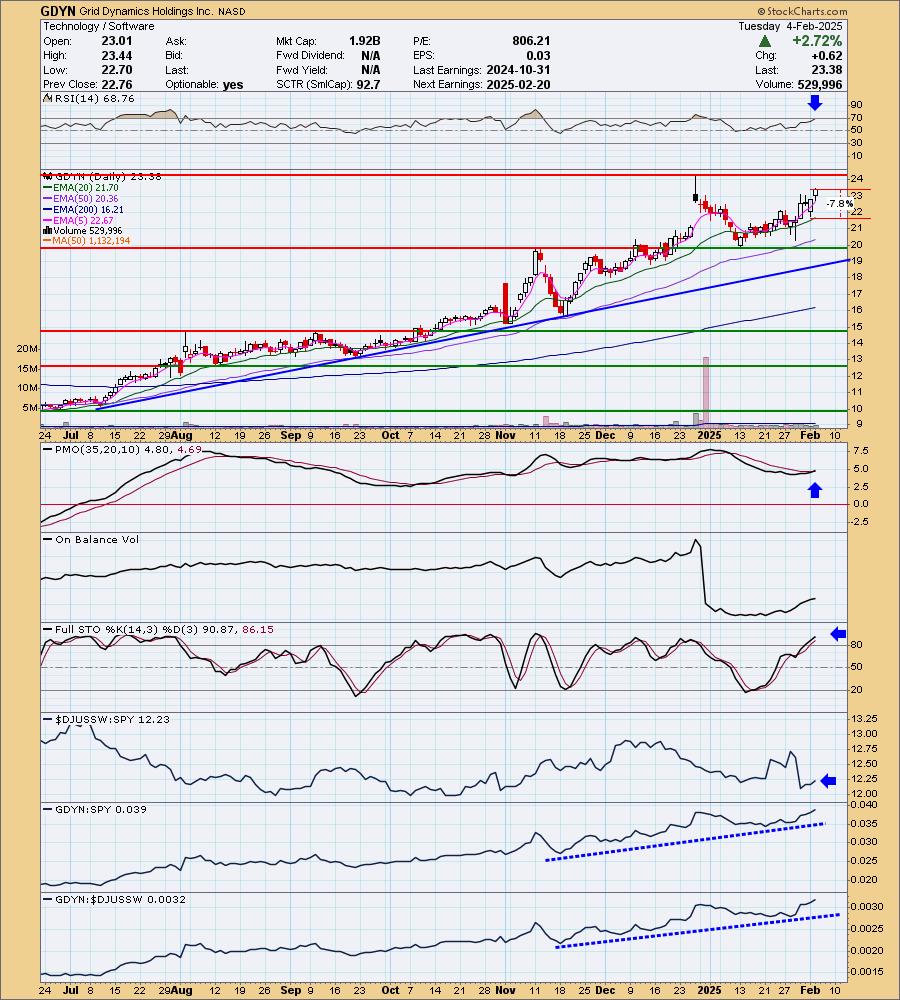
Here is today's chart:
This one still looks bullish despite being in a weak Technology sector. It does look as if it will continue higher given the strong indicators. The RSI has gotten overbought so we could see some consolidation or a small pullback once it is above resistance. It may be a little late to get in on this one given that overbought RSI, but watch it! It would likely be an excellent add once the consolidation is through.
Don't forget, on Thursdays I look at reader-requested symbols, so shoot me an email at erin@decisionpoint.com. I read every email I receive and try to answer them all!
Dud:
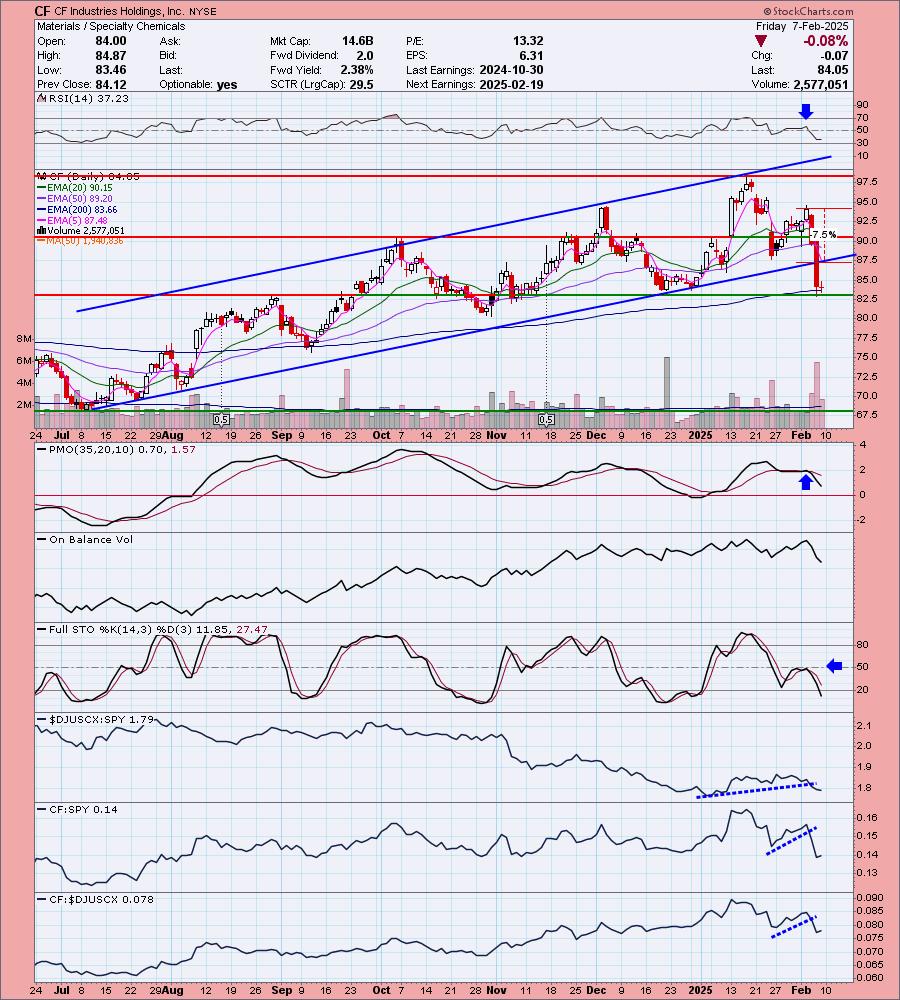
CF Industries Holdings, Inc. (CF)
EARNINGS: 2025-02-19 (AMC)
CF Industries Holdings, Inc. engages in the manufacture and distribution of nitrogen fertilizer. The firm owns and operates nitrogen plants and serves agricultural and industrial customers through its distribution system. It operates through following segments: Ammonia, Granular Urea, UAN, AN, and Other. The Ammonia segment produces anhydrous ammonia. The Granular Urea segment offers granular urea. The UAN segment creates urea ammonium nitrate solution. The AN segment makes ammonium nitrate. The Other segment includes diesel exhaust fluid, nitric acid, urea liquor, and aqua ammonia. The company was founded in 1946 and is headquartered in Northbrook, IL.
Predefined Scans Triggered: P&F Double Top Breakout.
Below are the commentary and chart from Tuesday, 2/4:
"CF is down -0.86% in after hours trading. I was drawn to the strong rising trend channel. Note that price didn't have to test the rising bottoms trendline. That is a bullish sign. The RSI is in positive territory. The PMO is on the rise. It is flat as we have a nice little rising trend coming off a difficult decline. Stochastics are nearing positive territory. The sector isn't that healthy, but the group is showing some outperformance. CF is outperforming both the SPY and the group so relative strength is in its favor. I set the stop beneath the last low and just outside of the rising trend channel at 7.5% or $87.03."
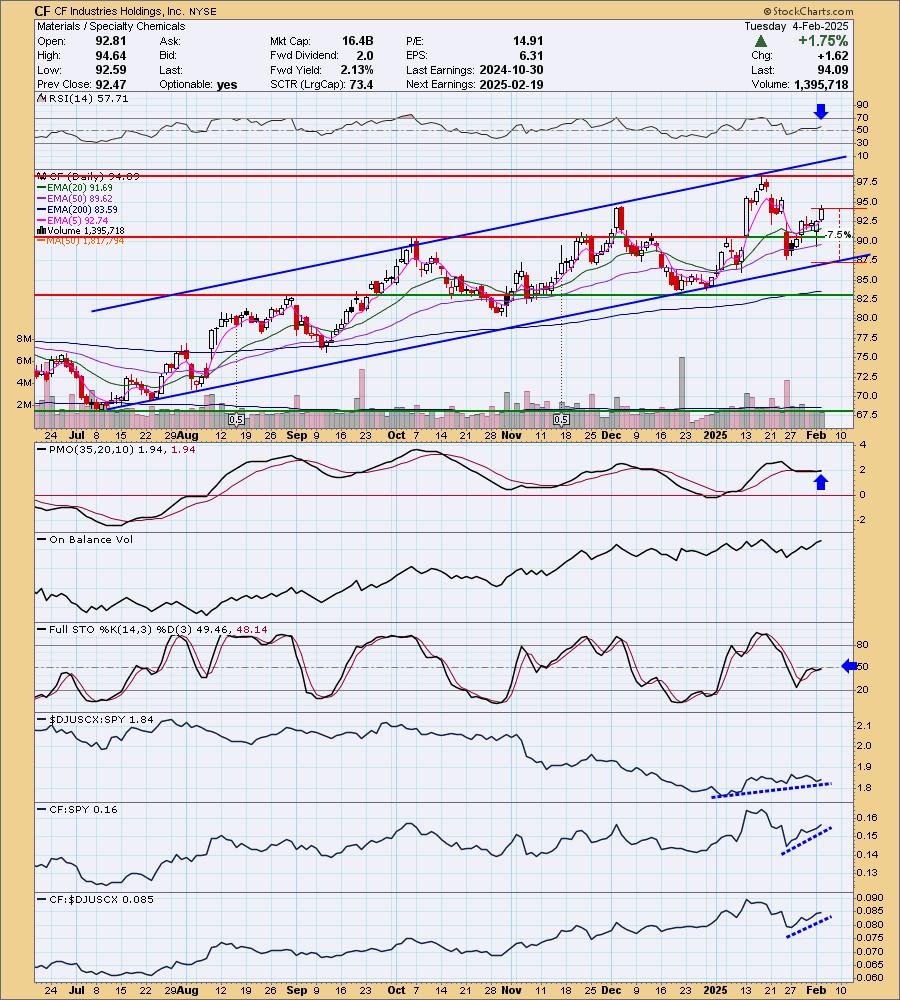
Here is today's chart:
I do not know what went wrong on this one. We had a reversal above the rising bottoms trendline and indicators looked good for the most part. If I had to point to something it would be that the PMO wasn't trending upward when it was picked; it was rising, but flat. Stochastics were also somewhat flat. It was tough to pick this week. I probably wouldn't have included it had I found better choices within the scans, but I have to say that rising trend channel held a lot of promise.
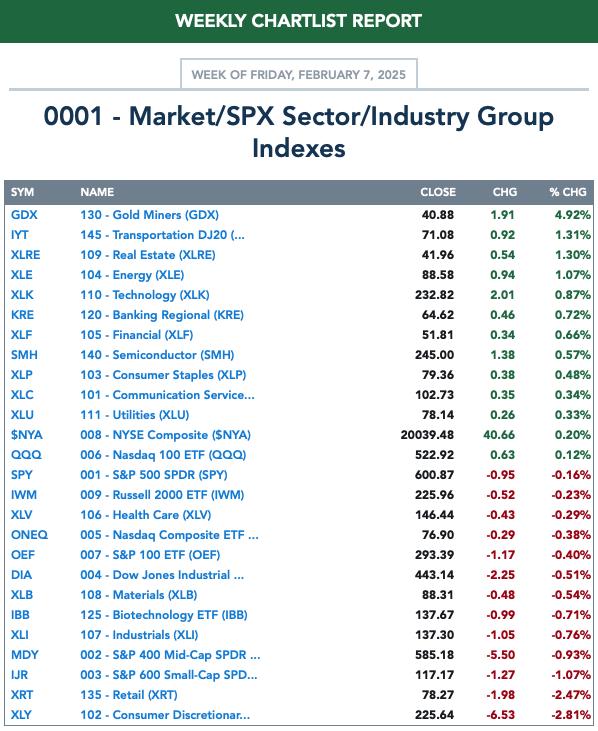
THIS WEEK's Performance:
DecisionPoint Market Scoreboard (Mechanical Trend Model Signals):
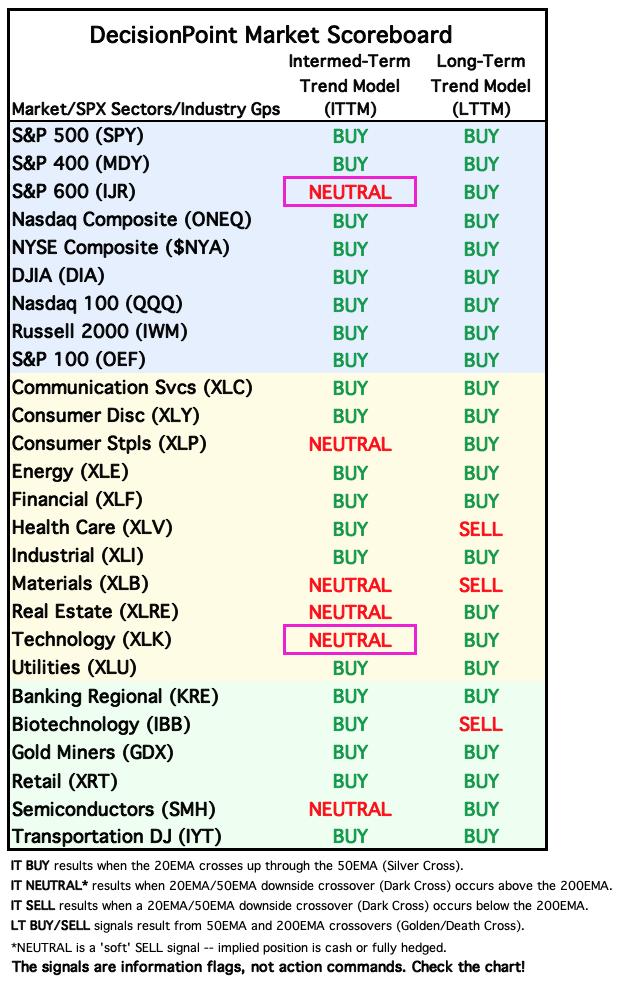
Friday signal changes are outlined in purple.
Click Here to view Carl's annotated "Under the Hood" ChartList!
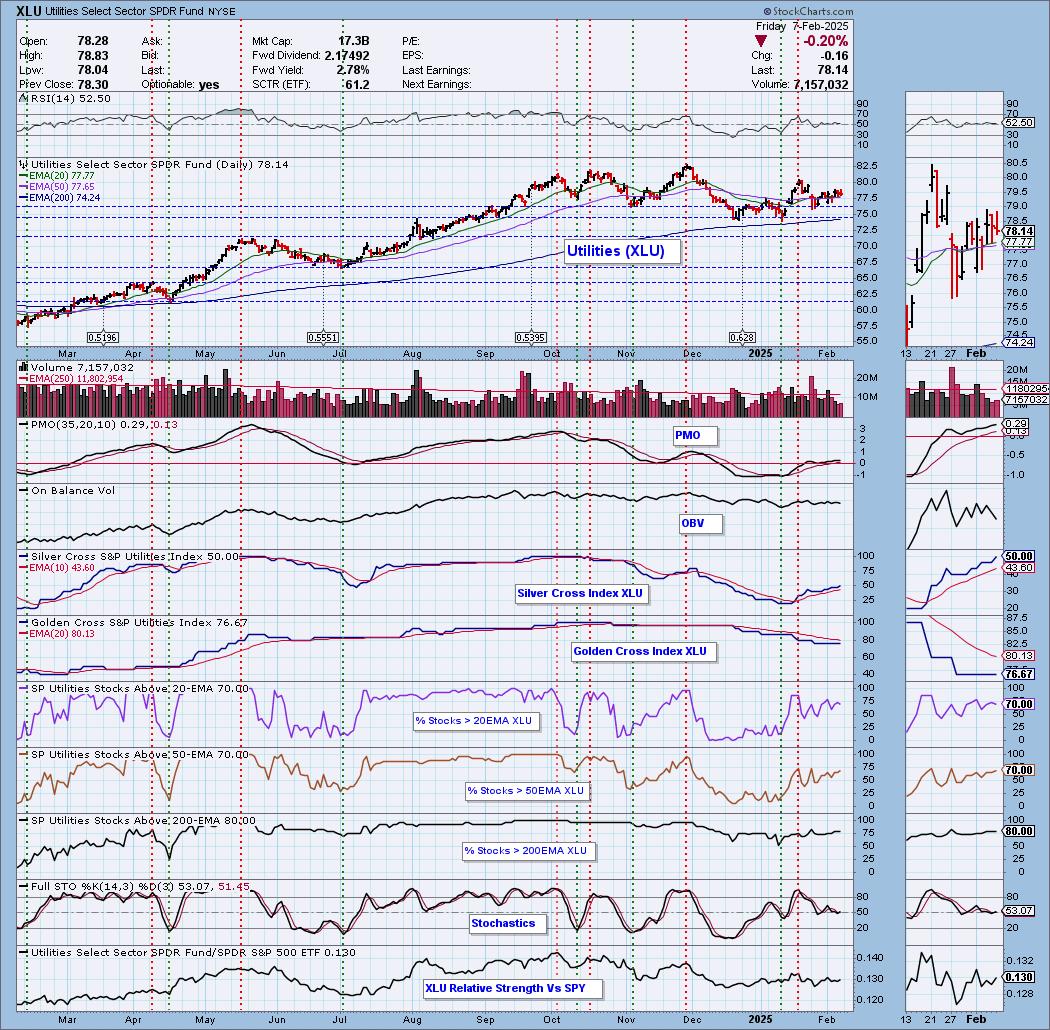
Sector to Watch: Utilities (XLU)
I picked this sector primarily due to the under the hood participation readings. They are healthy and not overbought. Best of all they are trending higher unlike the market. The RSI is positive and not overbought. The PMO is rising above the zero line. The Silver Cross Index is rising as are Stochastics. Relative strength does appear to be improving somewhat. I thought all but the Water industry group was healthy. Multiutilities was healthiest.
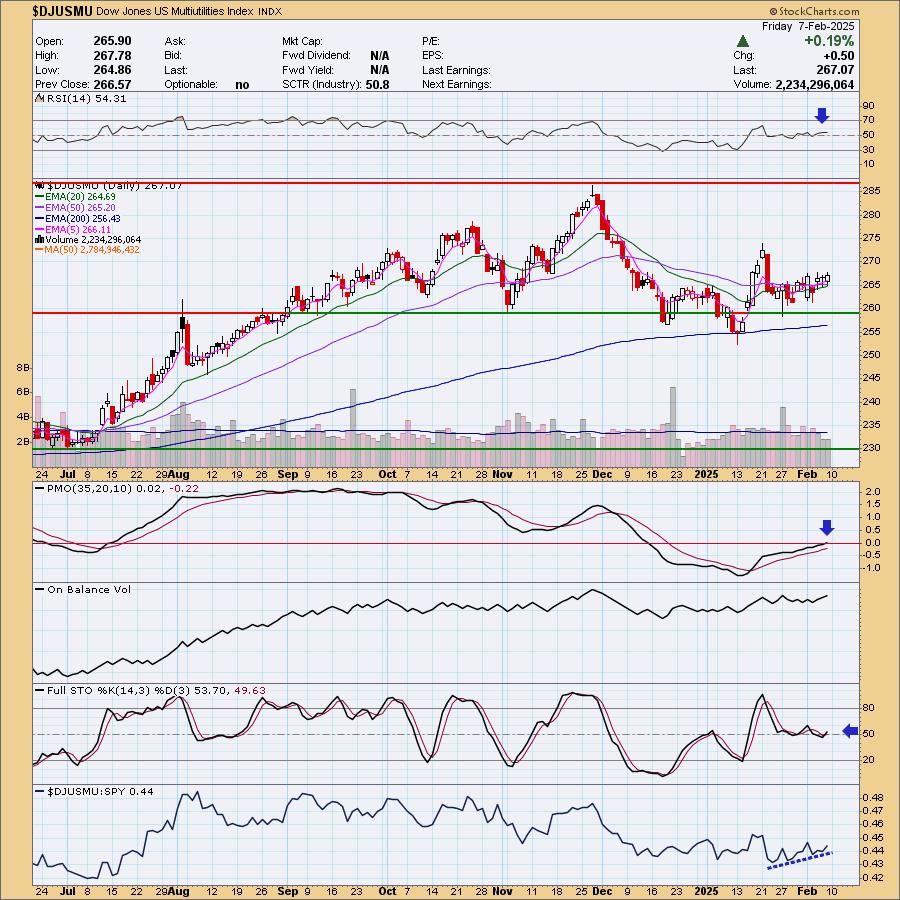
Industry Group to Watch: Multiutilities ($DJUSCS)
Price is coming off the bottom of a trading range. We have a Silver Cross of the 20/50-day EMAs nearing. The RSI is positive and not at all overbought. The PMO just crossed above the zero line. Stochastics are rising in positive territory. It isn't the strongest chart ever, but it does look like price will make an attempt at the top of the trading range.
Go to our Under the Hood ChartList on DecisionPoint.com to get an in-depth view of all the sectors. On StockCharts.com you can find the Industry Summary.
Good Luck & Good Trading!
- Erin
erin@decisionpoint.com
Full Disclosure: I'm 15% long, 0% short.
Watch the latest episode of the DecisionPoint Trading Room with Carl & Erin Swenlin HERE!
Technical Analysis is a windsock, not a crystal ball. --Carl Swenlin
NOTE: The stocks reported herein are from mechanical trading model scans that are based upon moving average relationships, momentum and volume. DecisionPoint analysis is then applied to get selections from the scans. The selections given should prompt readers to do a chart review using their own analysis process. This letter is not a call for a specific action to buy, sell or short any of the stocks provided. There are NO sure things or guaranteed returns on the selection of "diamonds in the rough."
Helpful DecisionPoint Links:
DecisionPoint Shared ChartList and DecisionPoint Chart Gallery
Price Momentum Oscillator (PMO)
Swenlin Trading Oscillators (STO-B and STO-V)
(c) Copyright 2025 DecisionPoint.com