
I wasn't thrilled with yesterday's offerings and three out of four underperformed today. They offered a better entry, but I would like to have seen less selling.
ETF Day was difficult as well with very few scan results that were worthwhile. One of today's selection is a Software ETF. The Software group has been starting to outperform based on relative strength to the SPY so I thought it did have some merit.
Another selection today is a Utilities ETF. I selected it as a possible hedge on the market should tech turn over. It is also an area that is looking more interesting under the hood after today's rally.
The third is an international ETF for Sweden. This ETF has been seeing excellent performance and it appears that this winner will keep on winning.
Good Luck & Good Trading,
Erin
Today's "Diamonds in the Rough": EWD, IGV and UTES.

Diamond Mine Trading Room:
RECORDING & DOWNLOAD LINK (1/31/2025):
Topic: DecisionPoint Diamond Mine (1/31/2025) LIVE Trading Room
Download & Recording Link
Passcode: January#31
REGISTRATION for 2/7/2025:
When: February 7, 2025 09:00 AM Pacific Time (US and Canada)
Topic: DecisionPoint Diamond Mine LIVE Trading Room
Register in advance for this webinar HERE
After registering, you will receive a confirmation email containing information about joining the webinar.

Below is the latest free DecisionPoint Trading Room recording from 2/3. You'll find these recordings posted on Mondays to our DP YouTube Channel. Be sure and subscribe HERE.
Welcome to DecisionPoint Diamonds, wherein I highlight ten "Diamonds in the Rough" per week. These are selected from the results of my DecisionPoint Scans which search for stocks that could benefit from the trend and condition of the market. Remember, these are not recommendations to buy or sell, but are the most interesting of the stocks that surfaced in my scans. My objective is to save you the work of the initial, tedious culling process, but you need to apply your own analysis to see if these stocks pique your interest as well. There are no guaranteed winners here!
"Predefined Scans Triggered" are taken from StockCharts.com using the "Symbol Summary" option instead of a "SharpChart" on the workbench.
Stop levels are all rounded down.
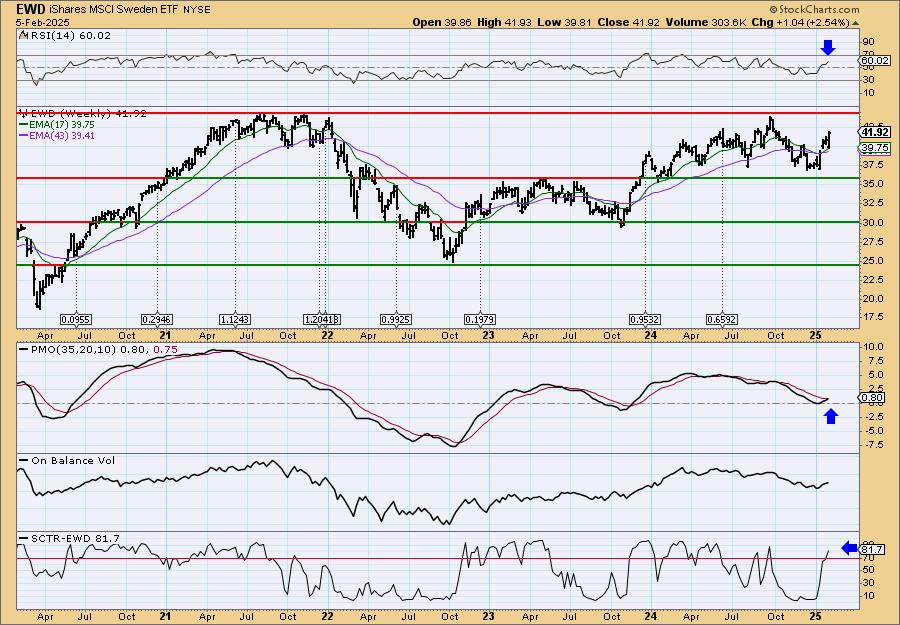
iShares MSCI Sweden ETF (EWD)
EARNINGS: N/A
EWD tracks a market-cap-weighted index of Swedish stocks. It captures the top 85% of companies by market-cap. Click HERE for more information.
Predefined Scans Triggered: None.
EWD is down -0.36% in after hours trading. This is a very bullish chart. We have a confirmed bullish double bottom pattern with a minimum upside target that would mean a breakout above the September top. The RSI is getting overbought unfortunately so we could see a pause first. The PMO is rising very strongly well above the zero line. Stochastics are above 80 indicating internal strength. The ETF has been outperforming the SPY for some time. The stop is set beneath the 200-day EMA at 6.4% or $39.23.
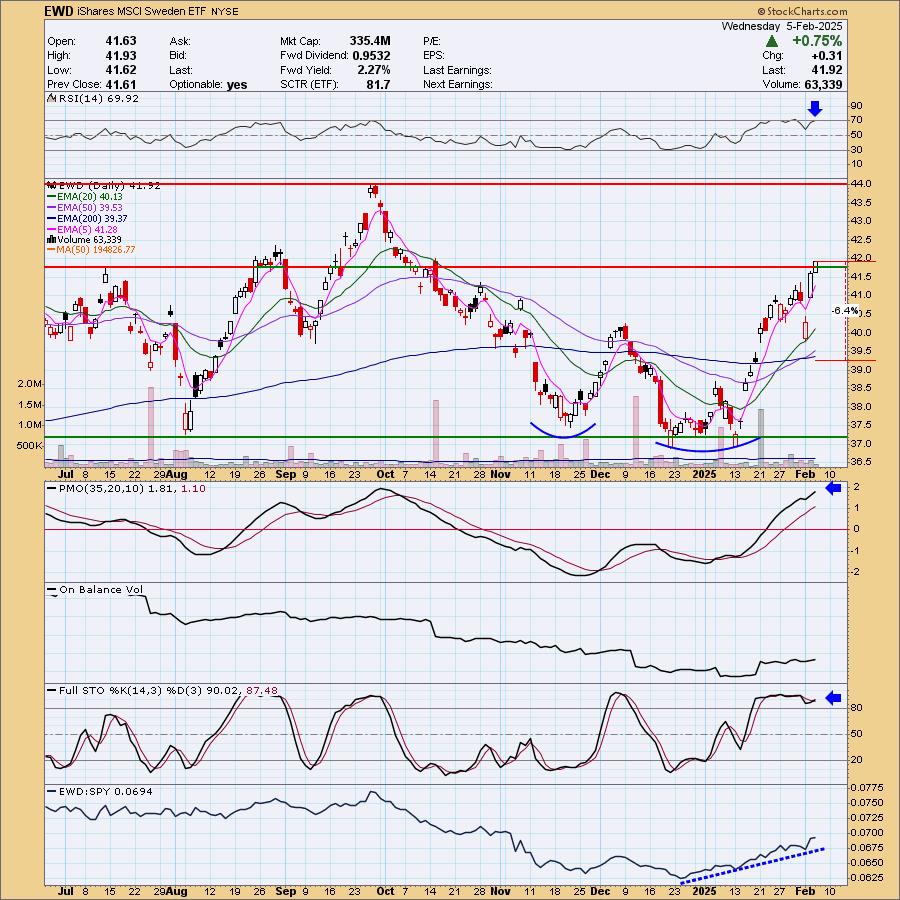
The weekly chart shows price essentially in a sideways trading range. This rally is coming off strong support. The weekly RSI is positive and not overbought. The weekly PMO is on a brand new Crossover BUY Signal. The StockCharts Technical Rank (SCTR) is well within the hot zone* above 70. Consider a 17% upside target to about $49.05.
*If a stock is in the "hot zone" above 70, it implies that it is stronger than 70% of its universe (large-, mid-, small-caps and ETFs) primarily in the intermediate to long terms.
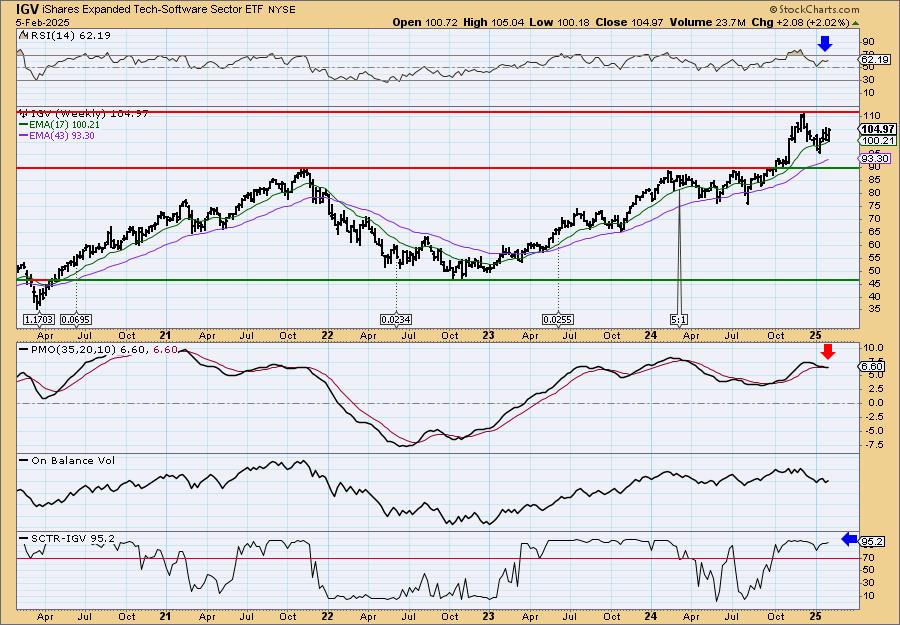
iShares Expanded Tech-Software Sector ETF (IGV)
EARNINGS: N/A
IGV tracks a market-cap-weighted index of US and Canadian software companies. Click HERE for more information.
Predefined Scans Triggered: Moved Above Ichimoku Cloud.
IGV is down -0.01% in after hours trading. I like the bottoming formation of what looks very much like a reverse head and shoulders pattern. It hasn't been confirmed with a breakout yet, but I like its chances. The RSI is positive and not overbought at all. The PMO has surged above the signal line (bottomed above the signal line) and Stochastics have turned back up and are nearing 80. Relative strength is also headed in the right direction. I've set the stop well beneath near-term support at 7.1% or $97.51.
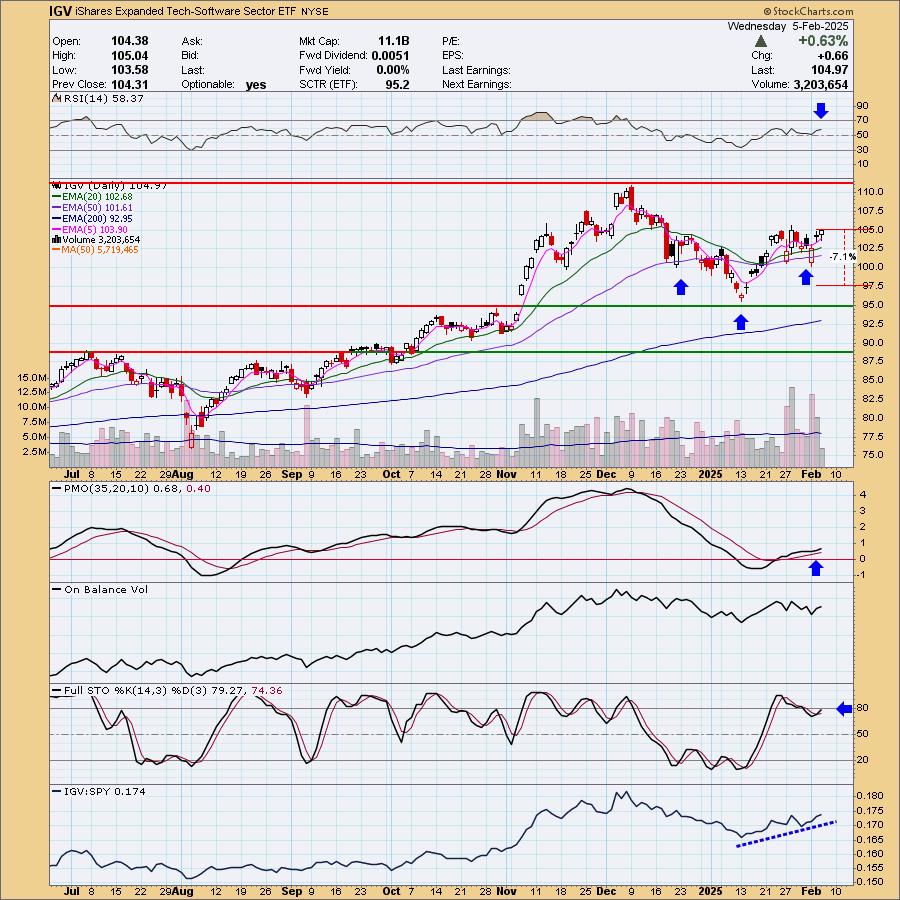
We have what could be a bull flag on the weekly chart. Mainly I like that price reversed before having to test support. The recent decline did damage the weekly PMO as it is in the process of a Crossover SELL Signal, but the weekly RSI is positive and the SCTR is at the top of the hot zone. Consider a 17% upside target to about $122.81.
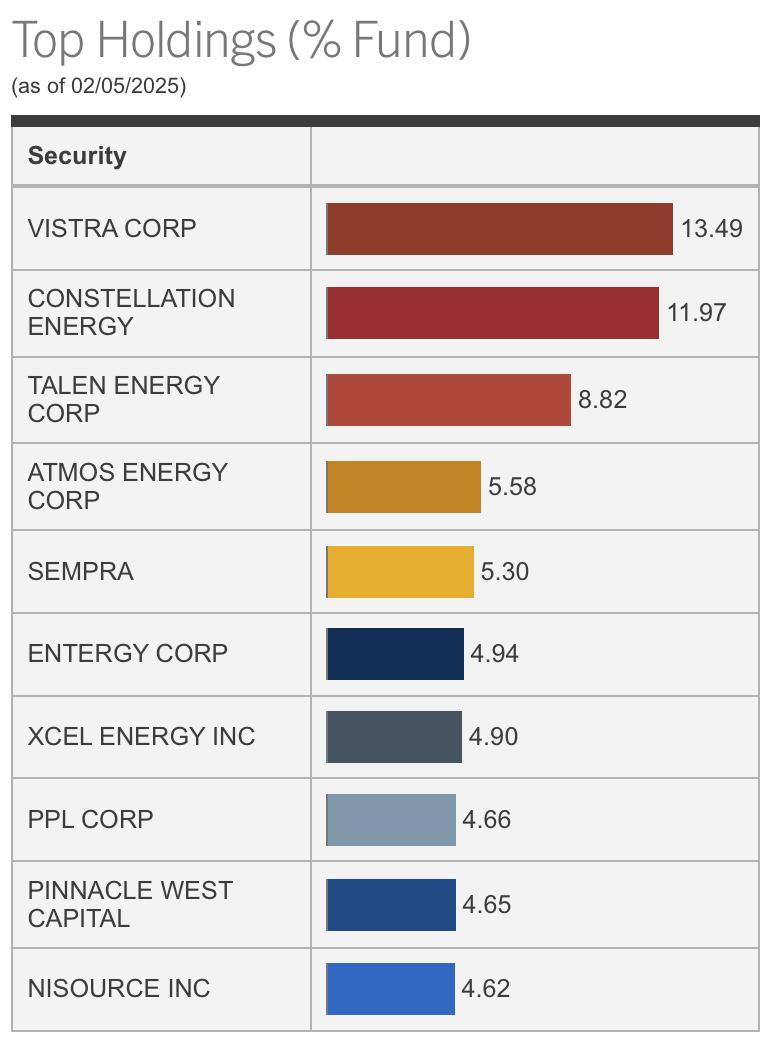
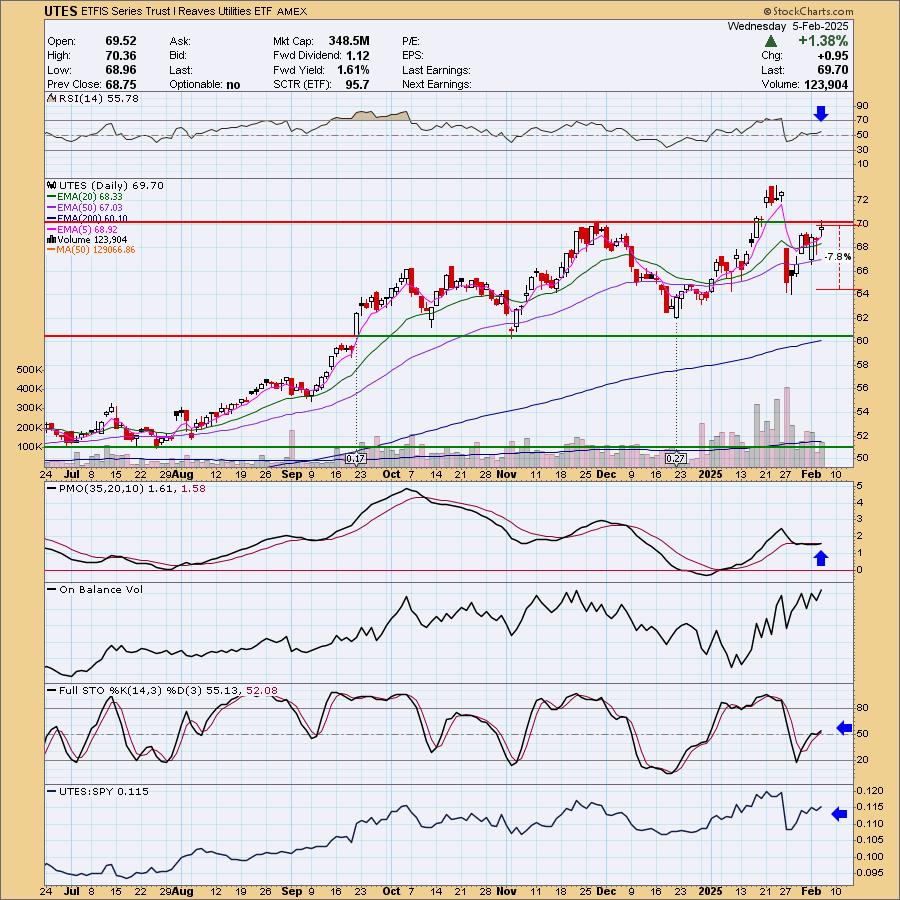
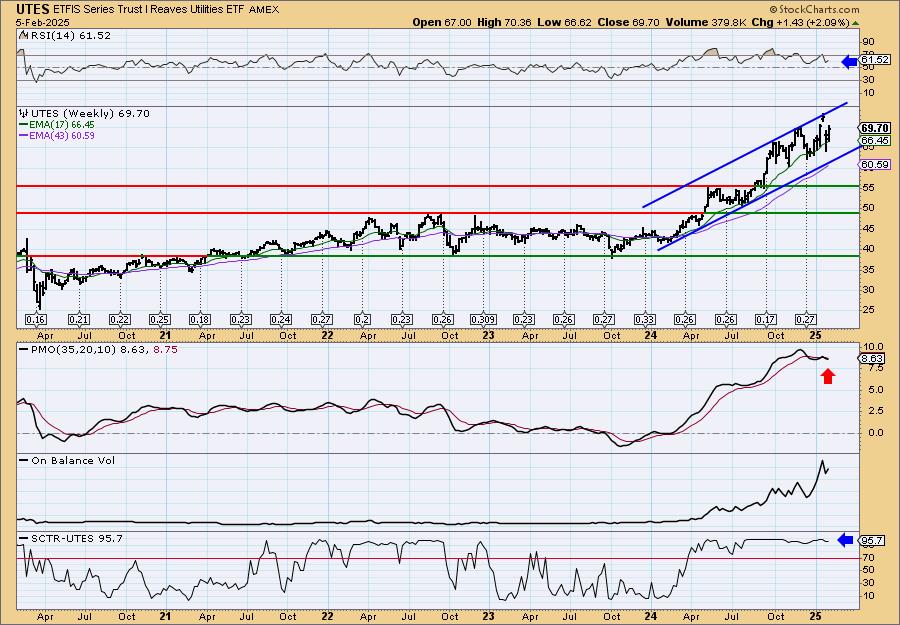
ETFIS Series Trust I Reaves Utilities ETF (UTES)
EARNINGS: N/A
UTES is an actively managed ETF that holds US utility stocks. UTES' managers aim to outperform the sector by selecting and weighting stocks based on fundamental, growth and risk metrics. Click HERE for more information.
Predefined Scans Triggered: None.
UTES is down -1.00% in after hours trading so it is taking back much of today's gain. Remember this is more of a hedge during market weakness. Price is in a nice rising trend that developed after an upside reversal that occurred well above support. The prior price shock did the PMO no favors, but it is now flattening out and gave us a Crossover BUY Signal today. I'd have liked to have seen a breakout above resistance at the November top. The RSI is positive and not at all overbought. Certainly we're seeing a confirmation of this rising trend based on the rising OBV. Stochastics are rising in positive territory and we see some outperformance coming in. I've set the stop as close to support as possible at 7.8% or $64.26.
I like the rising trend channel that developed after a breakout from a long-term trading range. The weekly RSI is positive. The weekly PMO did just give us a Crossover SELL Signal, but we have a good RSI and the SCTR is in the hot zone, at the top of the hot zone. Consider a 17% upside target to about $81.55.
Don't forget, on Thursdays I look at reader-requested symbols, click HERE to send me an email. I read every email I receive and try to answer them all!
Current Market Outlook:
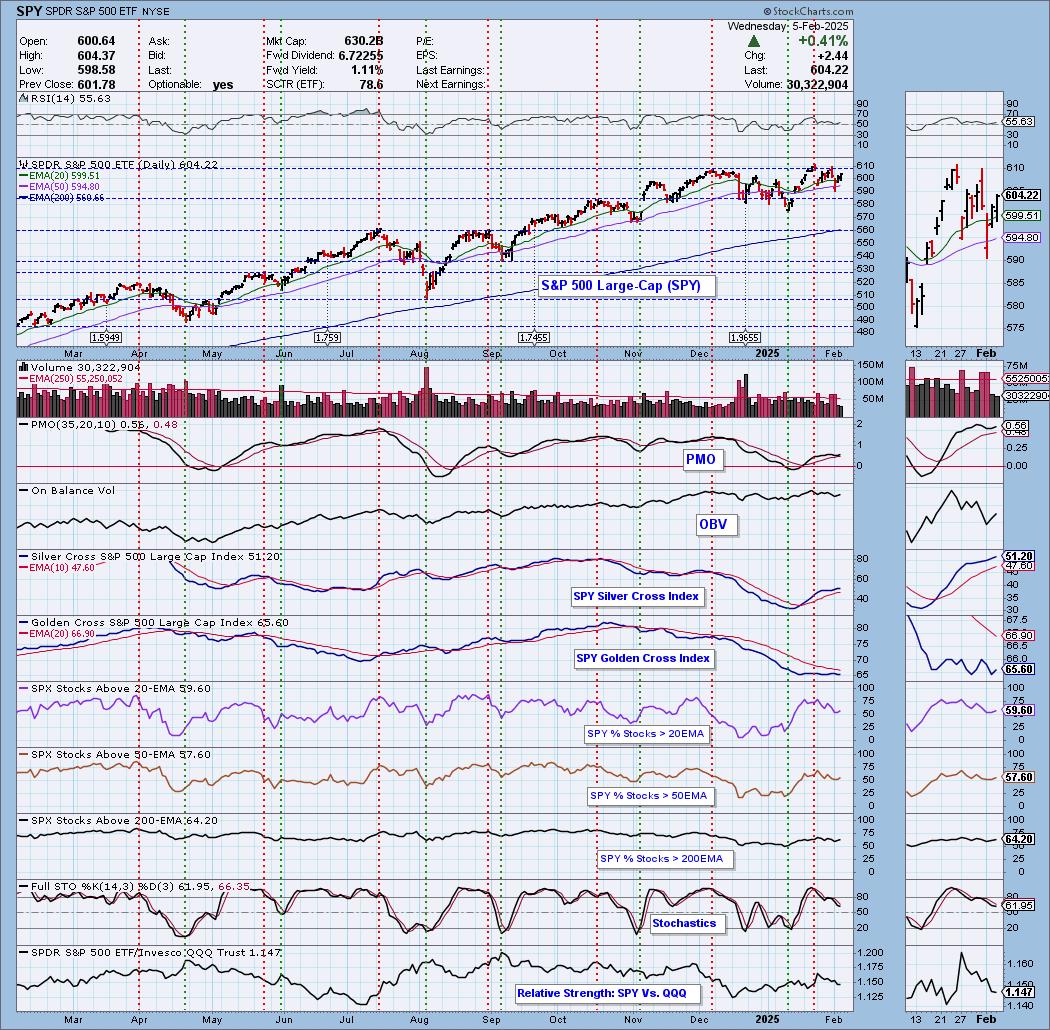
Market Environment: It is important to consider the odds for success by assessing the market tides. The following chart uses different methodologies for objectively showing the depth and trend of participation for intermediate- and long-term time frames.
- The Silver Cross Index (SCI) shows the percentage of SPX stocks on IT Trend Model BUY signals (20-EMA > 50-EMA)
- The Golden Cross Index (GCI) shows the percentage of SPX stocks on LT Trend Model BUY signals (50-EMA > 200-EMA)
Don't forget that as a "Diamonds" member, you have access to our "Under the Hood" curated ChartList on DecisionPoint.com. You'll find it under "Members Only" links on the left side on the Blogs and Links Page.
Here is the current chart:
Full Disclosure: I am 50% long, 0% short.
I'm required to disclose if I currently own a stock I mention and/or may buy/short it within the next 72 hours.
"Technical Analysis is a windsock, not a crystal ball." - Carl Swenlin
(c) Copyright 2025 DecisionPoint.com
Watch the latest episode of DecisionPoint Trading Room with Carl & Erin Swenlin Mondays on the DecisionPoint YouTube channel here!
NOTE: The stocks reported herein are from mechanical trading model scans that are based upon moving average relationships, momentum and volume. DecisionPoint analysis is then applied to get five selections from the scans. The selections given should prompt readers to do a chart review using their own analysis process. This letter is not a call for a specific action to buy, sell or short any of the stocks provided. There are NO sure things or guaranteed returns on the daily selection of "Diamonds in the Rough."
Regarding BUY/SELL Signals: The signal status reported herein is based upon mechanical trading model signals and crossovers. They define the implied bias of the price index/stock based upon moving average relationships and momentum, but they do not necessarily call for a specific action. They are information flags that should prompt chart review. Further, they do not call for continuous buying or selling during the life of the signal. For example, a BUY signal will probably (but not necessarily) return the best results if action is taken soon after the signal is generated. Additional opportunities for buying may be found as price zigzags higher, but the trader must look for optimum entry points. Conversely, exit points to preserve gains (or minimize losses) may be evident before the model mechanically closes the signal.
Helpful DecisionPoint Links:
Price Momentum Oscillator (PMO)
Swenlin Trading Oscillators (STO-B and STO-V)
For more links, go to DecisionPoint.com