
Lack of internet service prevented me from holding this morning's Diamond Mine trading room. We still do not have internet and don't think it will return by Monday's trading room so we will be canceling it. We are safe from the LA fires, but our area is under a fire watch with high winds returning this evening. We will keep you posted, but for now we are grateful that it is only our internet that is out.
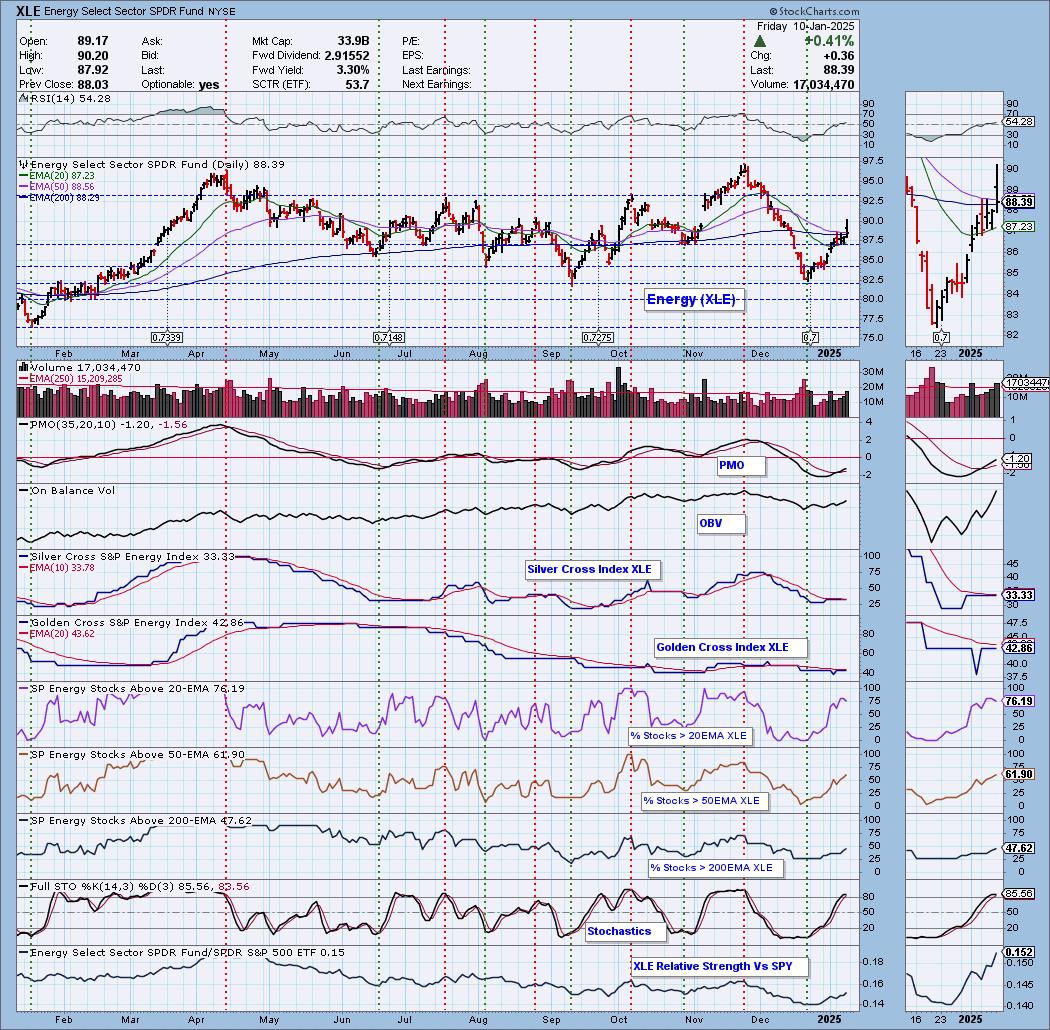
It wasn't too difficult to pick a Sector to Watch today. Energy (XLE) is by far the healthiest. I liked Healthcare but it lost a lot of participation on today's decline so I went with what is working right now.
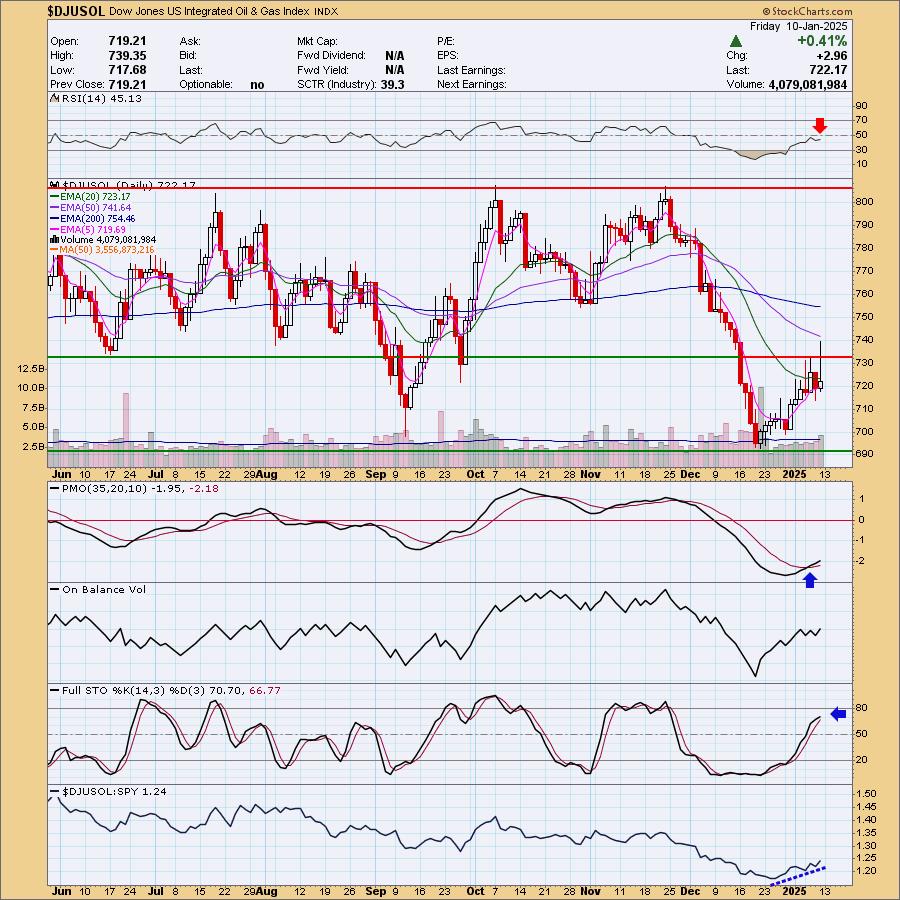
The Industry Group to Watch is Integrated Oil & Gas. I was able to find quite a few symbols of interest and I invite you to look at your favorites in this area as most are looking very bullish. Here are my symbols: NGL, SU, CVX, HES and MUR.
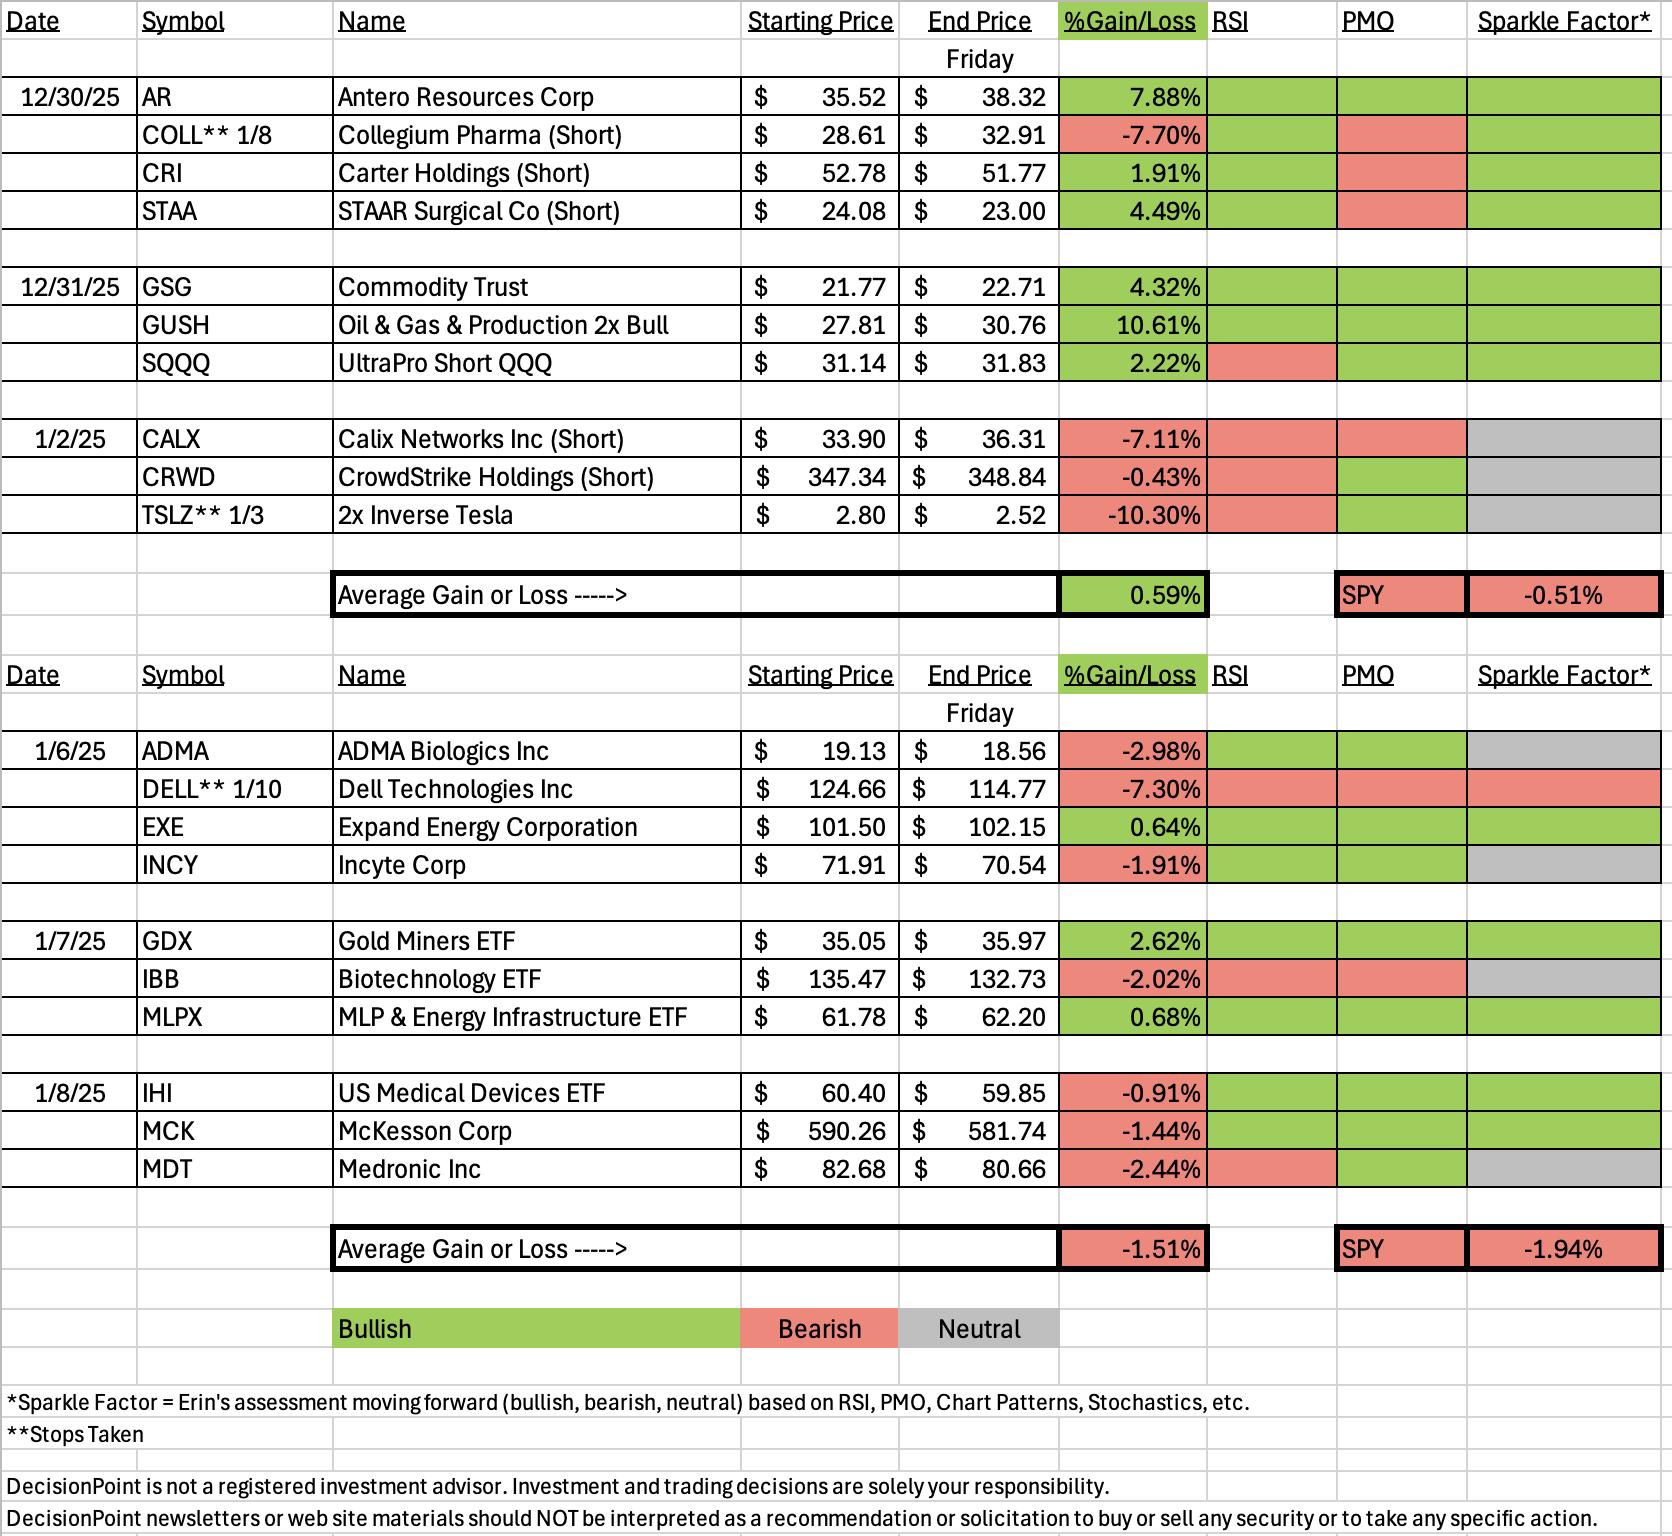
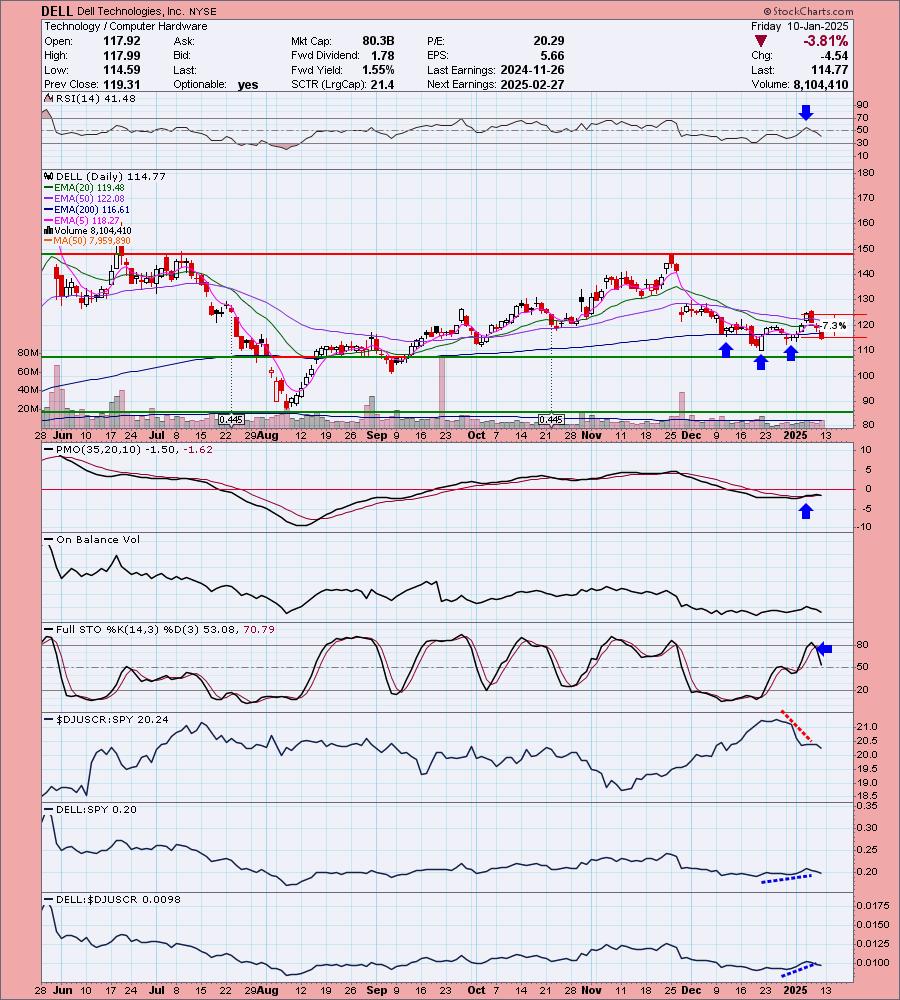
This week's Darling was the Gold Miners ETF (GDX) which was up +2.62% since being picked on Tuesday. This week's Dud was Dell Technologies (DELL) which had a deep decline today, triggering the stop. Technology took a hit today so it isn't completely surprising to see DELL in the red.
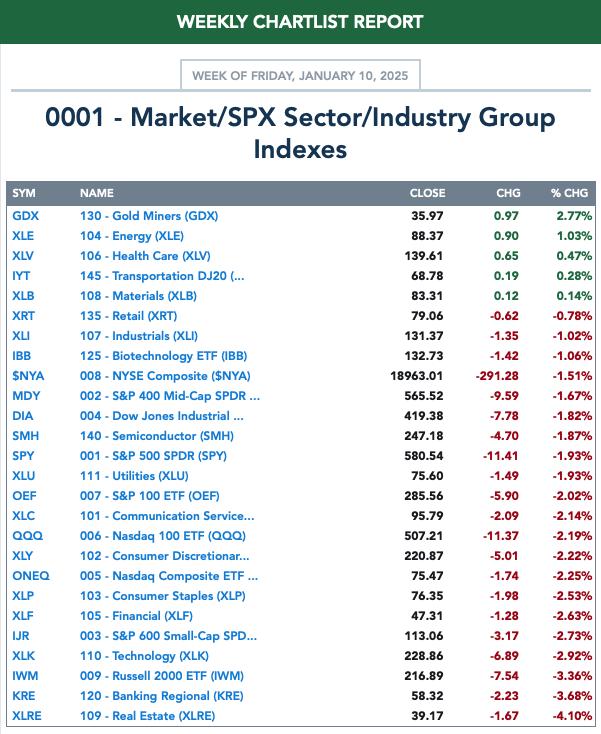
It wasn't a good week, but we did manage to outperform the SPY. We may be looking at shorts next week if the market continues to struggle or if economic reports disappoint as they did today.
Good Luck & Good Trading,
Erin

Diamond Mine Trading Room:
RECORDING & DOWNLOAD LINK (1/3/2025, no trading room on 1/10):
Topic: DecisionPoint Diamond Mine (1/3/2025) LIVE Trading Room
Recording & Download Link
Passcode: January#3
REGISTRATION for 1/17/2025:
When: January 17, 2025 09:00 AM Pacific Time (US and Canada)
Topic: DecisionPoint Diamond Mine LIVE Trading Room
Register in advance for this webinar HERE
After registering, you will receive a confirmation email containing information about joining the webinar.

Below is the latest free DecisionPoint Trading Room recording from 1/6. You'll find these recordings posted on Mondays to our DP YouTube Channel. Be sure and subscribe HERE.
A few items about the spreadsheet: I've put on the spreadsheet whether the RSI is positive (green) or negative (red). The PMO column tells you if it is rising (green) or falling (red). Finally I've added my own "Sparkle Factor" that gives you my assessment going forward, bullish (green), bearish (red) or neutral (gray). The Sparkle Factor is basically my thoughts on whether I expect it to rise or fall. A neutral means it could really go either way so it could be added to a watch list. If you're in a stock I consider "neutral" going forward, the ball is in your court.
Darling:
VanEck Vectors Gold Miners ETF (GDX)
EARNINGS: N/A
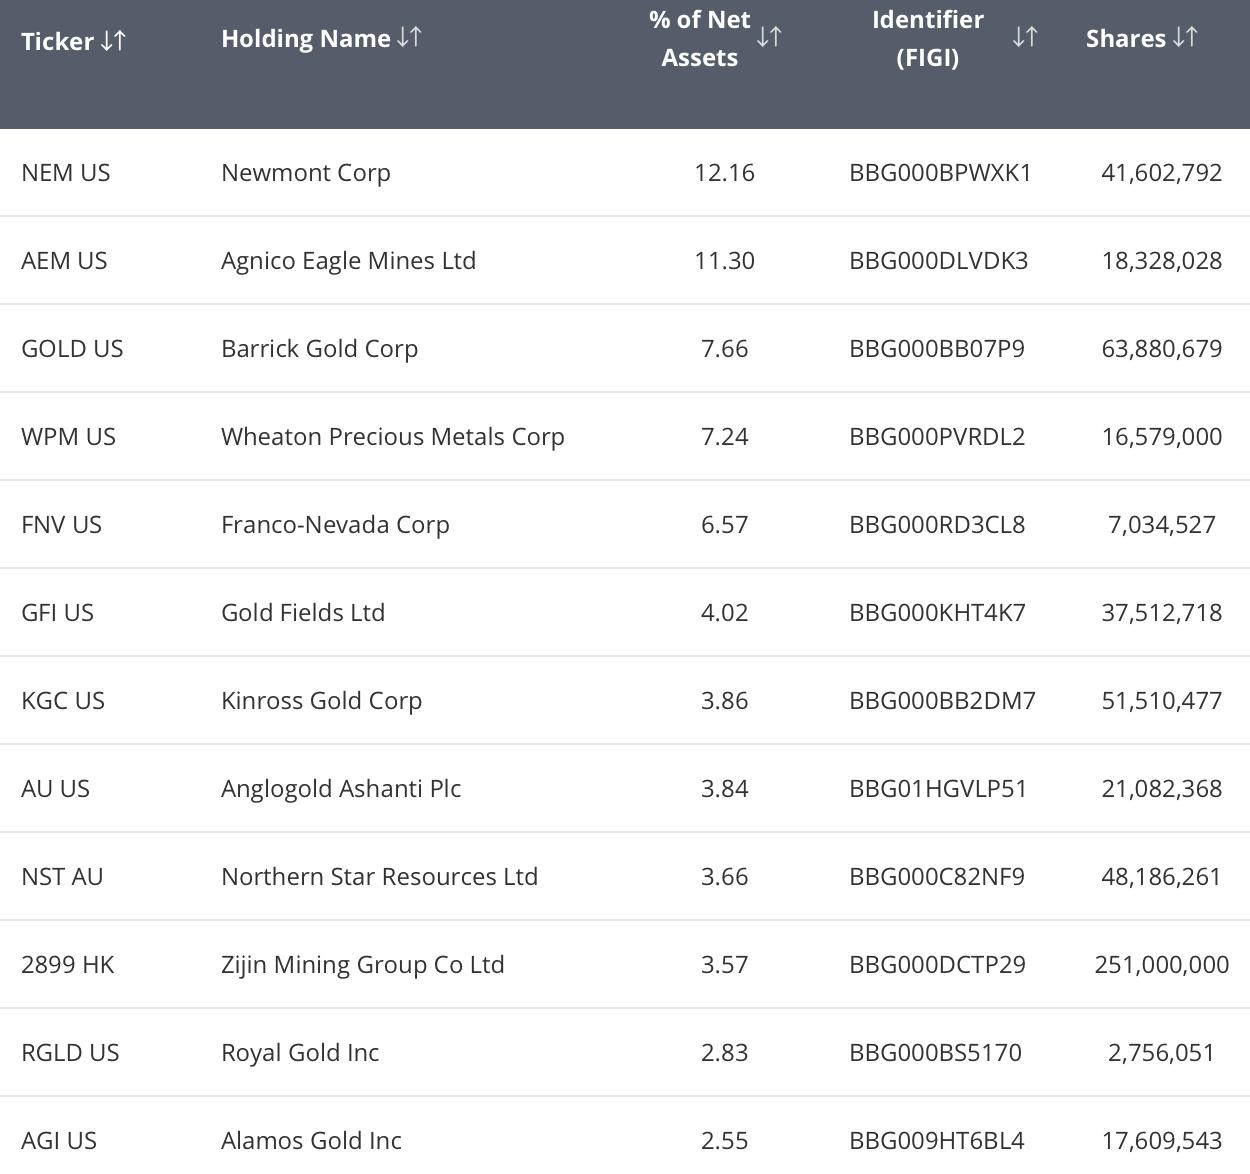
GDX tracks a market-cap-weighted index of global gold-mining firms. Click HERE for more information.
Predefined Scans Triggered: P&F Double Bottom Breakdown, Filled Black Candles, Elder Bar Turned Green and Parabolic SAR Buy Signals.
Below are the commentary and chart from Tuesday, 1/7:
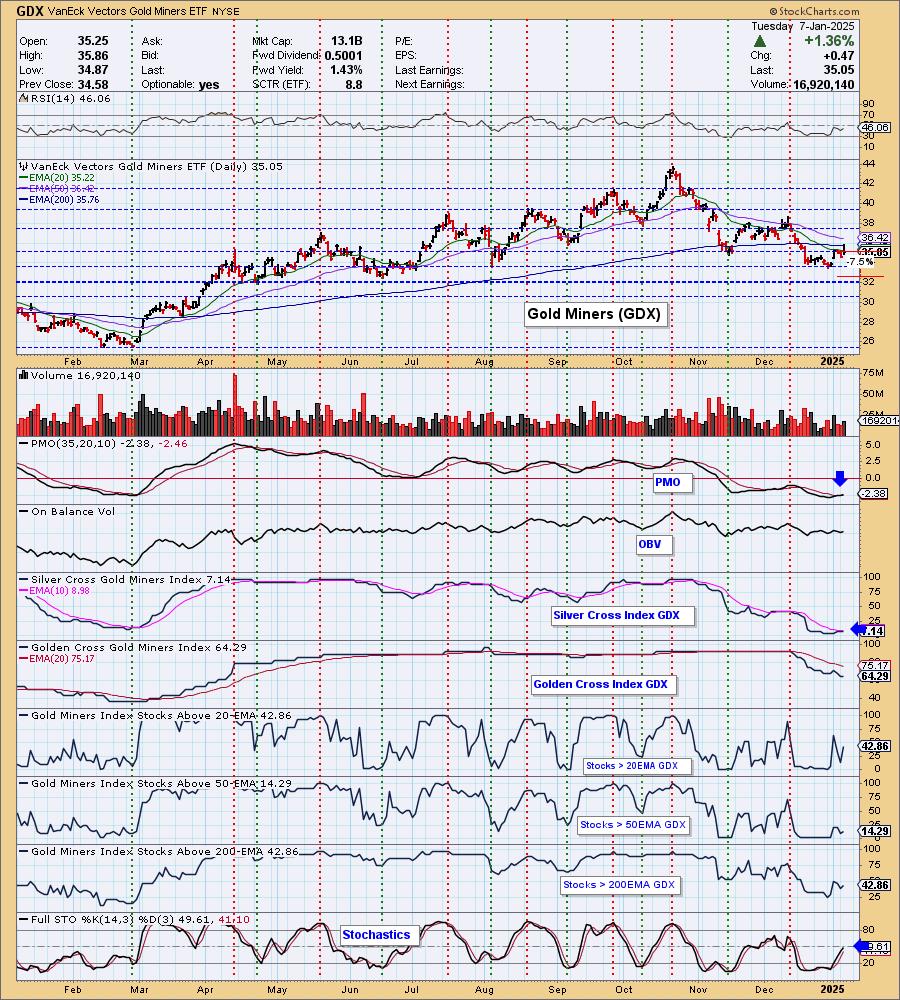
"GDX is down -0.18% in after hours trading. As I mentioned in the open, this chart has not fully matured as we still have a declining trend. Good news is that this recent reversal is occurring above strong support at 32. A reversal above support is bullish. The RSI is not yet positive, but the PMO is on a new Crossover BUY Signal. The Silver Cross Index is nearing a Bull Shift across the signal line. Participation is moving higher again. Stochastics are rising and have just made it into positive territory. The stop is set below near-term support at 7.5% or $32.42."
Here is today's chart:
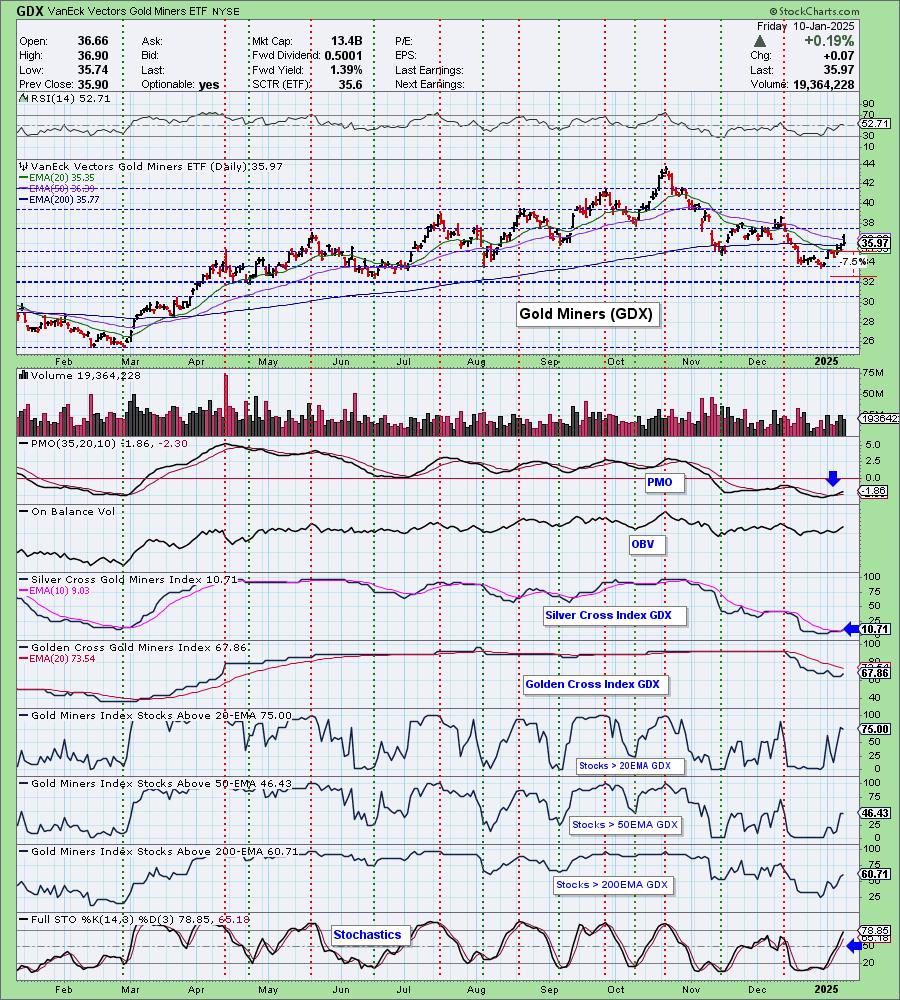
Participation was flat today, but overall it is expanding and we now a Bull Shift on the Silver Cross Index as it has overcome its signal line. The PMO continues to rise and we are cautiously bullish on Gold right now so we should see price continue to move higher. We had a breakout above the 50-day EMA today and price closed above the 200-day EMA. The declining trend is still intact, but it looks like we will get that breakout.
Don't forget, on Thursdays I look at reader-requested symbols, so shoot me an email at erin@decisionpoint.com. I read every email I receive and try to answer them all!
Dud:
Dell Technologies, Inc. (DELL)
EARNINGS: 2025-02-27 (AMC)
Dell Technologies, Inc. is a technology company, providing customers with a broad and innovative solution portfolio to help customers modernize their information technology (IT) infrastructure, address workforce transformation, and offer critical solutions that keep people and organizations connected. It operates through the following segments: Infrastructure Solutions Group (ISG) and Client Solutions Group (CSG). The ISG segment includes servers, networking, and storage, as well as services and third-party software and peripherals that are closely tied to the sale of ISG hardware. The CSG segment includes designs for commercial and consumer customers of desktops, thin client products, and notebooks. The company was founded by Michael Saul Dell in 1984 and is headquartered in Round Rock, TX.
Predefined Scans Triggered: Moved Above Upper Bollinger Band, New CCI Buy Signals, P&F Double Top Breakout and P&F Bearish Signal Reversal.
Below are the commentary and chart from Monday, 1/6:
"DELL is up +0.65% in after hours trading. We have a nice reversal off strong support that has shaped a small reverse head and shoulders pattern and has been confirmed with a move above the neckline. Price broke out above both the 20/50-day EMAs. The PMO is rising on a new PMO Crossover BUY Signal. Stochastics are rising strongly and should get above 80 soon which would signify internal strength. The industry group isn't doing that well, but Apple (AAPL), the leader within the group, is looking quite bullish right now and that should get the group to improve with it. DELL is already performing better within the group and against the SPY. The stop is set below the 200-day EMA at 7.3% or $115.55."
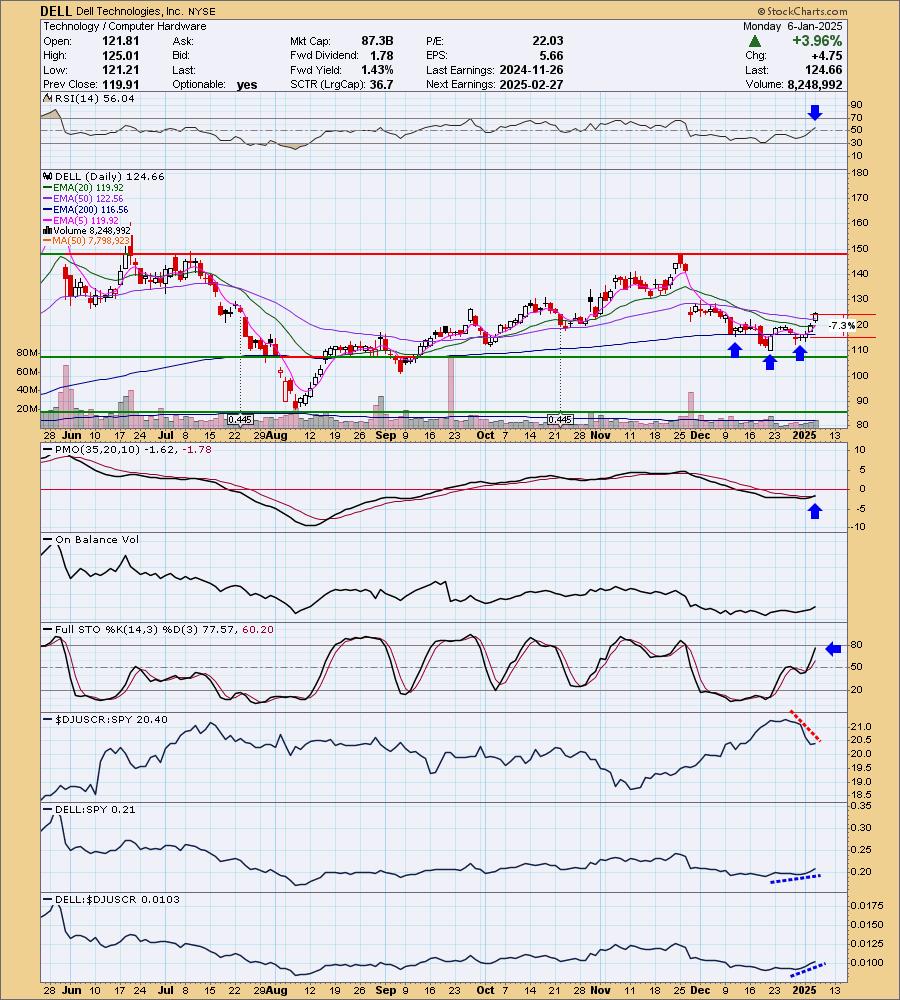
Here is today's chart:
The reverse head and shoulders busted and indicators turned south. This is likely due to the pullback in Technology as a whole. Today's decline triggered the stop. The RSI and PMO are negative now and Stochastics are falling fast so this is a "sell' right now. The industry group wasn't doing that well and this could have been a sign that this position might be undercut. The PMO was also below the zero line and that could have also contributed.
THIS WEEK's Performance:
DecisionPoint Market Scoreboard (Mechanical Trend Model Signals):
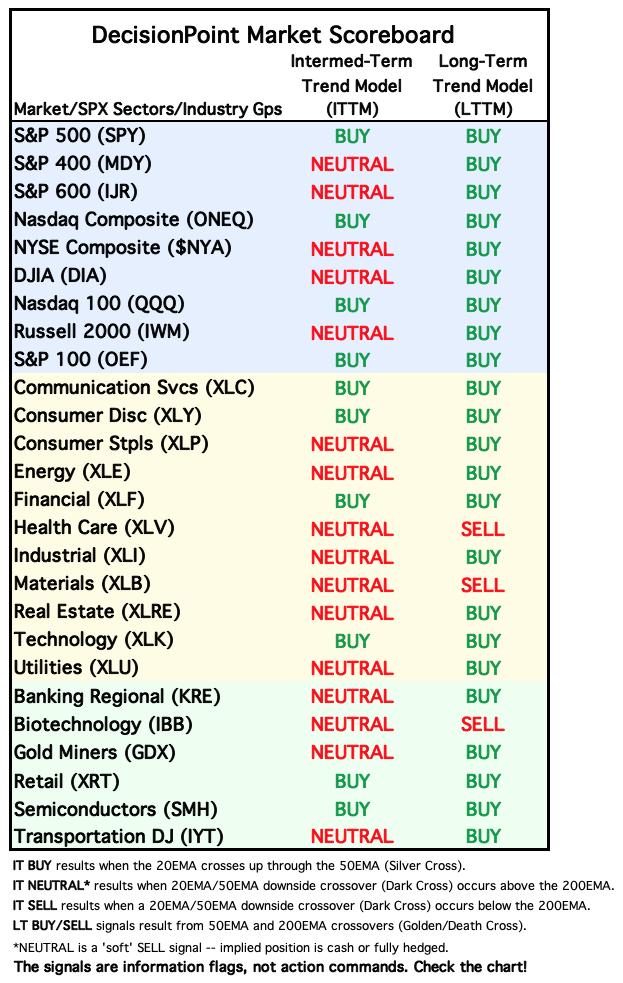
Friday signal changes are outlined in purple.
Click Here to view Carl's annotated "Under the Hood" ChartList!
Sector to Watch: Energy (XLE)
Crude Oil is looking good and that will put the wind at the back of the Energy sector which has already been enjoying a nice rally off support. The RSI is positive and we have a PMO Crossover BUY Signal. Participation is very strong and still has room for improvement. Stochastics are rising above 80 and we see rising relative strength. The Silver Cross Index is very close to a Bull Shift across its signal line.
Industry Group to Watch: Integrated Oil & Gas ($DJUSOL)
I like this bounce off the bottom of a trading range. It implies we will get a move back up to test the top of the range. The RSI is not positive yet, but the PMO is on a Crossover BUY Signal and Stochastics are rising nicely. This group is beginning to outperform the SPY. I will say that there are other industry groups within Energy that look bullish. I'd just stay away from Coal. The symbols I found in $DJUSOL are: NGL, SU, CVX, HES and MUR.
Go to our Under the Hood ChartList on DecisionPoint.com to get an in-depth view of all the sectors. On StockCharts.com you can find the Industry Summary.
Good Luck & Good Trading!
- Erin
erin@decisionpoint.com
Full Disclosure: I'm 30% long, 0% short.
Watch the latest episode of the DecisionPoint Trading Room with Carl & Erin Swenlin HERE!
Technical Analysis is a windsock, not a crystal ball. --Carl Swenlin
NOTE: The stocks reported herein are from mechanical trading model scans that are based upon moving average relationships, momentum and volume. DecisionPoint analysis is then applied to get selections from the scans. The selections given should prompt readers to do a chart review using their own analysis process. This letter is not a call for a specific action to buy, sell or short any of the stocks provided. There are NO sure things or guaranteed returns on the selection of "diamonds in the rough."
Helpful DecisionPoint Links:
DecisionPoint Shared ChartList and DecisionPoint Chart Gallery
Price Momentum Oscillator (PMO)
Swenlin Trading Oscillators (STO-B and STO-V)
(c) Copyright 2025 DecisionPoint.com