
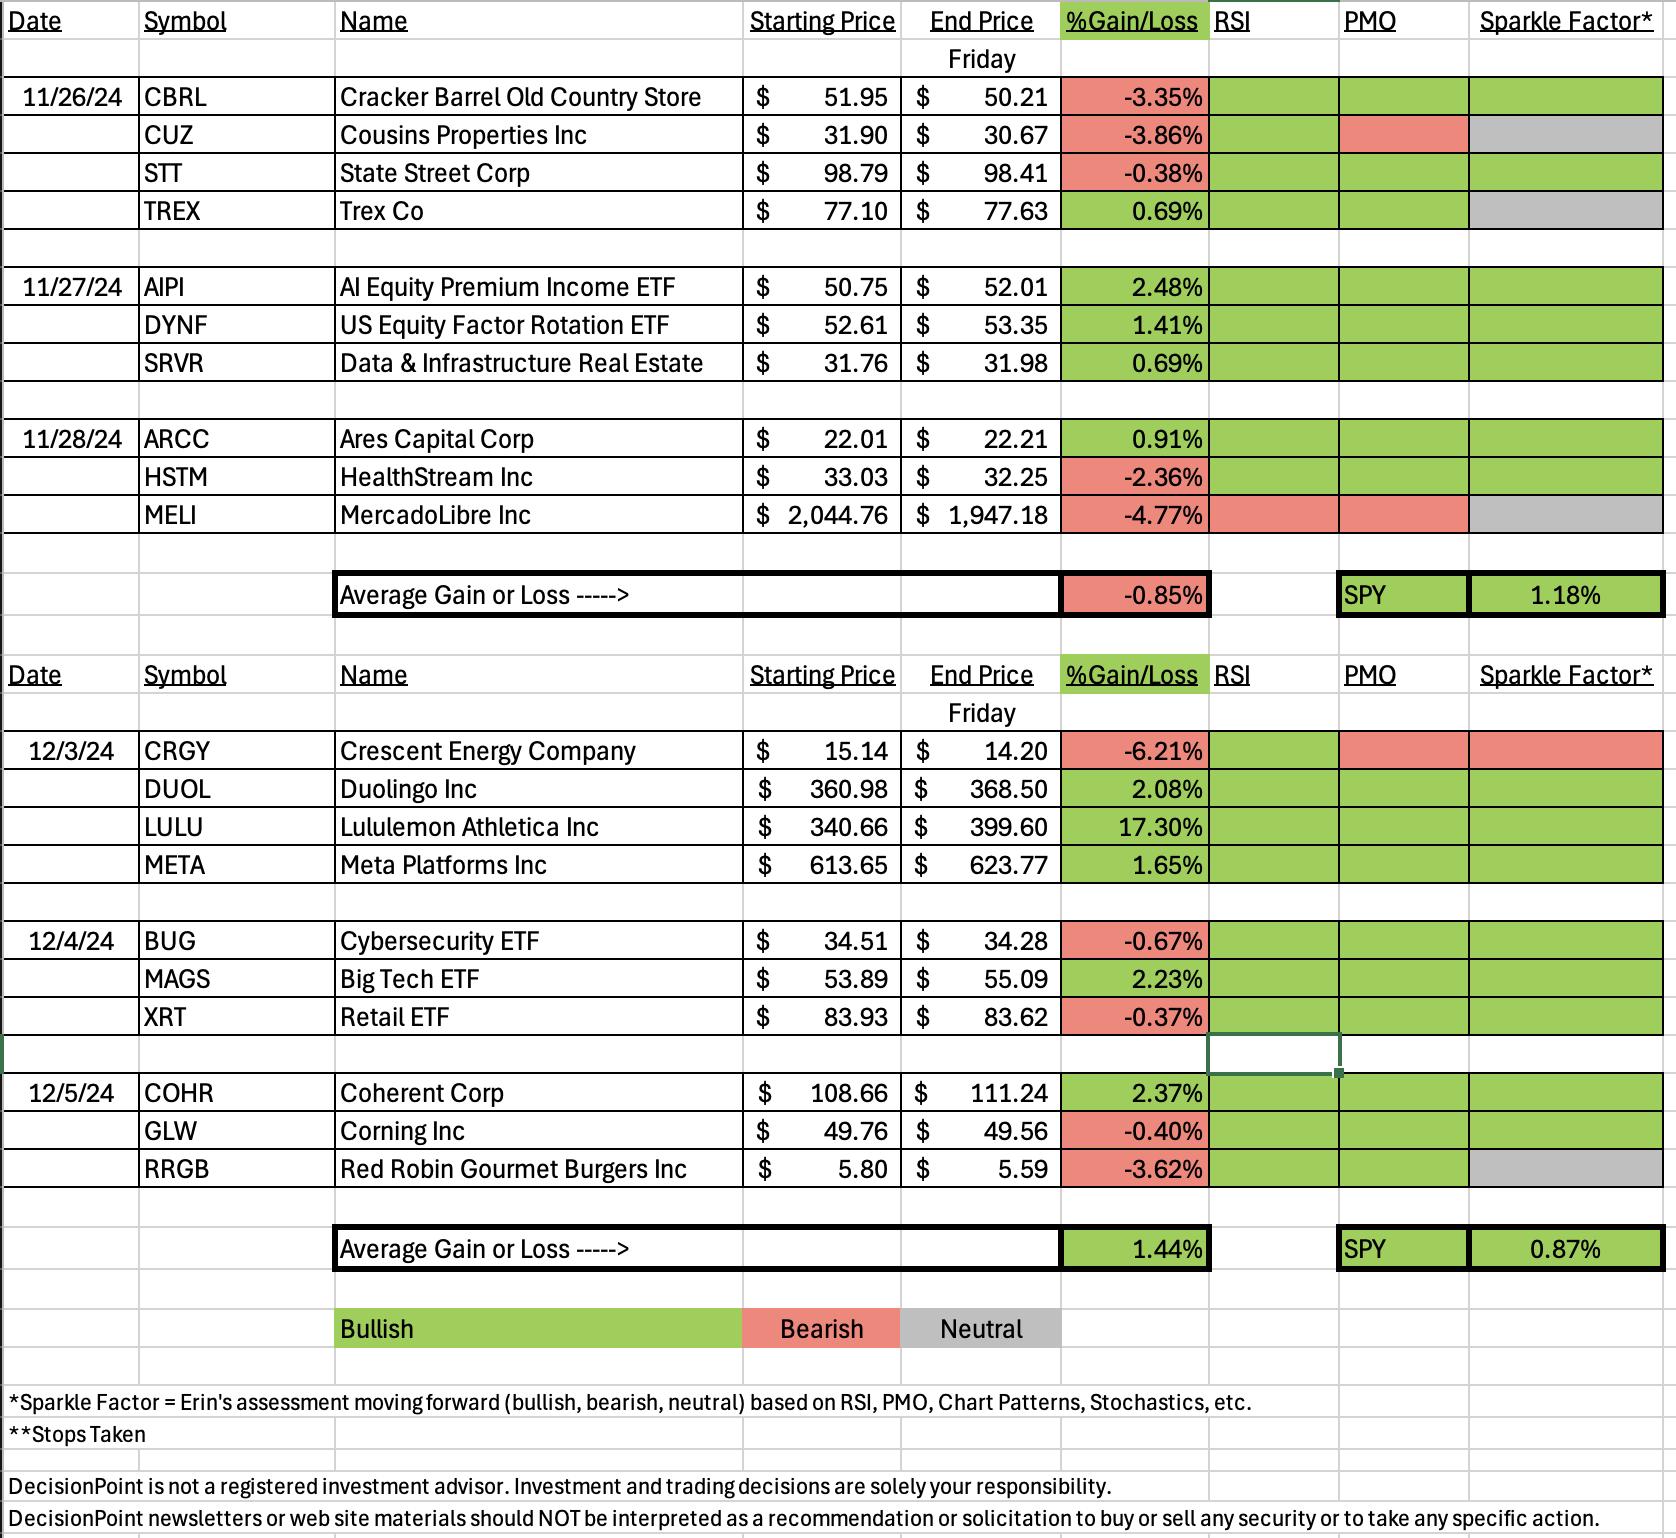
Overall it was a good week. We did have two losers that did take our average down, but ultimately half of them were up and three of those that were down, were down only a little bit. You'll notice on the Sparkle Factors that all but two are still bullish to me.
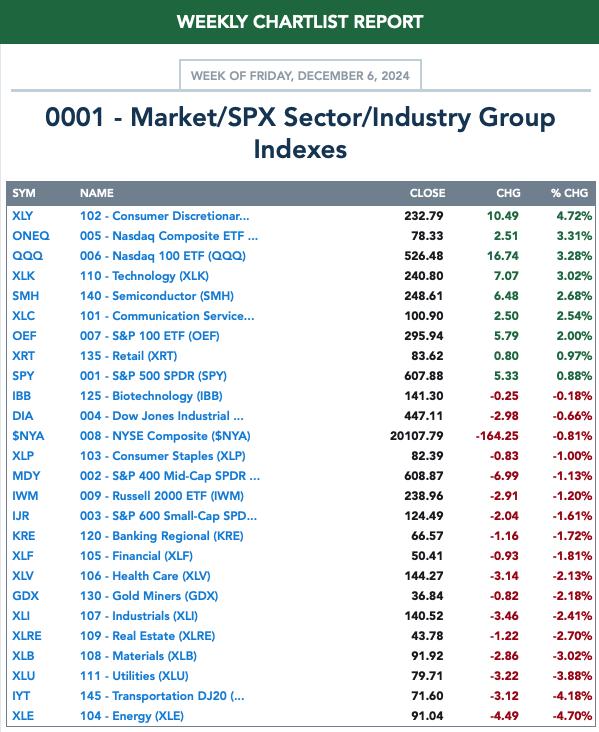
The "Dud" this week was Crescent Energy (CRGY). This turned out to be a poor pick due to the decline in Crude Oil and Energy as a whole. It does show you that it is important to be in a sector or industry group that is outperforming.
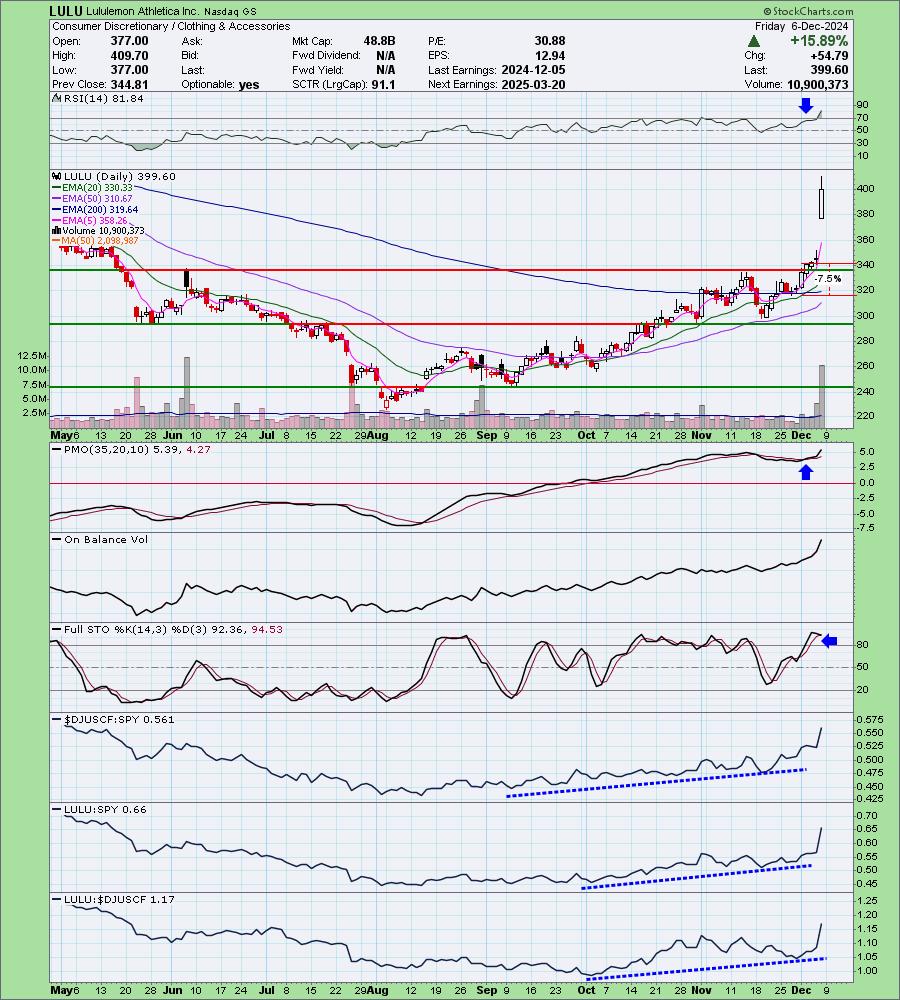
The "Darling" was Lululemon (LULU) which reported earnings and soared today. It was a great position since being picked, up over 17%! I do need a vacation though. I have told you I would be careful about presenting stocks nearing earnings. I missed this one. In this case it turned out okay, but we know that it is a crap shoot ultimately going into earnings.
The Sector to Watch this week is Technology (XLK). The trading room was in agreement this week as we are seeing new momentum coming through in the Nasdaq as well as the sector. If the market is going to continue to play nice, this sector should perform well.
The Industry Group to Watch was Electronic Equipment. There were four stocks in this area that I liked this morning: ZBRA, HEAR, BMI and SONO. I particularly liked SONO's chart.
I ran a few scans at the end of the Diamond Mine to find stocks that could be interesting going into next week. Those symbols are: CHTR, AVGO, TSLA, TROW and BR.
Have a great weekend! I'll see you in the trading room Monday at Noon ET! Register on the DP homepage if you haven't already. You only need to register once and you'll always be on the list.
Good Luck & Good Trading,
Erin

Diamond Mine Trading Room:
RECORDING & DOWNLOAD LINK (12/6/2024):
Topic: DecisionPoint Diamond Mine (12/6/2024) LIVE Trading Room
Recording & Download LINK
Passcode: December#6
REGISTRATION for 12/13/2024:
When: December 13, 2024 09:00 AM Pacific Time (US and Canada)
Topic: DecisionPoint Diamond Mine LIVE Trading Room
Register in advance for this webinar HERE
After registering, you will receive a confirmation email containing information about joining the webinar.

Below is the latest free DecisionPoint Trading Room recording from 12/2. You'll find these recordings posted on Mondays to our DP YouTube Channel. Be sure and subscribe HERE.
A few items about the spreadsheet: I've put on the spreadsheet whether the RSI is positive (green) or negative (red). The PMO column tells you if it is rising (green) or falling (red). Finally I've added my own "Sparkle Factor" that gives you my assessment going forward, bullish (green), bearish (red) or neutral (gray). The Sparkle Factor is basically my thoughts on whether I expect it to rise or fall. A neutral means it could really go either way so it could be added to a watch list. If you're in a stock I consider "neutral" going forward, the ball is in your court.
Darling:
Lululemon Athletica Inc. (LULU)
EARNINGS: 2024-12-05 (AMC)
Lululemon athletica, Inc. engages in the business of designing, distributing, and retailing technical athletic apparel, footwear, and accessories. It operates through the following segments: Company-Operated Stores, Direct to Consumer, and Other. The company was founded by Dennis James Wilson in 1998 and is headquartered in Vancouver, Canada.
Predefined Scans Triggered: Moved Above Upper Price Channel, P&F Ascending Triple Top Breakout, P&F Double Top Breakout and Moved Above Upper Keltner Channel.
Below are the commentary and chart from Tuesday, 12/3:
"LULU is down -0.03% in after hours trading. Today's breakout was the primary reason I picked this one. It is rising out of a bullish rounded bottom basing pattern. The RSI is positive and not overbought. The PMO has just triggered a Crossover BUY Signal. Stochastics are rising above 80. The group is performing very well and I'm a fan of Retail right now. LULU has been quietly outperforming the SPY since September. It of late has been seeing some underperformance against the group but in the longer-term timeframe it is still seeing a rising trend. The stop is set below the 200-day EMA at 7.5% or $315.11."
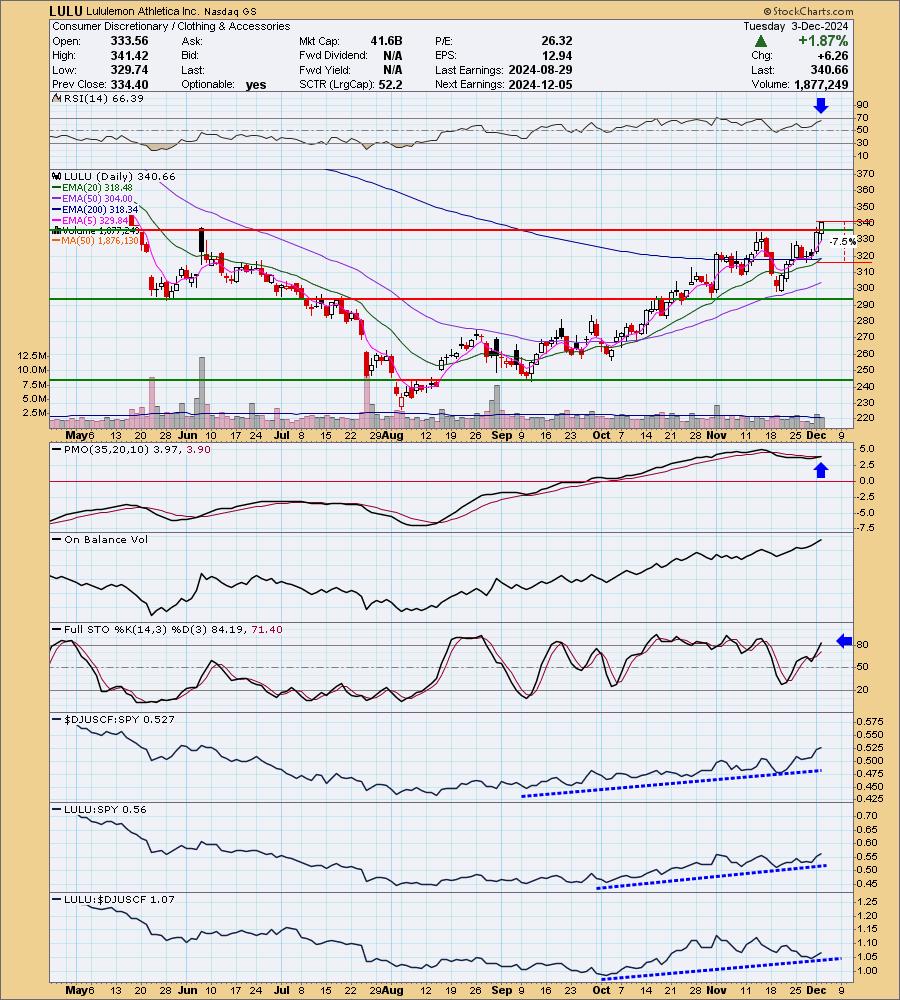
Here is today's chart:
Here we have an excellent basing pattern and follow through breakout that made this one so attractive to begin with. The RSI has gotten overbought so if you want to get in, it may be worth watching for a pullback or at least some consolidation. It could certainly continue to shoot up from here but generally you see some profit taking after a move like this one.
Don't forget, on Thursdays I look at reader-requested symbols, so shoot me an email at erin@decisionpoint.com. I read every email I receive and try to answer them all!
Dud:
Crescent Energy Company (CRGY)
EARNINGS: 2025-03-03 (AMC)
Crescent is a differentiated U.S. energy company committed to delivering value through a disciplined, returns-driven growth through acquisition strategy and consistent return of capital. The company's long-life, balanced portfolio combines stable cash flows from low decline production with a deep, high-quality development inventory. Its activities are focused in Texas and the Rocky Mountain region. Crescent Energy is headquartered in Houston, TX.
Predefined Scans Triggered: P&F Double Top Breakout.
Below are the commentary and chart from Tuesday, 12/3:
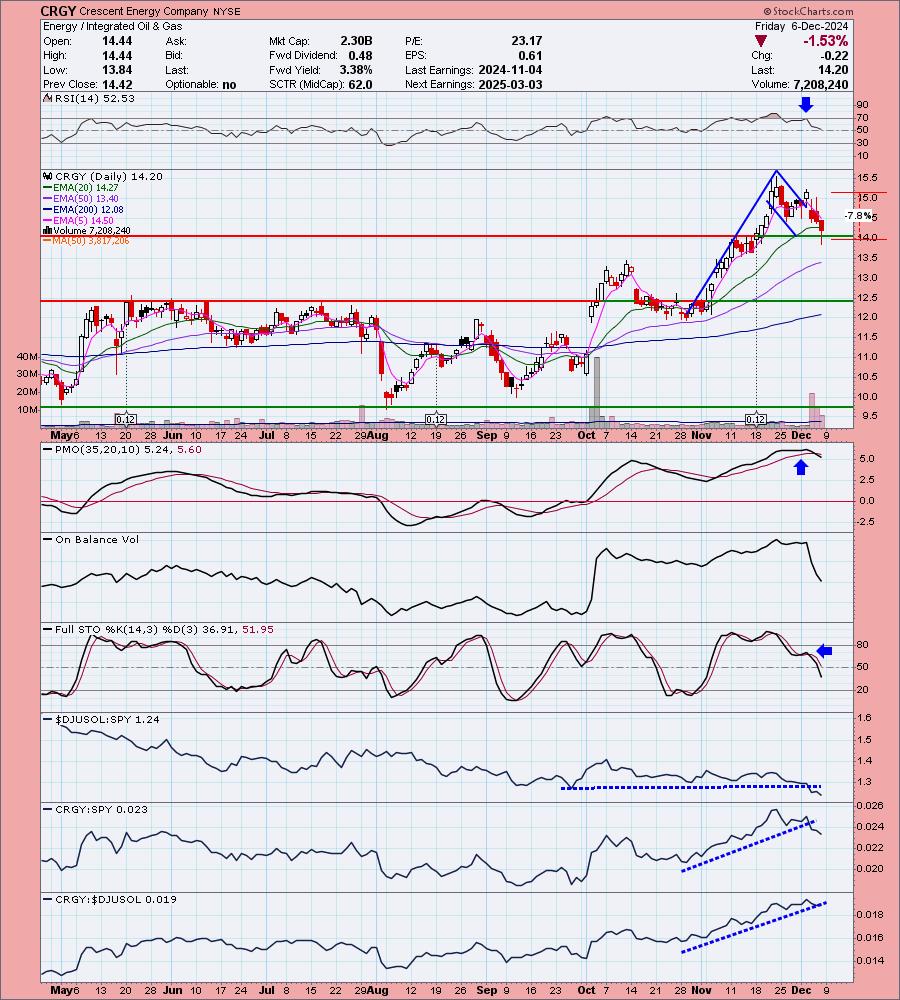
"CRGY is down -3.63% in after hours trading. We'll see if that decline holds up tomorrow. I liked this chart primarily due to the bull flag that was confirmed on today's breakout. The PMO is at a very high reading well above the zero line. It had a surge or a bottom above the signal line. The RSI is not yet overbought. Stochastics have turned up in positive territory. The group isn't outperforming right now, but it is in line with the SPY and that is acceptable. CRGY has shown leadership within the group and is outperforming the SPY. I've set the stop beneath support at 7.8% or $13.95."
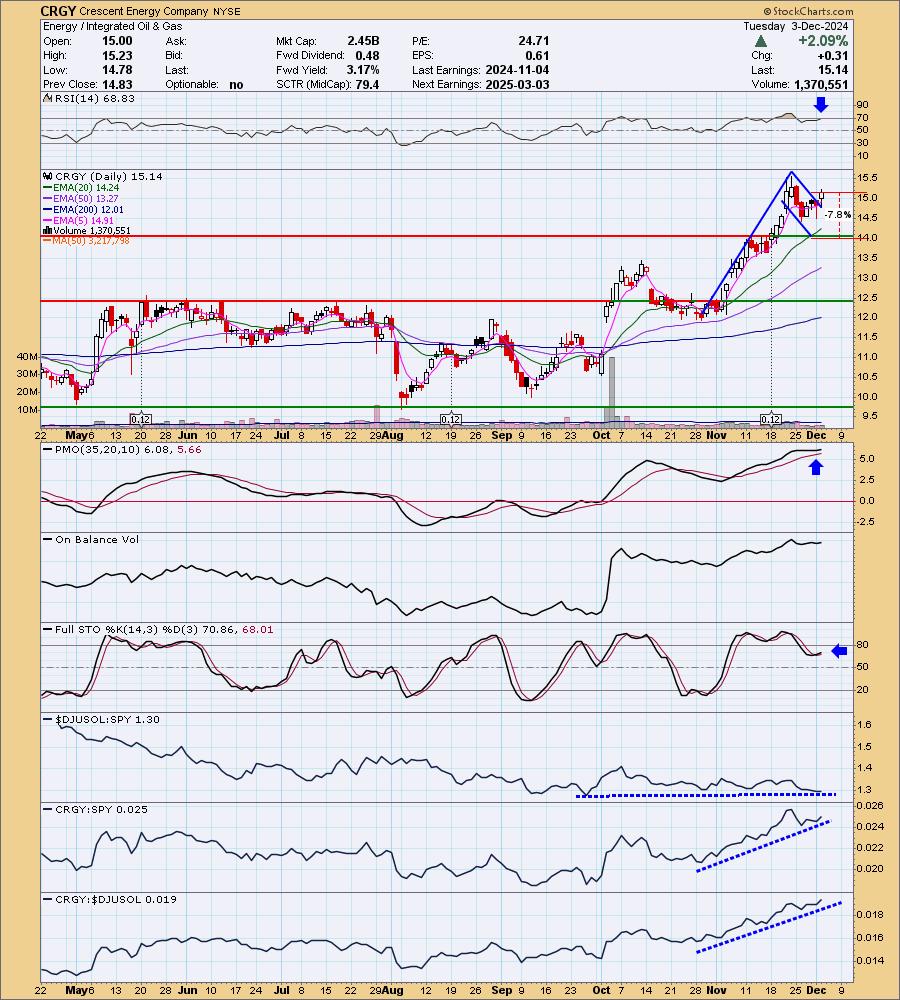
Here is today's chart:
The flag could be building here. I did give this one a bearish Sparkle Factor moving forward as I don't think it will hold support here given the PMO Crossover SELL Signal. The chart basically went south after being picked. I will chalk it up to being in a poorly performing industry group. It was beginning to sink a bit near-term. It's currently sinking further. I should've avoided an Energy pick given the bearish chart of XLE.
THIS WEEK's Performance:
DecisionPoint Market Scoreboard (Mechanical Trend Model Signals):
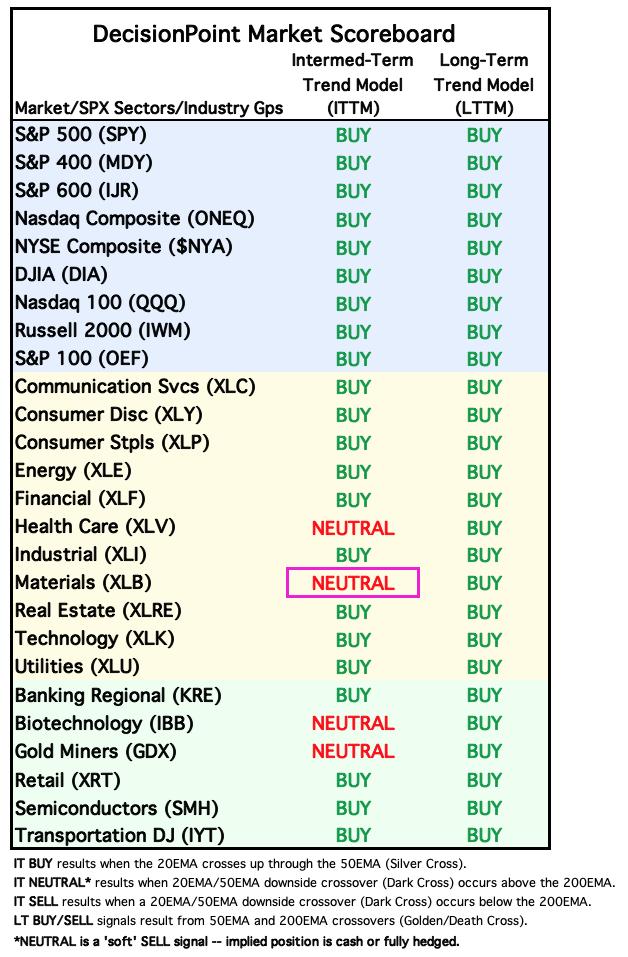
Friday signal changes are outlined in purple.
Click Here to view Carl's annotated "Under the Hood" ChartList!
Sector to Watch: Technology (XLK)
I very much like the recent breakout to new all-time highs. The rising trend is intact and it is on a relatively new PMO Crossover BUY Signal. The RSI is positive and not overbought. Participation did shrink a bit today which is a bit worrisome, but I'm seeing this within the SPY and it hasn't prevented it from moving higher. Mega-caps are the reason and that could hold true for XLK as well. The Silver Cross Index is holding above its signal line so the IT Bias is BULLISH. In general participation of stocks above key moving averages are in rising trends. Stochastics are above 80 and relative strength is improving.

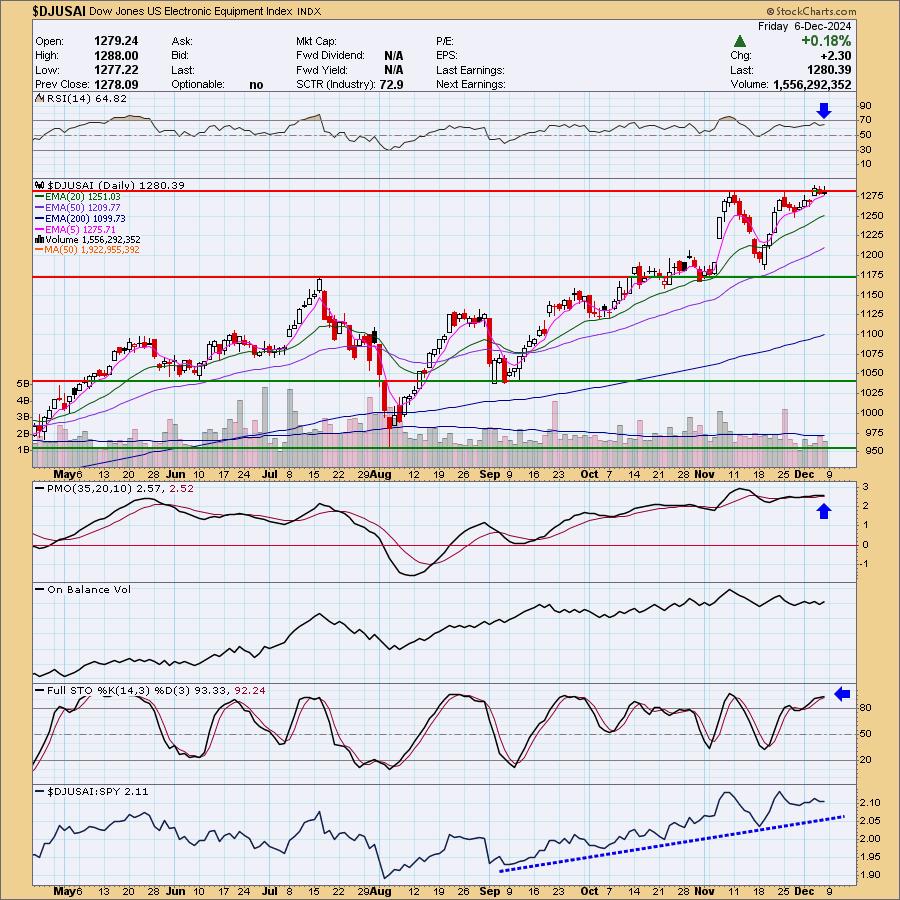
Industry Group to Watch: Electronic Equipment ($DJUSAI)
We have a tiny breakout occurring. So far overhead resistance is still somewhat sturdy. The RSI is in positive territory and not overbought. One of the problems we had this morning was that many of the industry groups within Technology are overbought, this one was not. We can see that the PMO is on a Crossover BUY Signal well above the zero line. It has been flat since the rebound started and that does imply pure strength. Stochastics are well above 80. Relative strength has been flat near-term, but over time it has been outperforming. I'm looking for the breakout to happen with some followthrough. The symbols I found interesting in this area were: ZBRA, HEAR, BMI and SONO.
Go to our Under the Hood ChartList on DecisionPoint.com to get an in-depth view of all the sectors. On StockCharts.com you can find the Industry Summary.
Good Luck & Good Trading!
- Erin
erin@decisionpoint.com
Full Disclosure: I'm 60% long, 0% short.
Watch the latest episode of the DecisionPoint Trading Room with Carl & Erin Swenlin HERE!
Technical Analysis is a windsock, not a crystal ball. --Carl Swenlin
NOTE: The stocks reported herein are from mechanical trading model scans that are based upon moving average relationships, momentum and volume. DecisionPoint analysis is then applied to get selections from the scans. The selections given should prompt readers to do a chart review using their own analysis process. This letter is not a call for a specific action to buy, sell or short any of the stocks provided. There are NO sure things or guaranteed returns on the selection of "diamonds in the rough."
Helpful DecisionPoint Links:
DecisionPoint Shared ChartList and DecisionPoint Chart Gallery
Price Momentum Oscillator (PMO)
Swenlin Trading Oscillators (STO-B and STO-V)
(c) Copyright 2024 DecisionPoint.com