
The SPY was hit hard on Wednesday and it changed the face of the market to negative. However, today we saw a healthy snapback that has all of wondering if the decline is already over. I'm not so sure about that and I think our best bet is to remain cautious and set our stops to preserve profit.
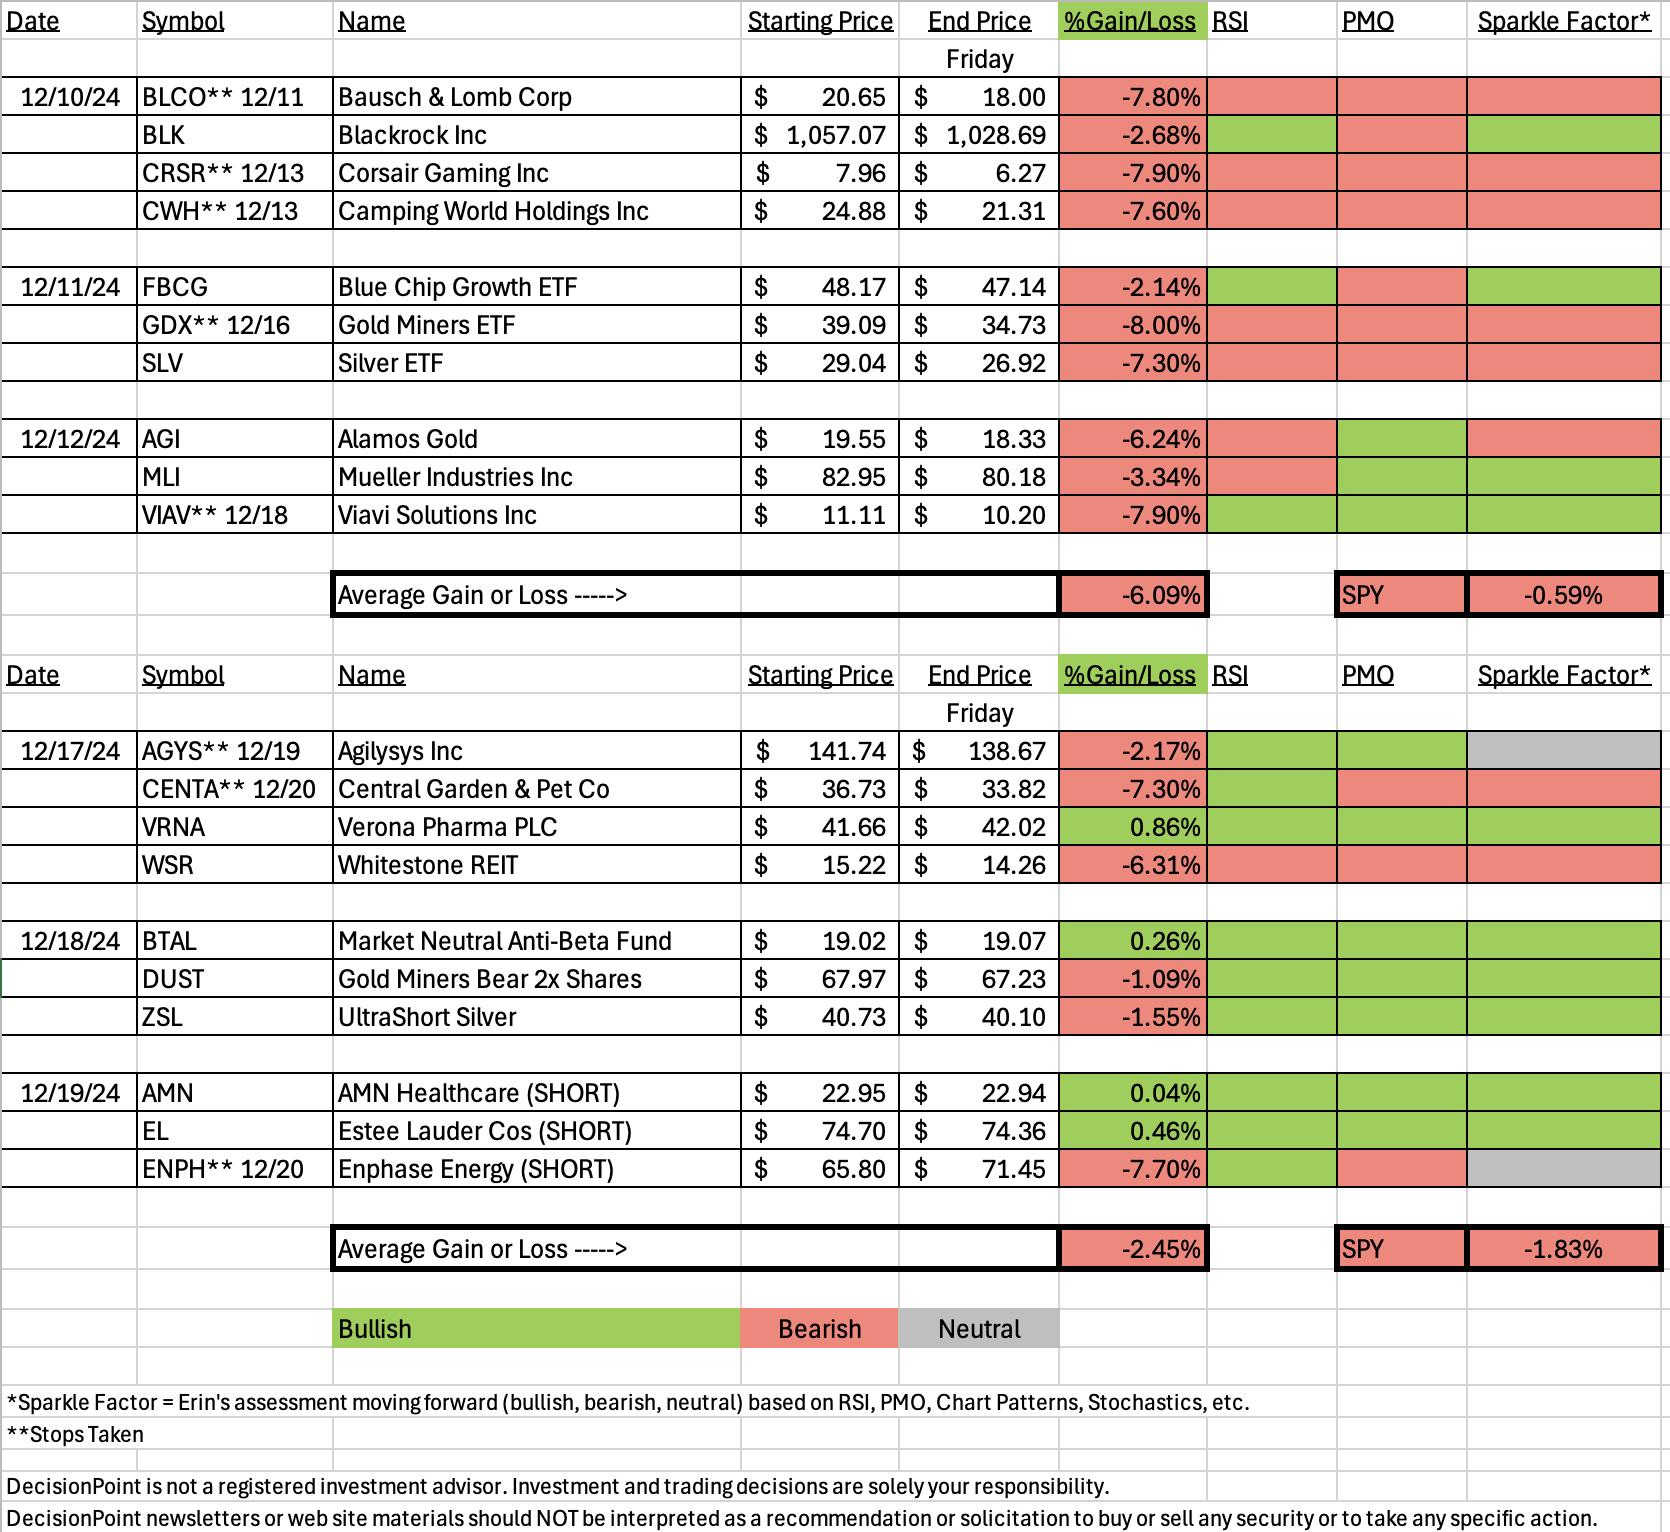
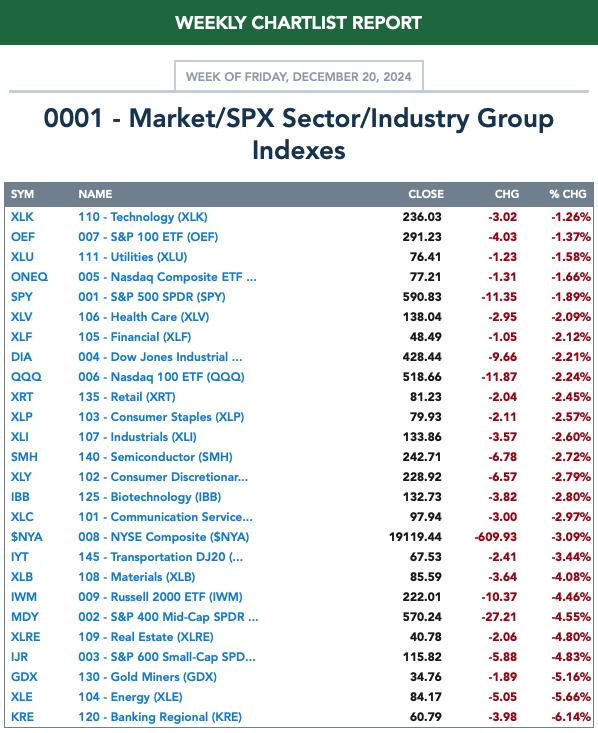
The SPY was down -1.83% this week but unfortunately "Diamonds in the Rough" were down -2.45%. It's a weird spreadsheet right now as last week I was bullish on Gold Miners and Silver and this week I shifted gears. I'm still bearish on this part of the market primarily because the Dollar isn't showing a great amount of weakness. We'll monitor the situation in the DP Alert.
There were three stops that hit this week so any of those could've been picked as the "Dud" for the week. The worst performer was Enphase (ENPH) on yesterday's short call. It had a spectacular rally that certainly raises eyebrows on the current chart.
The "Darling" this week was Verona Pharma (VRNA) which was up +0.86%. The chart looks constructive and can still be listed a buy.
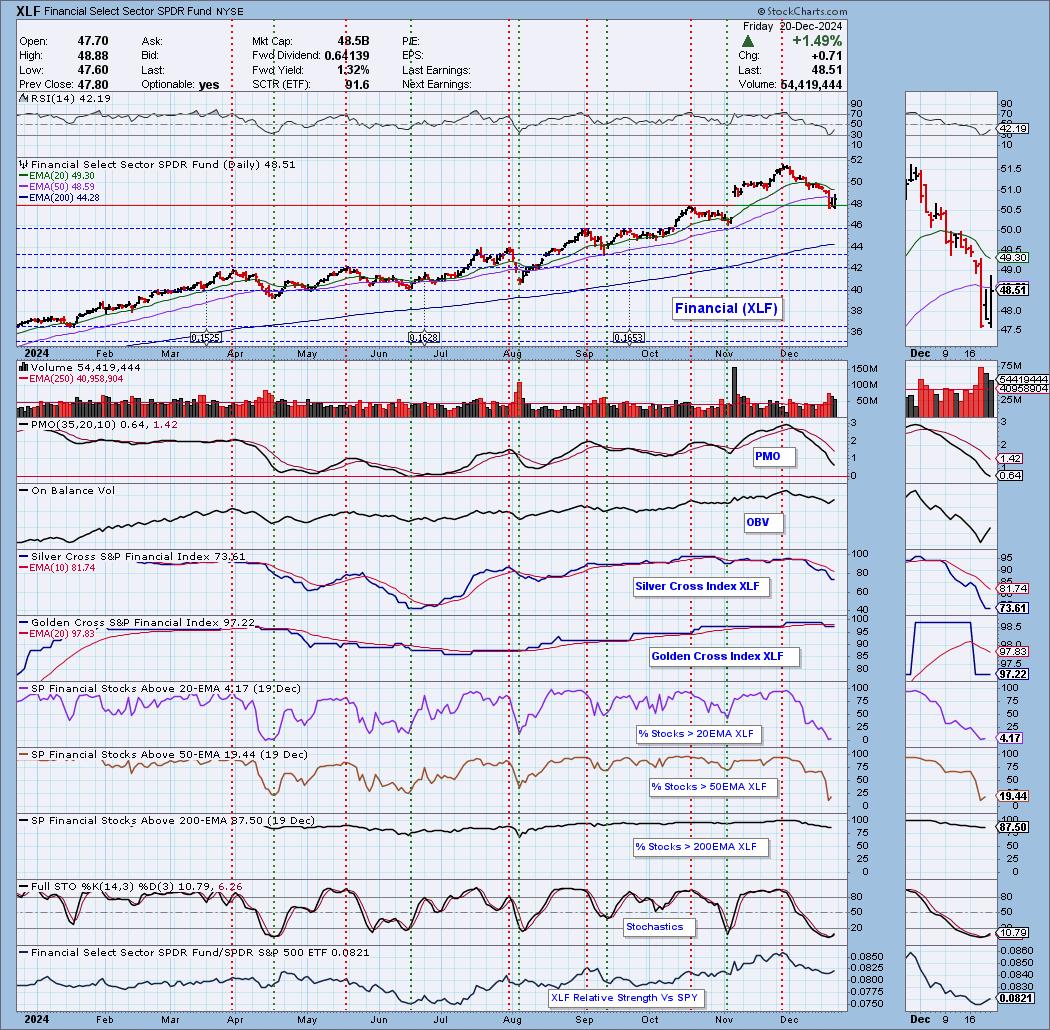
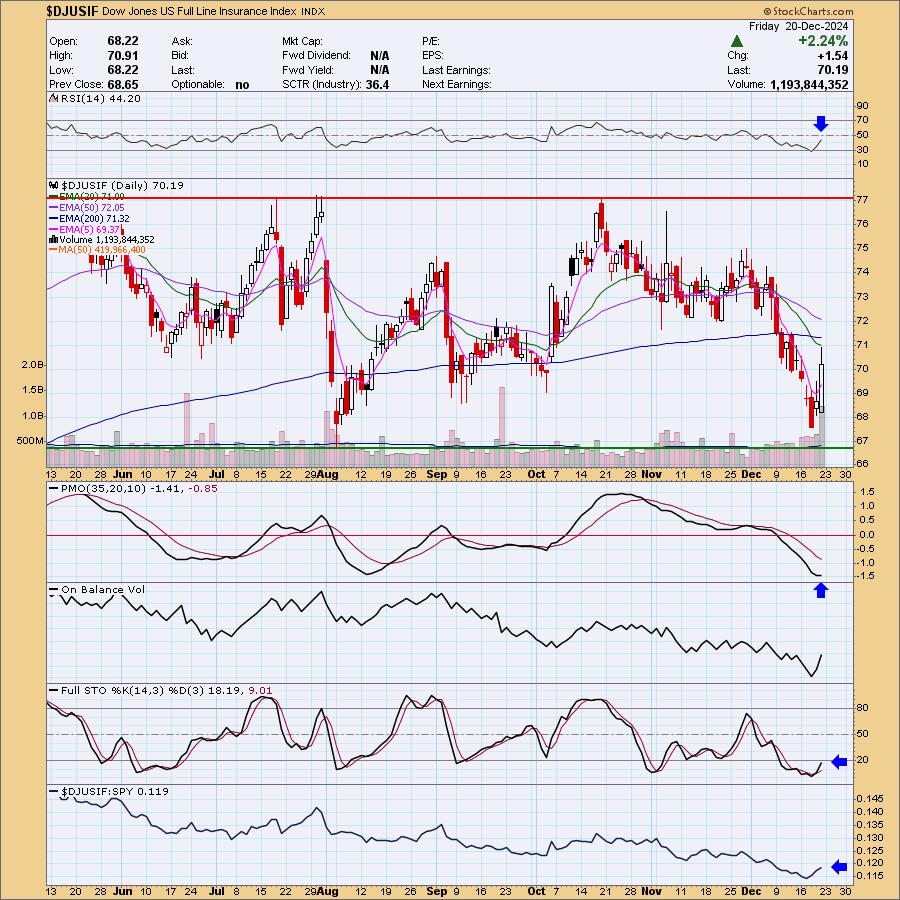
All of the sectors have declining PMOs so this week is another Sector to "WATCH", not necessarily a place to run out and invest in. I picked Financials (XLF) primarily because one of the few industry groups with rising momentum are in that sector. The Industry Group to Watch is Full Line Insurance with its rising PMO. I found a few symbols of interest to watch: CNA, AXAHY, AIG and HIG.
I had time to run a few scans at the end of the trading room and found a few symbols of interest. The one I liked best was Edwards Life Sciences (EW) which has a particularly good chart right now. The others are okay not great: GL, NWE, HRMY, EW, JBL and JWN.
Have a wonderful weekend as you prepare for the holidays! Below is the holiday schedule.
Good Luck & Good Trading,
Erin
--------------------
Schedule for both holiday weeks:
Monday - 4 stocks
Tuesday - 3 ETFs
Thursday - 3 stocks (Reader Requests if possible)
No trading room on 12/27, there WILL be a trading room 1/3!

Diamond Mine Trading Room:
RECORDING & DOWNLOAD LINK (12/20/2024):
Topic: DecisionPoint Diamond Mine (12/20/2024) LIVE Trading Room
Recording & Download Link
Passcode: December#20
REGISTRATION for 1/3/2025:
When: January 3, 2025 09:00 AM Pacific Time (US and Canada)
Topic: DecisionPoint Diamond Mine LIVE Trading Room
Register in advance for this webinar HERE
After registering, you will receive a confirmation email containing information about joining the webinar.

Below is the latest free DecisionPoint Trading Room recording from 12/16. You'll find these recordings posted on Mondays to our DP YouTube Channel. Be sure and subscribe HERE.
A few items about the spreadsheet: I've put on the spreadsheet whether the RSI is positive (green) or negative (red). The PMO column tells you if it is rising (green) or falling (red). Finally I've added my own "Sparkle Factor" that gives you my assessment going forward, bullish (green), bearish (red) or neutral (gray). The Sparkle Factor is basically my thoughts on whether I expect it to rise or fall. A neutral means it could really go either way so it could be added to a watch list. If you're in a stock I consider "neutral" going forward, the ball is in your court.
Darling:
Verona Pharma PLC (VRNA)
EARNINGS: 2025-02-27 (BMO)
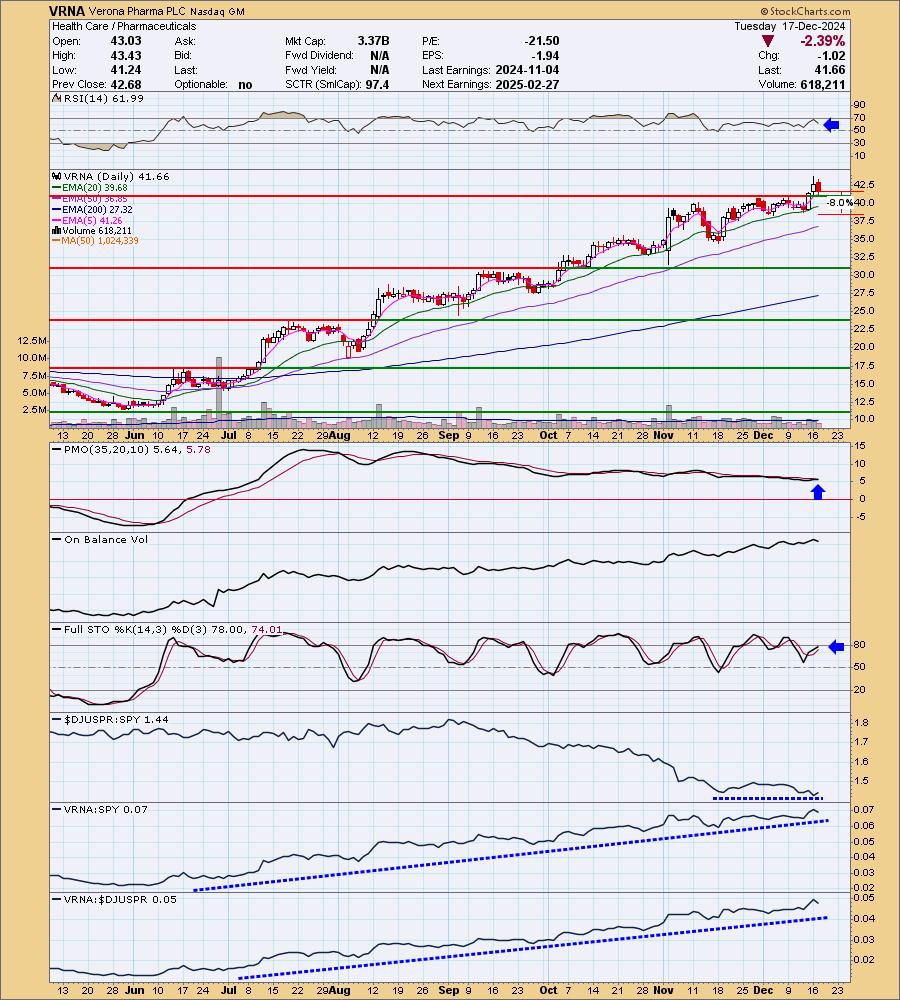
Verona Pharma Plc engages in the development and commercialization of therapeutics for the treatment of respiratory diseases. It focuses on developing inhaled ensifentrine for the maintenance treatment of chronic obstructive pulmonary disease. The company was founded by Michael J. A. Walker and Clive P. Page on February 24, 2005 and is headquartered in London, the United Kingdom.
Predefined Scans Triggered: P&F Ascending Triple Top Breakout and P&F Double Top Breakout.
Below are the commentary and chart from Tuesday, 12/17:
"VRNA is unchanged in after hours trading. It had a bad day but I like that it pulled back after the breakout. It held new support as well. The RSI is not overbought. The PMO is flat above the zero line telling us there is pure strength in momentum. Stochastics are almost above 80 and have been oscillating in positive territory. The group isn't underperforming, but neither is it outperforming. VRNA however is outperforming both the group and sector. It has shown relative strength for quite some time. The stop is set between the 20/50-day EMAs at 8% or $38.32."
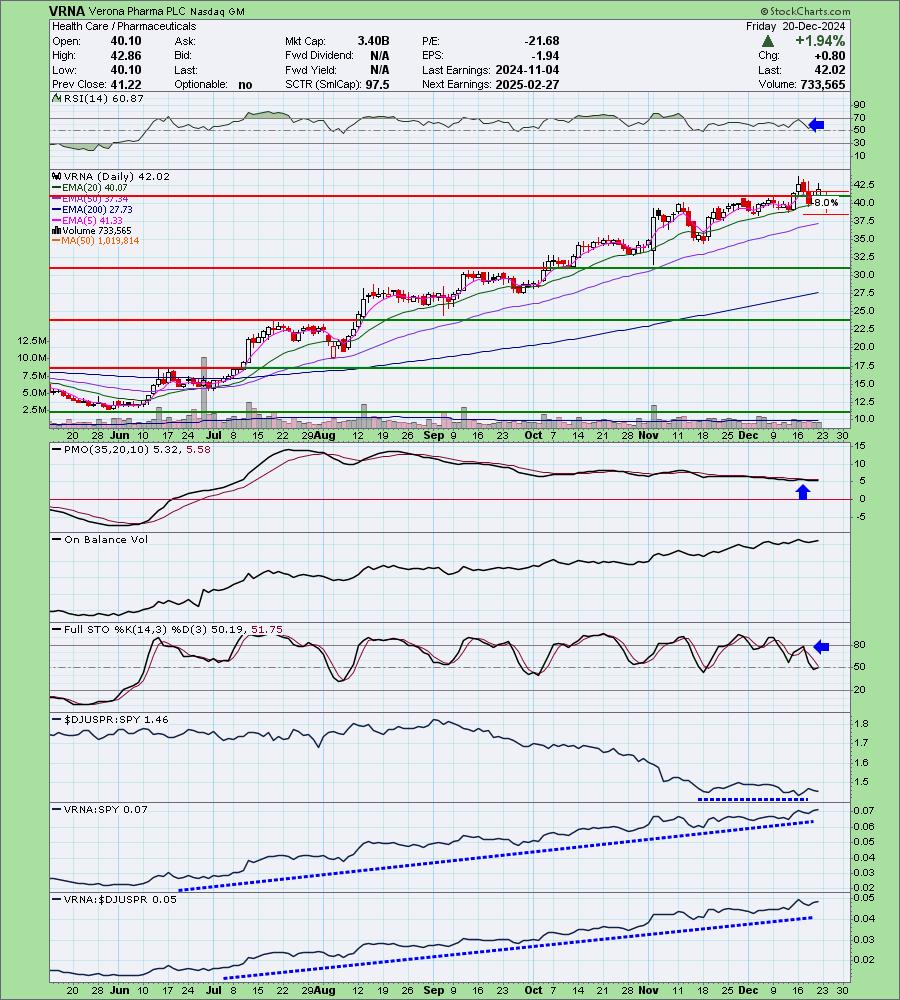
Here is today's chart:
The rising trend remains intact and the PMO is flat above the zero line indicating pure strength. This should keep price elevated. Stochastics have turned up again and relative strength for VRNA is still holding up. The group could do better, but it isn't dropping off the map as far as relative strength. I think there is more rally to come.
Don't forget, on Thursdays I look at reader-requested symbols, so shoot me an email at erin@decisionpoint.com. I read every email I receive and try to answer them all!
Dud:
Enphase Energy Inc. (ENPH)
EARNINGS: 2025-02-04 (AMC)
Enphase Energy, Inc. is a global energy technology company, which engages in the business of designing, developing, manufacturing, and selling home energy solutions that manage energy generation, energy storage, control, and communications on one intelligent platform. It operates through the following geographical segments: the United States, the Netherlands, and Others. The company was founded by Raghuveer R. Belur and Martin Fornage in March 2006 and is headquartered in Fremont, CA.
Predefined Scans Triggered: P&F Double Bottom Breakdown and New CCI Sell Signals.
Below are the commentary and chart from Thursday, 12/19:
"ENPH is up +0.30% in after hours trading. Price hit overhead resistance and failed to break out. This is an aggressive area of the market and I suspect it will really struggle should this decline get going. The RSI is negative and not yet oversold. The PMO has topped well beneath the zero line and Stochastics are below 20. ENPH isn't that poor a performer against the group so there may be some Renewable Energy stocks that look even worse. The group is not performing well and ENPH is underperforming the market. The stop is set as close to the 20-day EMA as I could get it at 7.7% or $70.86."
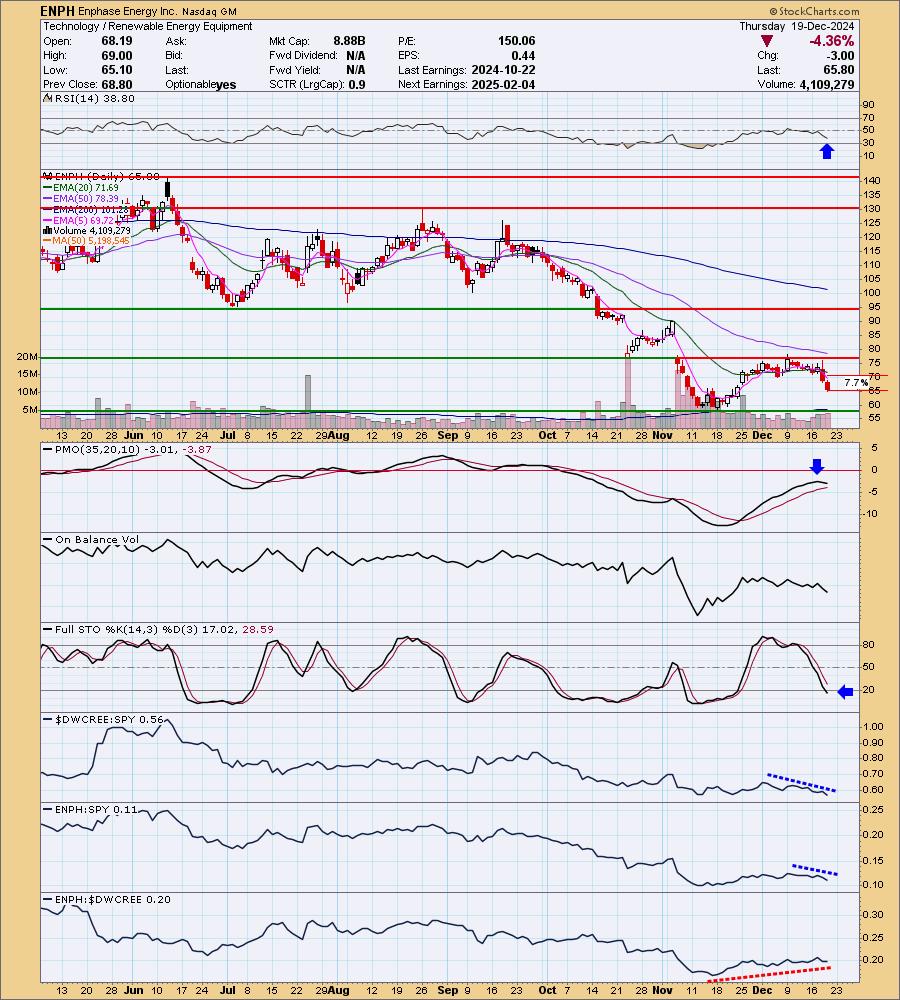
Here is today's chart:
We went short yesterday right before today's snapback rally. ENPH enjoyed a huge rally today despite the bearish declining trend. The PMO has since surged above the signal line. The chart is definitely looking more bullish, but if the market is going to struggle, this one really will. While it looks bullish, I would advise caution in investing in this area of the market. I still think it is vulnerable to decline.

THIS WEEK's Performance:
DecisionPoint Market Scoreboard (Mechanical Trend Model Signals):
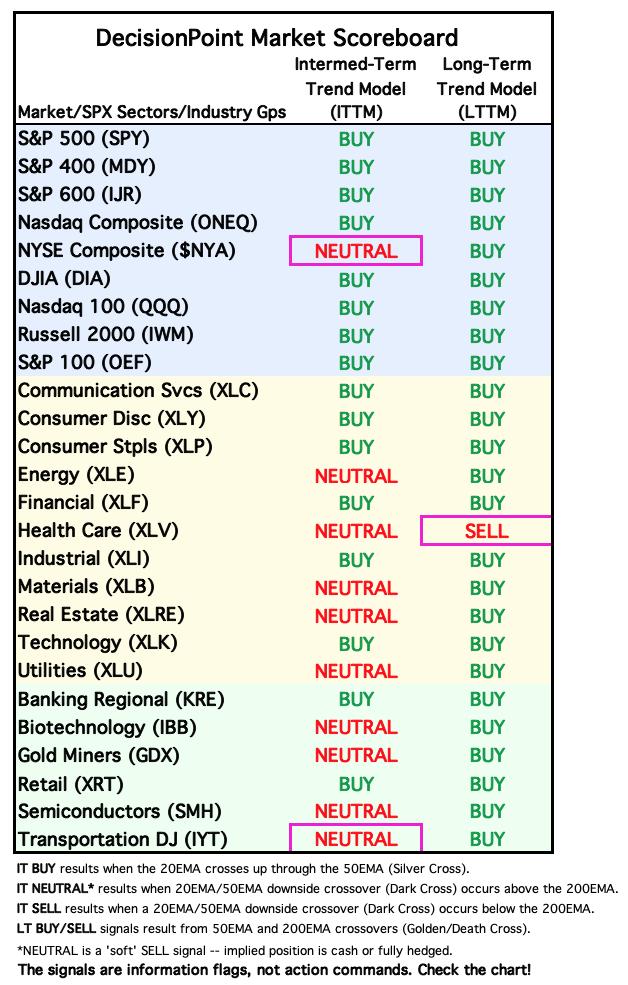
Friday signal changes are outlined in purple.
Click Here to view Carl's annotated "Under the Hood" ChartList!
Sector to Watch: Financials (XLF)
No sector currently holds rising momentum, but I will say a handful of sectors are sitting near or on support. Financials (XLF) is one that is sitting on support and trying to rebound. Participation is sickly as it is for most of the sectors right now. But there are a few signs of improvement. Stochastics have turned back up and we can see a little outperformance coming in. This sector has an good chance at an upside reversal, but if the market takes a turn for the worse next week, it will suffer alongside the rest of the sectors.
Industry Group to Watch: Full Line Insurance ($DJUSIF)
This is one of three industry groups of all industry groups that has a positive PMO. It is in a trading range, but it is bouncing strongly off the bottom of the range. In fact, it reversed before price even had to touch the support line at the bottom of the range. The RSI is negative but rising nicely. Stochastics are rising and a little bit of outperformance is coming in.
Go to our Under the Hood ChartList on DecisionPoint.com to get an in-depth view of all the sectors. On StockCharts.com you can find the Industry Summary.
Good Luck & Good Trading!
- Erin
erin@decisionpoint.com
Full Disclosure: I'm 35% long, 0% short.
Watch the latest episode of the DecisionPoint Trading Room with Carl & Erin Swenlin HERE!
Technical Analysis is a windsock, not a crystal ball. --Carl Swenlin
NOTE: The stocks reported herein are from mechanical trading model scans that are based upon moving average relationships, momentum and volume. DecisionPoint analysis is then applied to get selections from the scans. The selections given should prompt readers to do a chart review using their own analysis process. This letter is not a call for a specific action to buy, sell or short any of the stocks provided. There are NO sure things or guaranteed returns on the selection of "diamonds in the rough."
Helpful DecisionPoint Links:
DecisionPoint Shared ChartList and DecisionPoint Chart Gallery
Price Momentum Oscillator (PMO)
Swenlin Trading Oscillators (STO-B and STO-V)
(c) Copyright 2024 DecisionPoint.com