
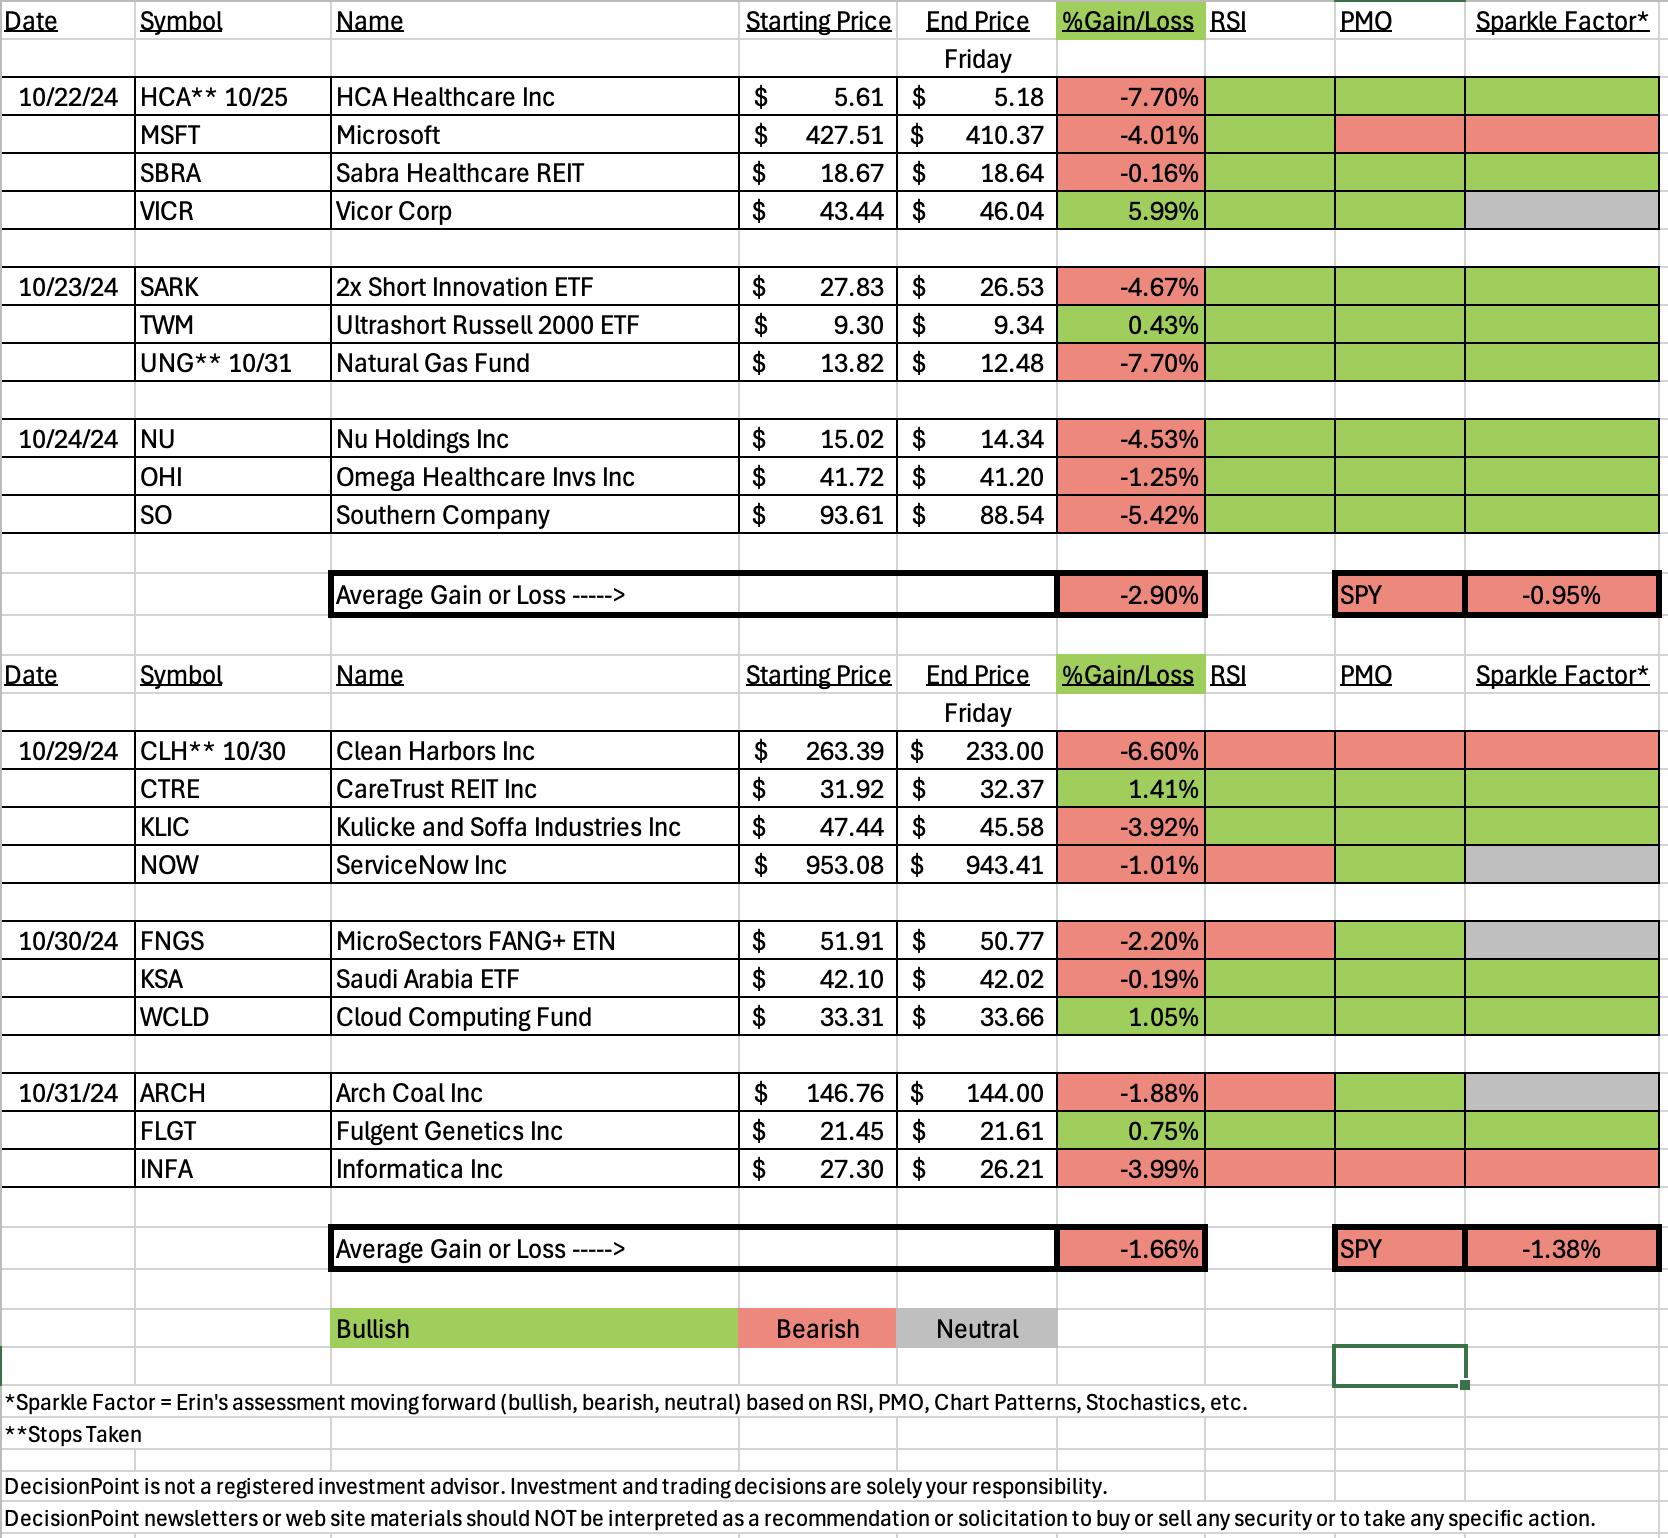
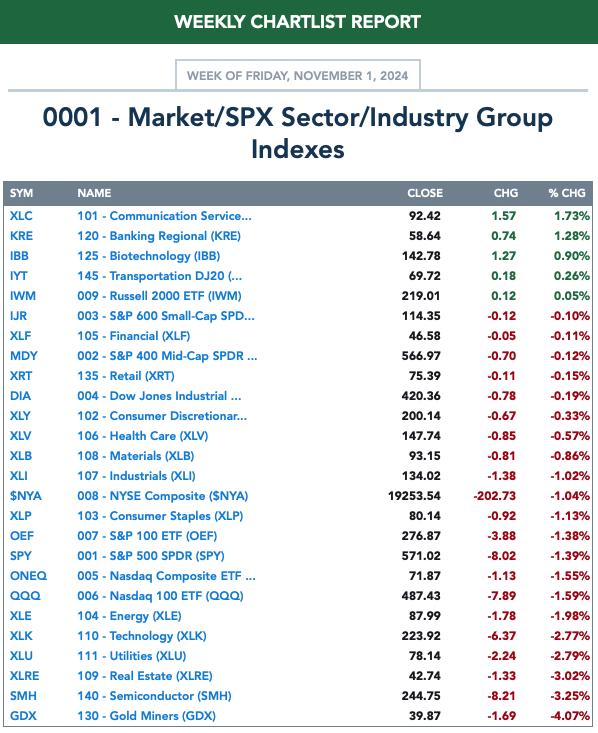
The market had a tough week and consequently we had a tough week too. The past two weeks have been difficult given the SPY has been moving sideways and slowly moving down. Today's rally softened the blow of the decline this week, but the effects of the decline were clearly felt on our spreadsheet. Finding new longs will definitely be challenging as we move forward so I may start including some shorts next week depending on how the market reacts to the upcoming election and Fed announcement.
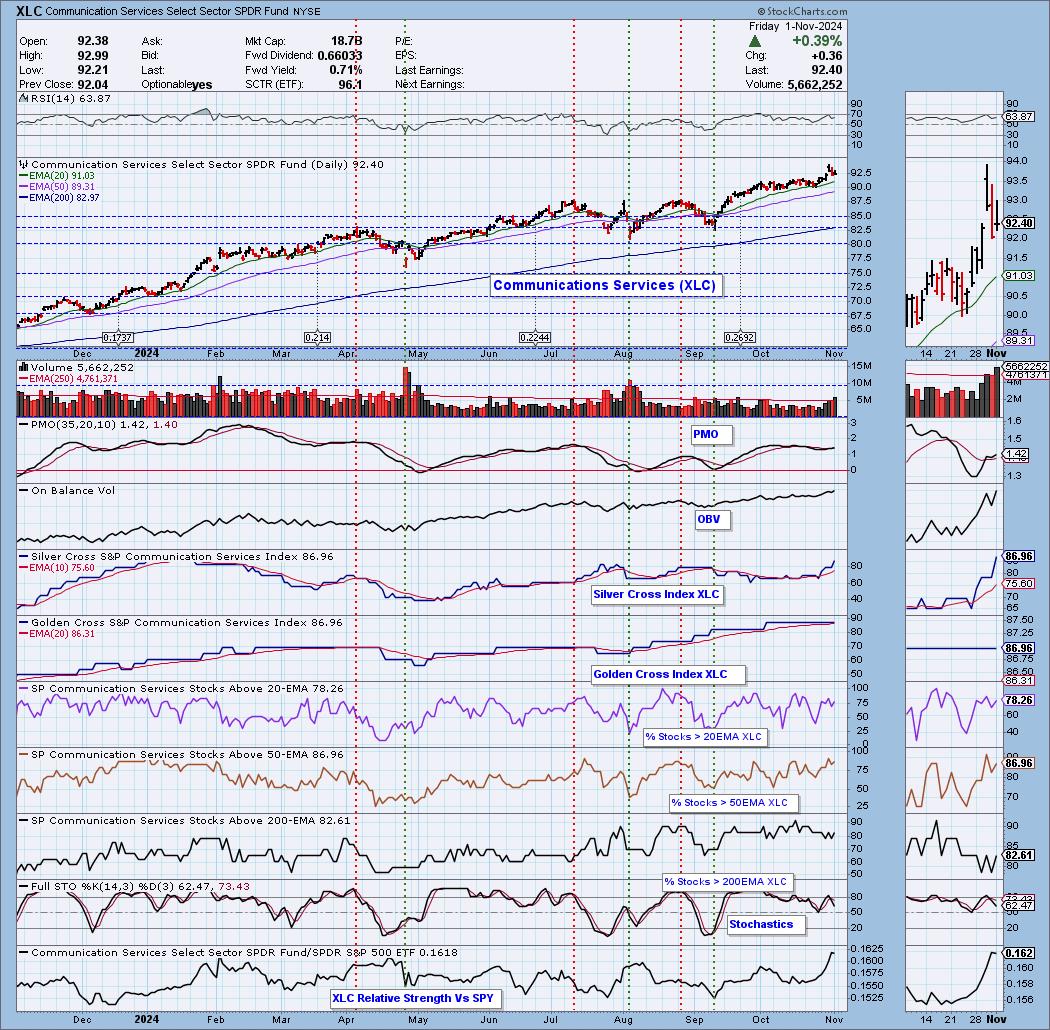
This week the Sector to Watch was Communication Services (XLC) which was the only sector with a rising PMO so the decision was somewhat easy. Consumer Discretionary (XLY) is trying to turn back up, but it hasn't yet.
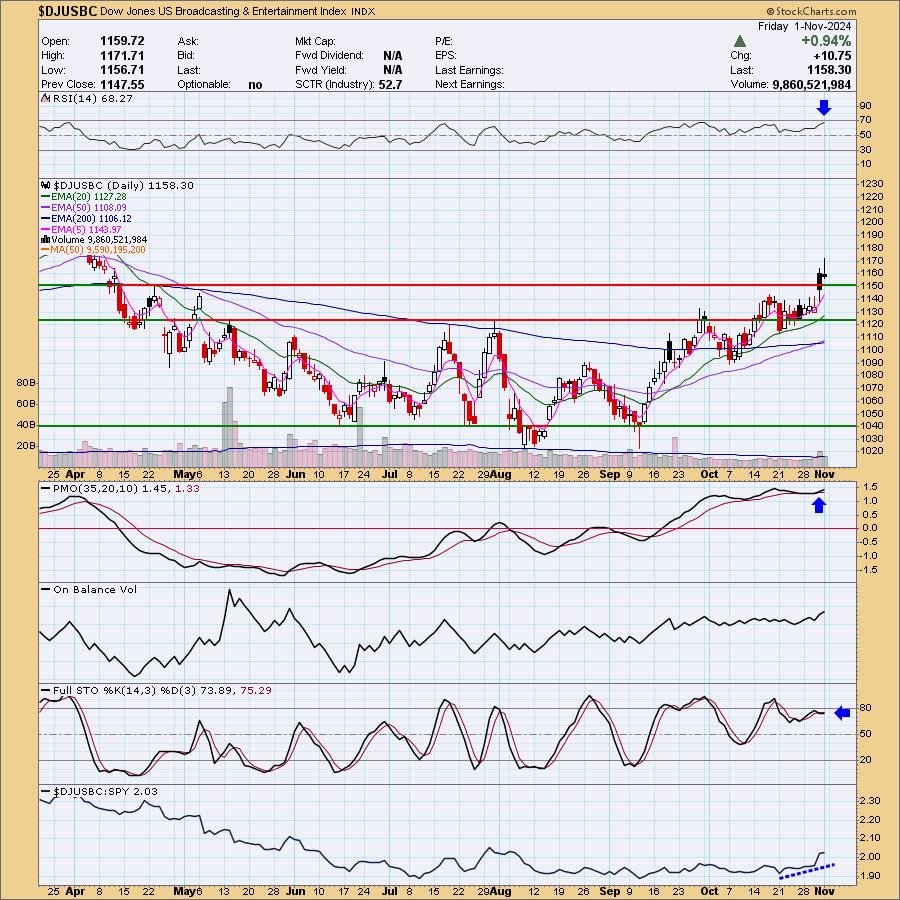
The Industry Group to Watch was Fixed Line Telecommunications but by day's end the PMO had turned down. In any case I did find three symbols from this area that look bullish: LUMN, T and EGHT. I opted to go with Broadcasting & Entertainment. It was looking overbought this morning, but it has the best chart I could see. Unfortunately I didn't find any symbols within the group to share so it is a lukewarm choice. With the market acting toppy it is going to be difficult to find pockets of strength. Overall we need to take our cue from the open on Monday to decide if expanding our portfolios makes sense.
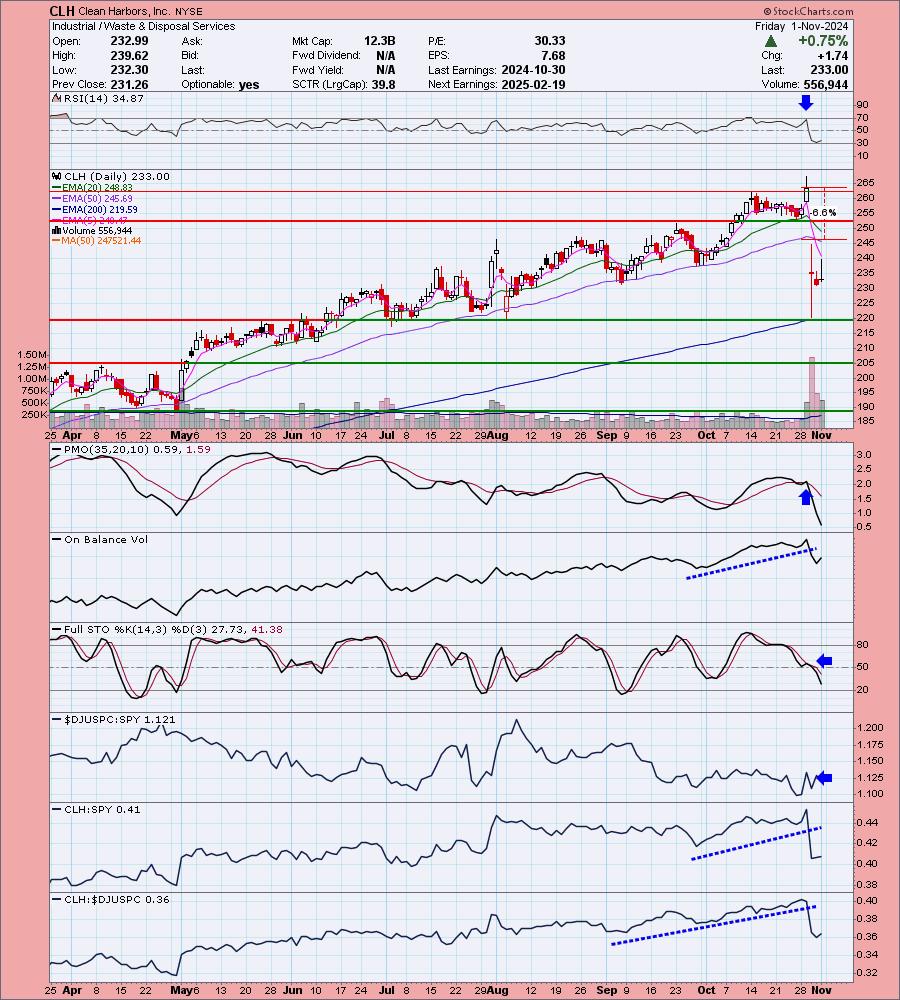
The "Darling" this week was CareTrust REIT (CTRE) which finished higher by +1.41%. The "Dud" was Clean Harbors which reported earnings and was hit hard to the downside. I need to avoid earnings that are coming in within the week. We never know how stocks will be affected.
I ran a number of scans at the end of the trading room and was able to 'mine' ZBRA, PRAA, RVTY, BKR, GHC and CNMD.
Have a great weekend! I'll see you in the trading room Monday! If you have any subjects you'd like Carl and I to review, feel free to email me at erin@decisionpoint.com.
Good Luck & Good Trading,
Erin

Diamond Mine Trading Room:
RECORDING & DOWNLOAD LINK (11/1/2024):
Topic: DecisionPoint Diamond Mine (11/1/2024) LIVE Trading Room
Recording & Download Link
Passcode: November#1
REGISTRATION for 11/8/2024:
When: November 8, 2024 09:00 AM Pacific Time (US and Canada)
Topic: DecisionPoint Diamond Mine LIVE Trading Room
Register in advance for this webinar HERE
After registering, you will receive a confirmation email containing information about joining the webinar.

Below is the latest free DecisionPoint Trading Room recording from 10/28. You'll find these recordings posted on Mondays to our DP YouTube Channel. Be sure and subscribe HERE.
A few items about the spreadsheet: I've put on the spreadsheet whether the RSI is positive (green) or negative (red). The PMO column tells you if it is rising (green) or falling (red). Finally I've added my own "Sparkle Factor" that gives you my assessment going forward, bullish (green), bearish (red) or neutral (gray). The Sparkle Factor is basically my thoughts on whether I expect it to rise or fall. A neutral means it could really go either way so it could be added to a watch list. If you're in a stock I consider "neutral" going forward, the ball is in your court.
Darling:
CareTrust REIT, Inc. (CTRE)
EARNINGS: 2024-10-29 (AMC)
CareTrust REIT, Inc. engages in the ownership, acquisition, and leasing of healthcare-related properties. It offers independent living, memory care, and assisted, and skilled nursing facilities. The company was founded on October 29, 2013 and is headquartered in San Clemente, CA.
Predefined Scans Triggered: Moved Above Upper Keltner Channel, New 52-week Highs, Stocks in a New Uptrend (Aroon), Moved Above Upper Price Channel, P&F Ascending Triple Top Breakout and P&F Double Top Breakout.
Below are the commentary and chart from Tuesday, 10/29:
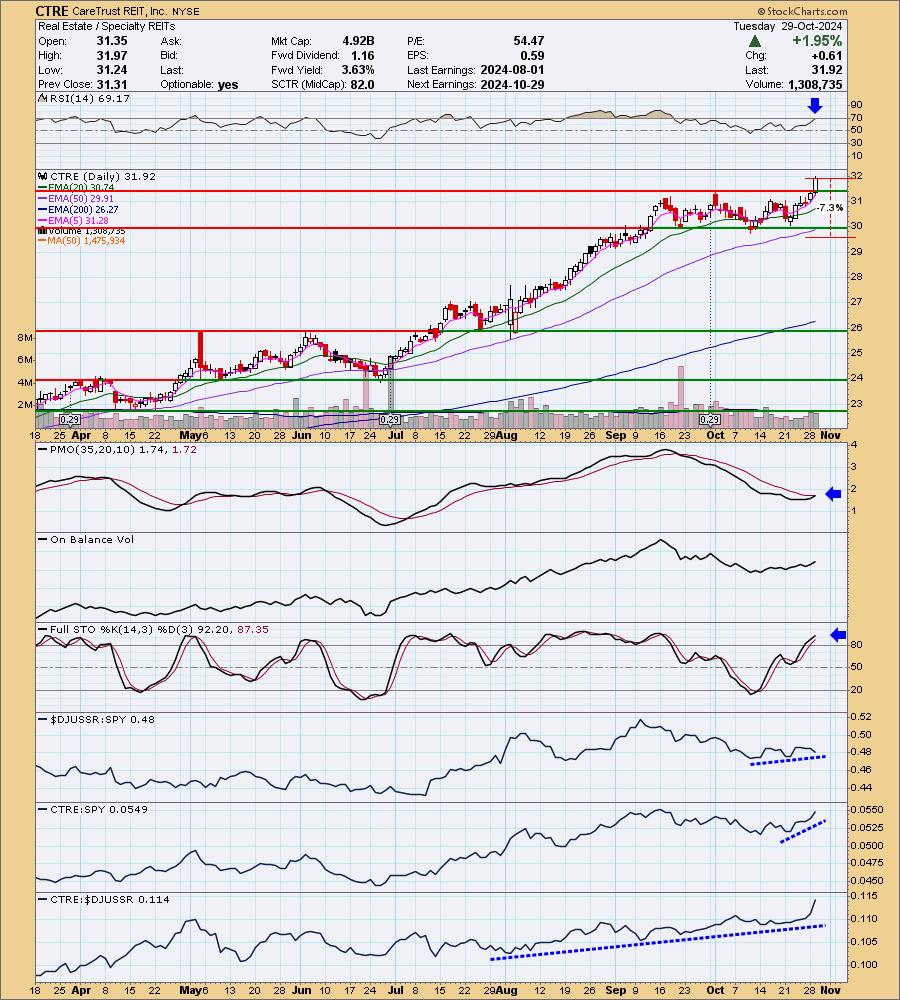
"CTRE is down -2.79% in after hours trading. They reported earnings after the bell today and based on after hours trading, it may hiccup tomorrow, but that could offer a better entry. The RSI is starting to get overbought, but we can see it can hold overbought conditions for some time. Ultimately it consolidated sideways rather than dropping lower and now it has broken out. The PMO is on a new Crossover BUY Signal and Stochastics are above 80. Relative strength for the group is rising and not falling. CTRE is performing very well against the SPY and has shown leadership based on the long running rising relative strength against the group. I've set the stop below support at 7.3% or $29.58."
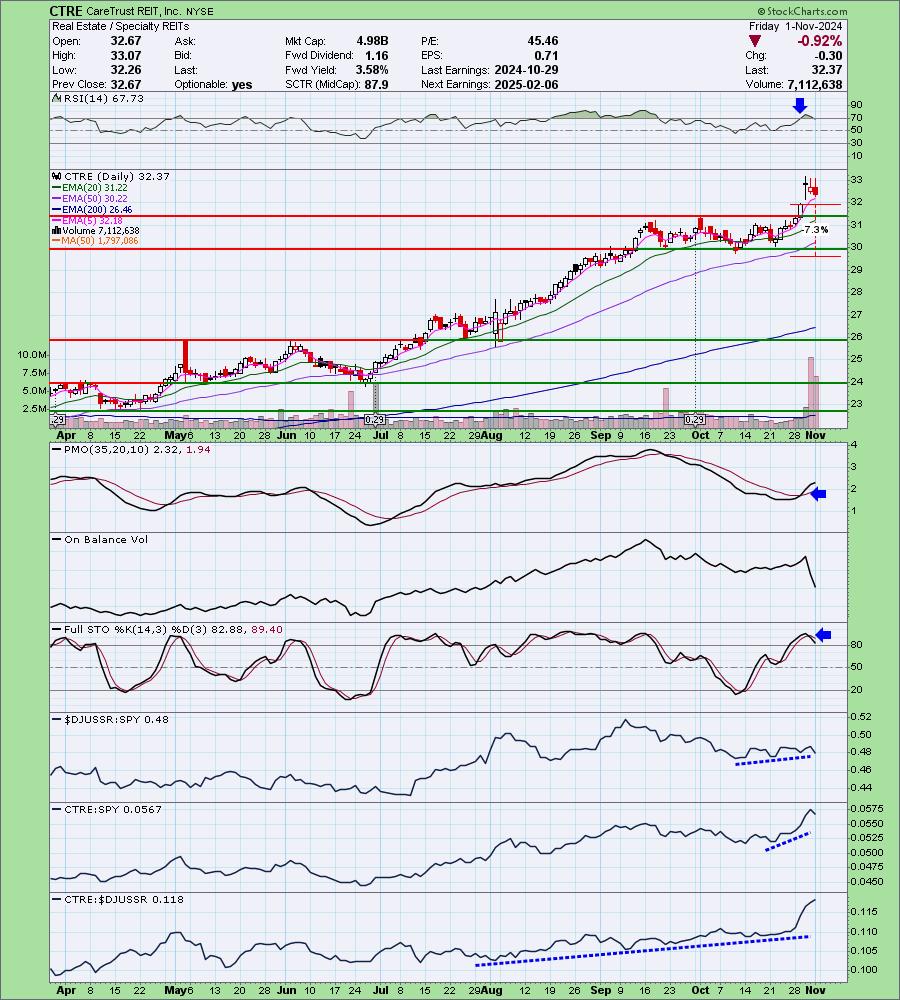
Here is today's chart:
Earnings are what helped this one continue a breakout. At this point, it is digesting the move, likely in preparation for more upside. The decline of the past few days has helpfully pulled the RSI out of overbought territory. Despite the recent decline, the PMO is still rising and Stochastics, while not rising, are still holding above 80. I'm looking for a resumption of the rally.
Don't forget, on Thursdays I look at reader-requested symbols, so shoot me an email at erin@decisionpoint.com. I read every email I receive and try to answer them all!
Dud:
Clean Harbors, Inc. (CLH)
EARNINGS: 2024-10-30 (BMO)
Clean Harbors, Inc. engages in the provision of environmental, energy, and industrial services. It operates through the Environmental Services and the Safety-Kleen Sustainability Solutions segments. The Environmental Services segment consists of the technical services, industrial services, field services, and oil, gas, and lodging businesses. The Safety-Kleen Sustainability Solutions segment includes parts washer services, containerized waste services, vac services, used motor oil collection, and sale of base and blended oil products. The company was founded by Alan S. McKim in 1980 and is headquartered in Norwell, MA.
Predefined Scans Triggered: Elder Bar Turned Green, New CCI Buy Signals, New 52-week Highs, Stocks in a New Uptrend (ADX), Stocks in a New Uptrend (Aroon), Moved Above Upper Price Channel, Parabolic SAR Buy Signals, P&F Double Top Breakout and P&F Triple Top Breakout.
Below are the commentary and chart from Tuesday, 10/29:
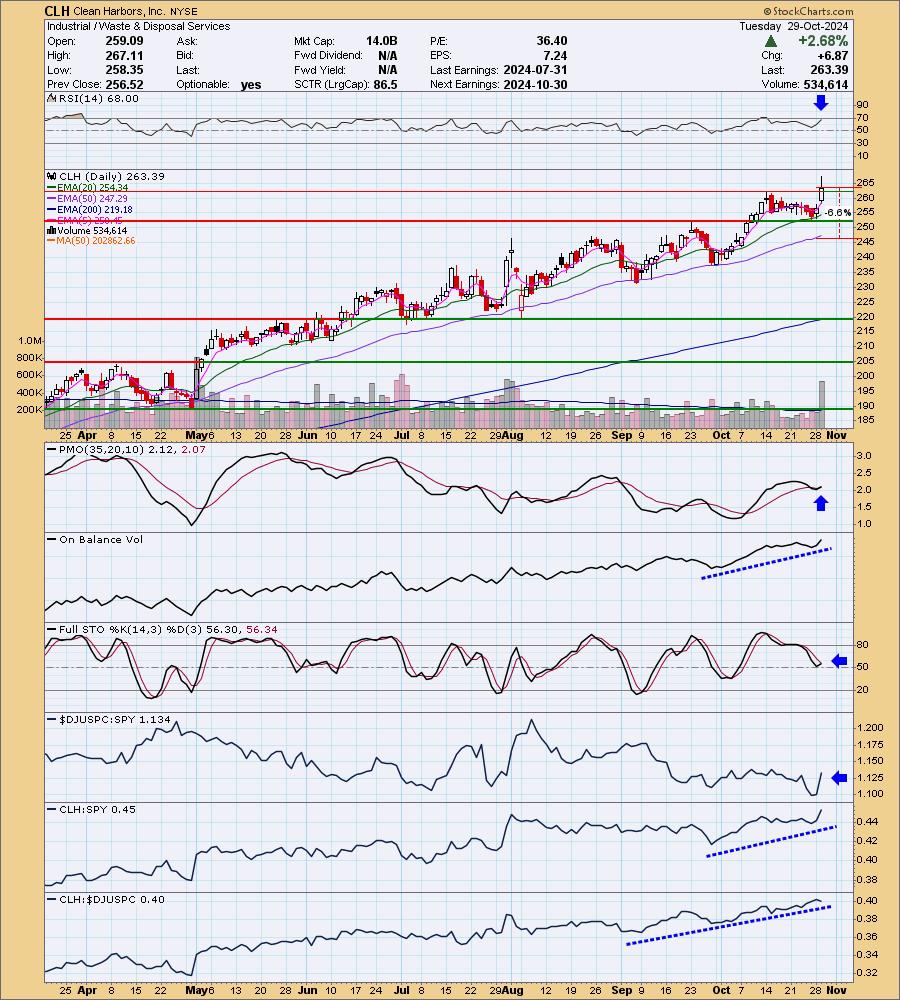
"CLH is up +1.75% in after hours trading which suggests to me it will do well on earnings. Today's breakout executes a bull flag formation whose upside target is around $285. The RSI is not overbought yet. The PMO has whipsawed into a Crossover BUY Signal well above the zero line signifying strength. The OBV is confirming the rally. Stochastics have turned back up. The group is really starting to breakout based on relative strength. It has done very well against the group and consequently it is outperforming the SPY. The stop is set at the 50-day EMA at 6.6% or $246.00."
Here is today's chart:
This was a surprise given the strong upside breakout going into earnings. Earnings clearly were not well received. It was a mistake to include a stock getting so close to earnings, but admittedly this one was really set up well. I can't even point to anything that would've clued us in that this decline might happen.
THIS WEEK's Performance:
DecisionPoint Market Scoreboard (Mechanical Trend Model Signals):
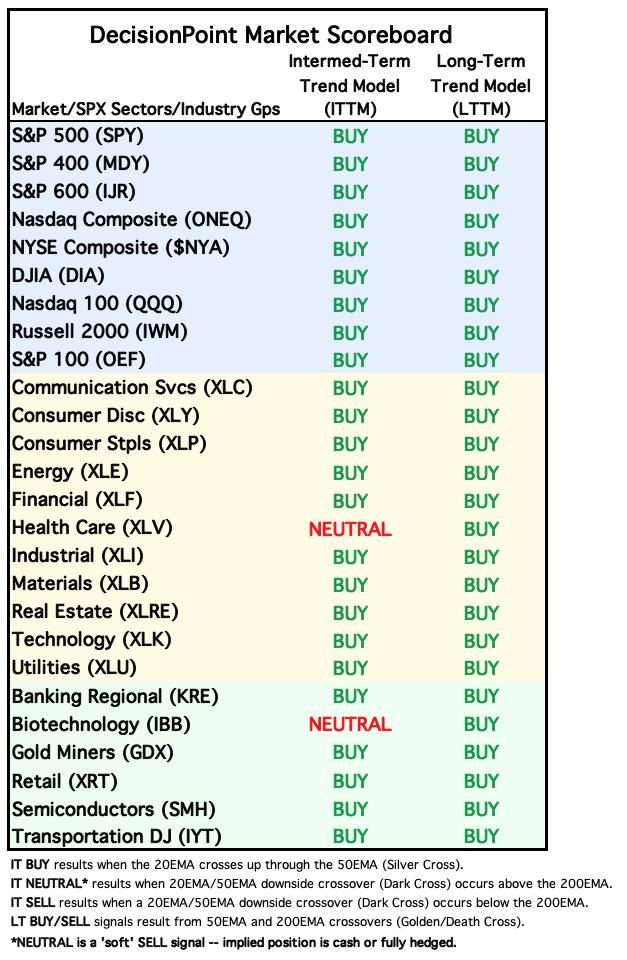
Friday signal changes are outlined in purple.
Click Here to view Carl's annotated "Under the Hood" ChartList!
Sector to Watch: Communication Services (XLC)
Price appears to have pulled back to support at all those prior tops. The PMO had topped yesterday, but on today's rally it immediately turned back up again giving us PMO Surge above the signal line. The Silver Cross Index is rising strongly and participation of stocks above key moving averages is robust. One issue is the falling Stochastics, but check out relative strength, very impressive. Keep an eye on this sector next week. If the market resumes its decline, all bets are off.
Industry Group to Watch: Broadcasting & Entertainment ($DJUSSW)
I was hoping to find some symbols inside the industry group with charts similar to this one, but I wasn't able to find any. You may want to do your own search inside the group and see what you can find as this chart is quite bullish. The candlesticks are decidedly bearish so we should see some consolidation or a pause, but ultimately I'm looking for the group to go higher based on the positive RSI and rising PMO which crafted a BUY signal well above the zero line. There is also the new Golden Cross of the 50/200-day EMAs. Wish I could've found better though.
Go to our Under the Hood ChartList on DecisionPoint.com to get an in-depth view of all the sectors. On StockCharts.com you can find the Industry Summary.
Good Luck & Good Trading!
- Erin
erin@decisionpoint.com
Full Disclosure: I'm 65% long, 0% short.
Watch the latest episode of the DecisionPoint Trading Room with Carl & Erin Swenlin HERE!
Technical Analysis is a windsock, not a crystal ball. --Carl Swenlin
NOTE: The stocks reported herein are from mechanical trading model scans that are based upon moving average relationships, momentum and volume. DecisionPoint analysis is then applied to get selections from the scans. The selections given should prompt readers to do a chart review using their own analysis process. This letter is not a call for a specific action to buy, sell or short any of the stocks provided. There are NO sure things or guaranteed returns on the selection of "diamonds in the rough."
Helpful DecisionPoint Links:
DecisionPoint Shared ChartList and DecisionPoint Chart Gallery
Price Momentum Oscillator (PMO)
Swenlin Trading Oscillators (STO-B and STO-V)
(c) Copyright 2024 DecisionPoint.com