
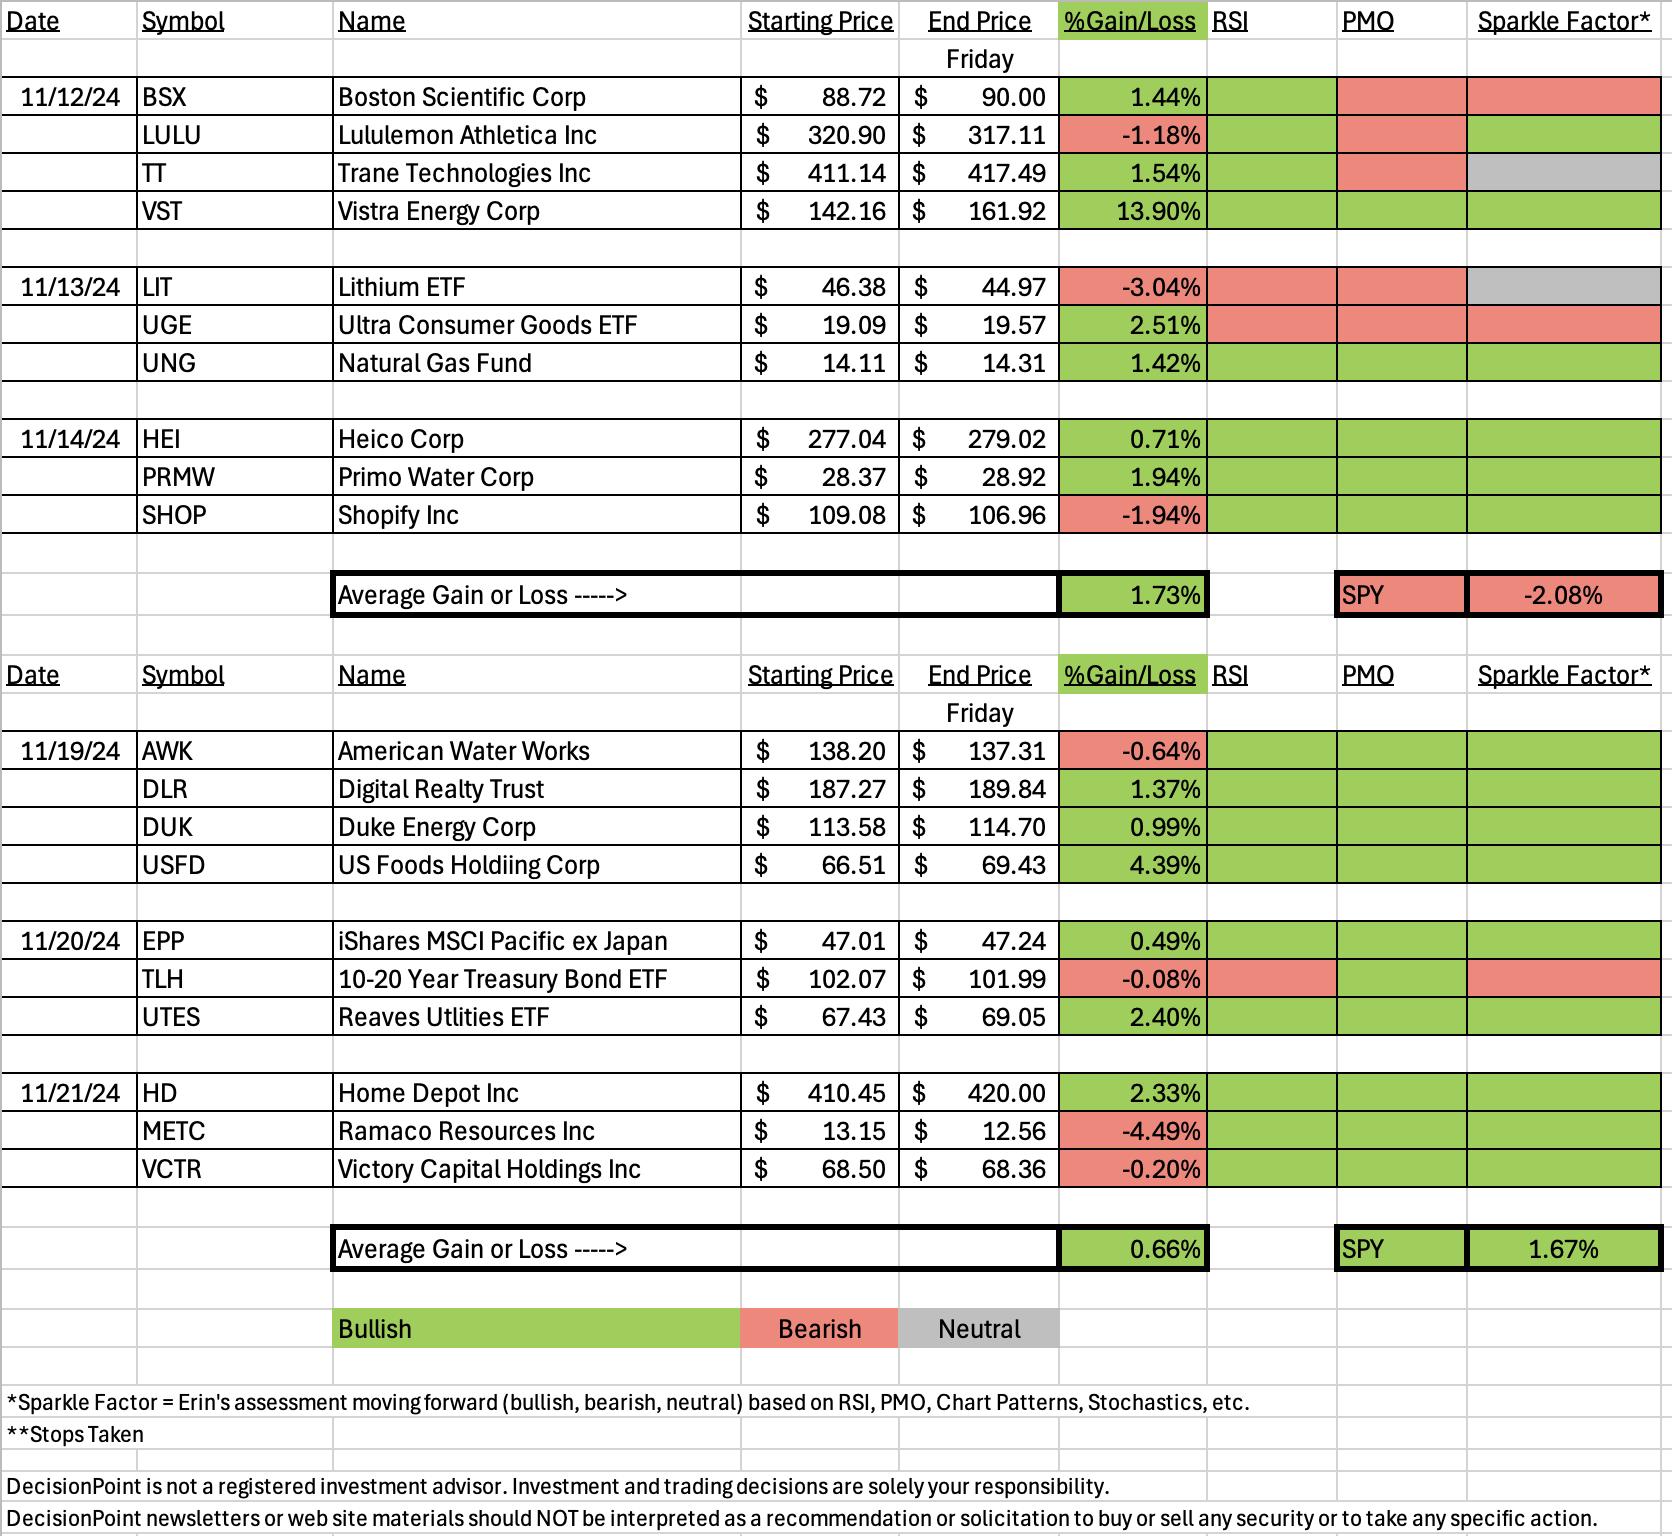
The spreadsheets often confirm that it is critical that we know the trend and condition of the market before investing. Last week the trend was down and nearly all of the positions were reading in the red. This week the trend changed up and last week's stocks/ETFs moved into green territory and this week saw good results overall. While "Diamonds in the Rough" weren't up as high as the SPY this week, nearly all have merit moving forward.
The Bond ETF turned out to be the only one with a Bearish Sparkle Factor. The rest look healthy enough to expect some upside, even on our Dud this week, Ramaco (METC).
The Darling for the week was US Foods (USFD) which was up over 4% since being picked on Tuesday. It is in this week's Sector to Watch.
Speaking of the Sector to Watch, we opted for Consumer Staples (XLP) going into next week. Investors do seem to be hedging their bets somewhat as we saw excellent performance by Utilities this week. We'll be watching Healthcare and Real Estate closely as they are somewhat defensive as well.
The Industry Group to Watch was Tobacco. I found four symbols of interest from this group: UVV, BTI, IMBBY and PM. Take a look at those charts and see what you think.
We ran the Diamonds PMO Scan and the Momentum Sleepers Scan to finish of the trading room. There were quite a few candidates that I found from those scans that you might want to add to your watch list: AAT, CALM, DEI, VNOM, GE, INN and SLP.
Have a great weekend! I'll see you in the trading room Monday!
Good Luck & Good Trading,
Erin
***********************************
Schedule for next week: Monday (4 picks), Tuesday (3 picks ETFs) and Wednesday (3 Reader Requests). There will be no Diamond Mine trading room but the Recap will go out as usual Friday afternoon/evening.

Diamond Mine Trading Room:
RECORDING & DOWNLOAD LINK (11/22/2024):
Topic: DecisionPoint Diamond Mine (11/22/2024) LIVE Trading Room
Recording & Download Link
Passcode: November#22
REGISTRATION for 12/6/2024:
When: December 6, 2024 09:00 AM Pacific Time (US and Canada)
Topic: DecisionPoint Diamond Mine LIVE Trading Room
Register in advance for this webinar HERE
After registering, you will receive a confirmation email containing information about joining the webinar.

Below is the latest free DecisionPoint Trading Room recording from 11/18. You'll find these recordings posted on Mondays to our DP YouTube Channel. Be sure and subscribe HERE.
A few items about the spreadsheet: I've put on the spreadsheet whether the RSI is positive (green) or negative (red). The PMO column tells you if it is rising (green) or falling (red). Finally I've added my own "Sparkle Factor" that gives you my assessment going forward, bullish (green), bearish (red) or neutral (gray). The Sparkle Factor is basically my thoughts on whether I expect it to rise or fall. A neutral means it could really go either way so it could be added to a watch list. If you're in a stock I consider "neutral" going forward, the ball is in your court.
Darling:
US Foods Holding Corp. (USFD)
EARNINGS: 2025-02-13 (BMO)
US Foods Holding Corp. is a foodservice distributor, which engages in the frozen and dry food and non-food products to foodservice customers throughout the U.S. The company offers services under brands Chef's Line, del Pasado, Glenview Farms, Cattleman's Selection, Cross Valley Farms, Harbor Banks, Hilltop Hearth, Devonshire, and Metro Deli. The company was founded on May 23, 2007, and is headquartered in Rosemont, IL.
Predefined Scans Triggered: None.
Below are the commentary and chart from Tuesday, 11/19:
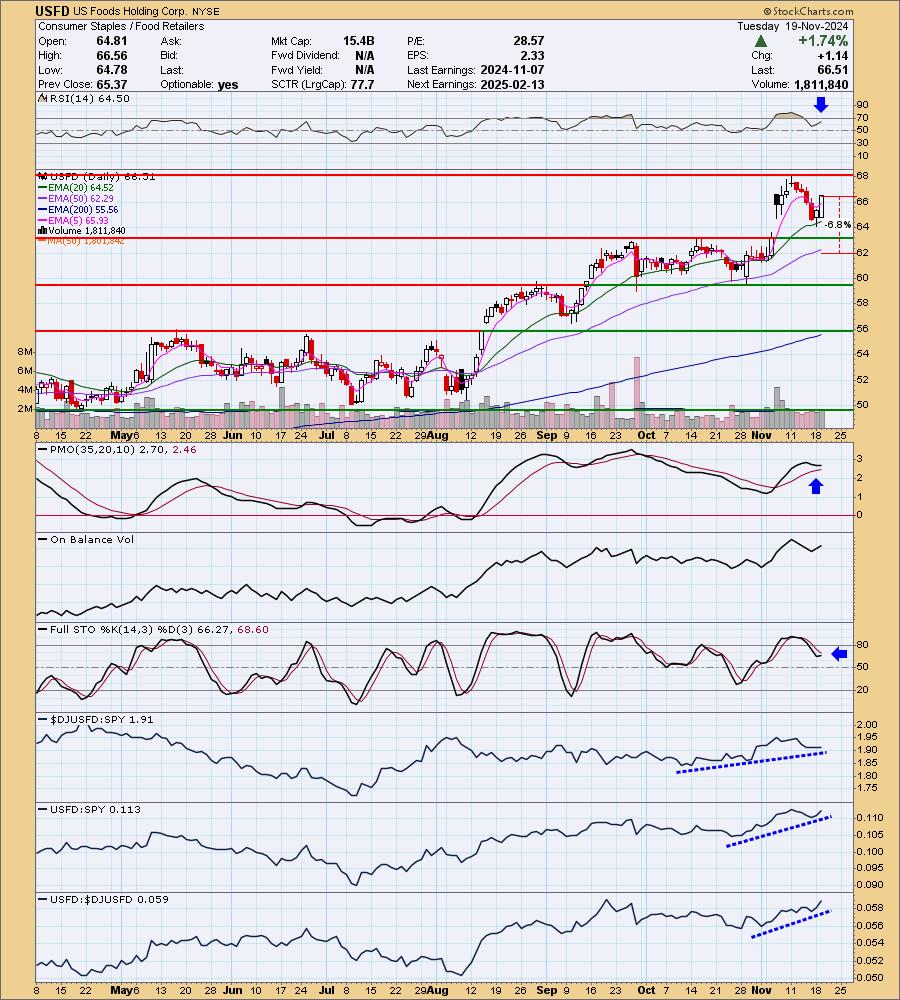
"USFD is up +0.06% in after hours trading. I'm going out on a limb here given Consumer Staples aren't performing that well, but the rising trend on this one and the PMO Surge above the signal line got me interested. Price is bouncing upward without having to touch the support line and that is bullish. The RSI is positive and rising. The PMO as noted above has bottomed above the signal line. Stochastics have reversed higher. While the sector isn't performing well, Food Retailers are outperforming the SPY. USFD is showing strength against both the group and the SPY. I've set the stop beneath the 50-day EMA at 6.8% or $61.98."
Here is today's chart:
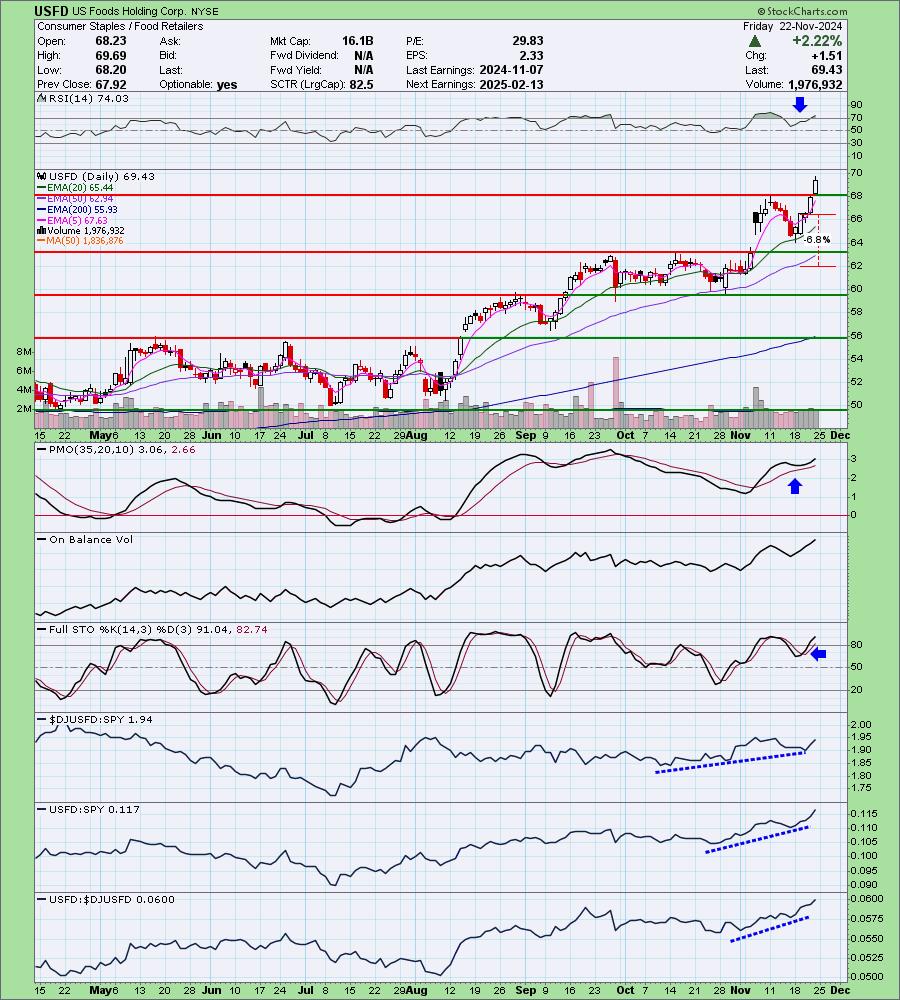
We got a new breakout today after a nice rally yesterday. This has brought the RSI into overbought territory so we should be on the lookout for a pause or digestion period. This is a strong thrust upward and does look like it will see more followthrough. Raise you stop and look for more upside after a possible pause.
Don't forget, on Thursdays I look at reader-requested symbols, so shoot me an email at erin@decisionpoint.com. I read every email I receive and try to answer them all!
Dud:
Ramaco Resources, Inc. (METC)
EARNINGS: 2025-03-06 (AMC)
Ramaco Resources, Inc. engages in the operation and development of coal mining properties. The firm deals with metallurgical coal in central and southern West Virginia, southwestern Virginia and southwestern Pennsylvania. Its portfolio consists of Elk Creek, Berwind, RAM Mine, and Knox Creek. The company was founded by Randall W. Atkins in August 2015 and is headquartered in Lexington, KY.
Predefined Scans Triggered: Elder Bar Turned Green, Moved Above Upper Price Channel, New CCI Buy Signals and P&F Double Top Breakout.
Below are the commentary and chart from Thursday, 11/21:
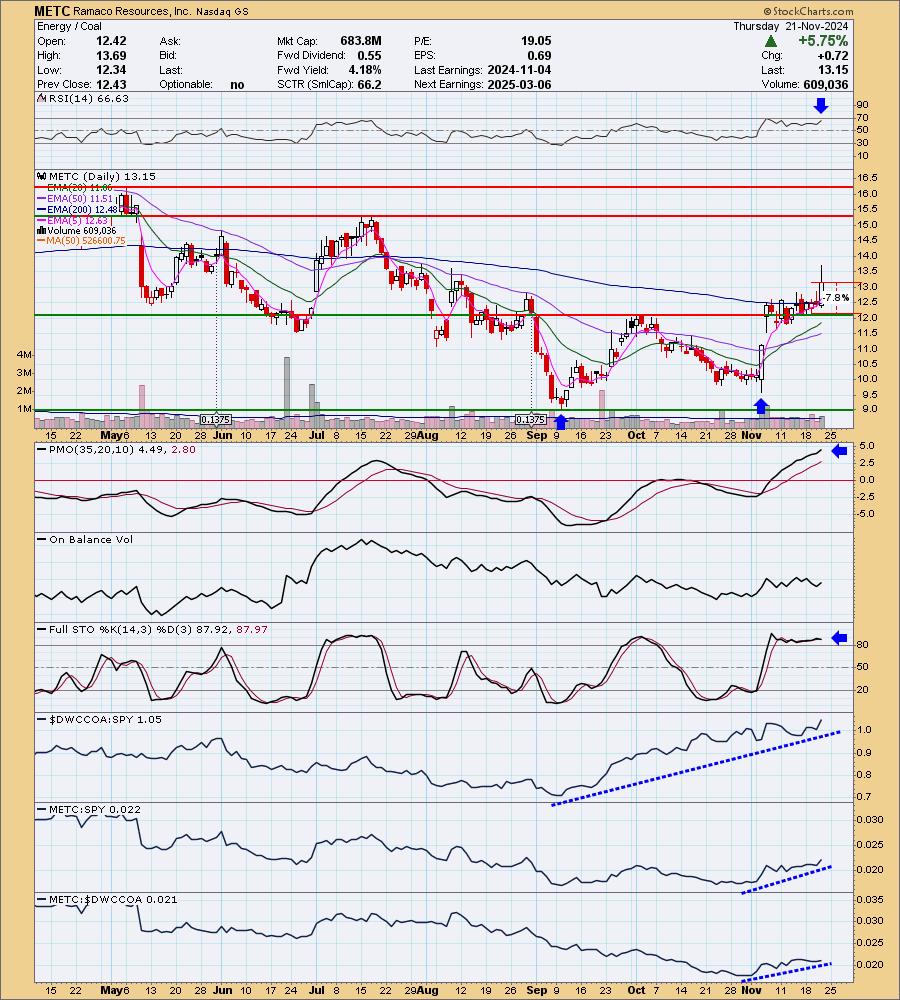
"METC is unchanged in after hours trading. I really liked this chart. We have a large bullish double bottom pattern. Price has confirmed it on the breakout. The target of the pattern would take price to the next level of overhead resistance. Today's rally was a nice thrust upward. The RSI is positive and not yet overbought. The PMO is accelerating higher well above the zero line. Stochastics have camped out above 80 and relative strength studies show rising trends across the board. I set the stop as close to support as I could. It would be over 8% if I went below it and that is too deep for me. I set it at 7.8% or $12.12."
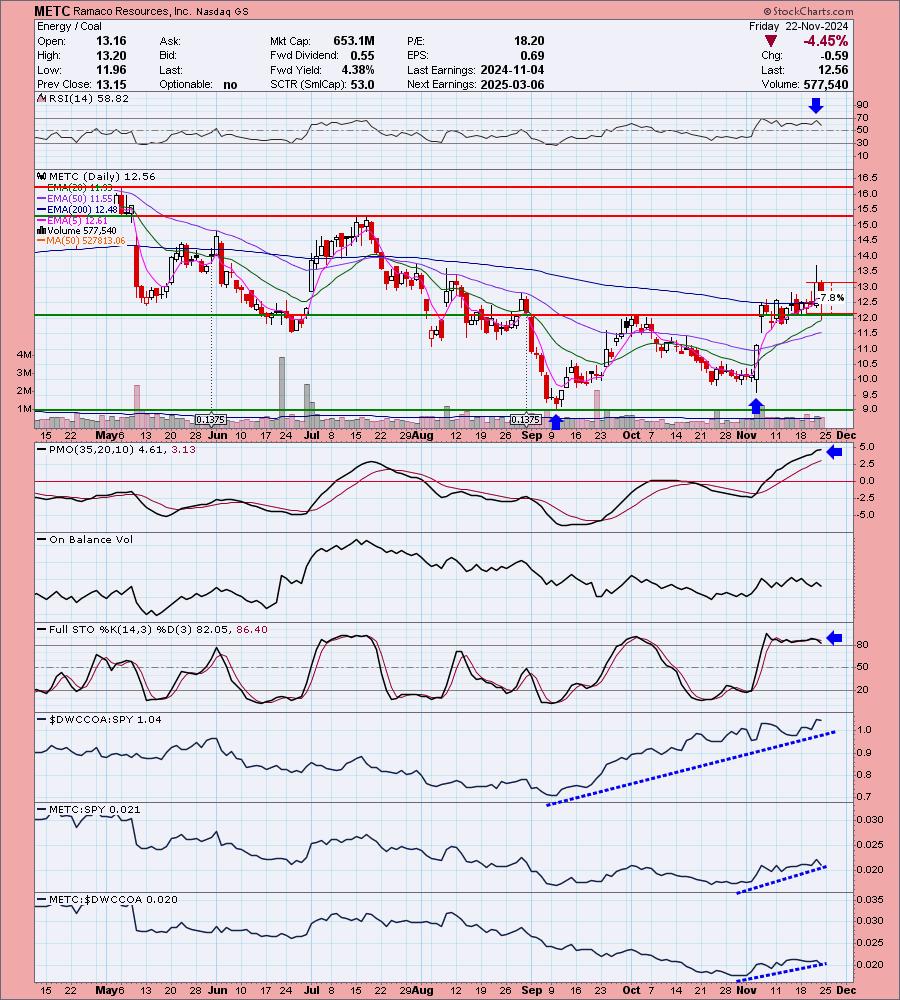
Here is today's chart:
What went wrong here? Well it was a one day price shock without any indication that it was on the way. The only thing I could see was that on the chart above the Stochastics had topped slightly. It is likely just one of those things that you can't account for. I do still have a bullish Sparkle Factor here as I think the underlying technicals still look bullish overall. It was just a bad trading day.
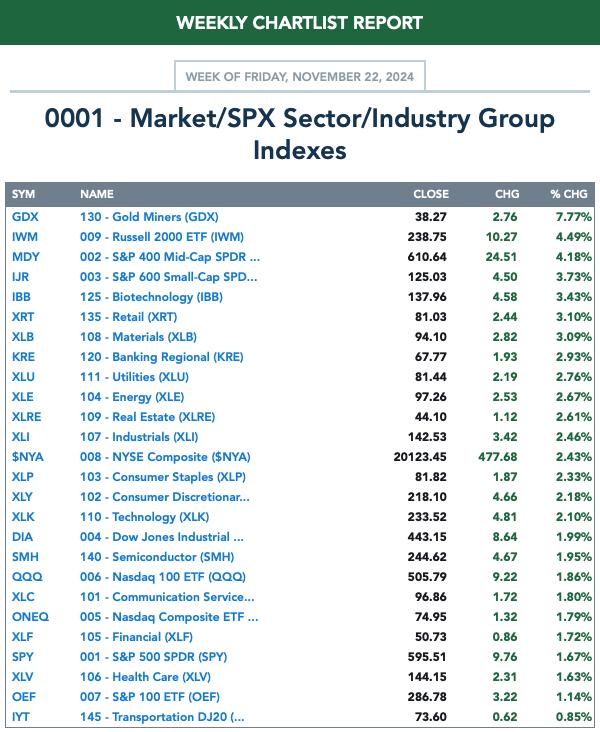
THIS WEEK's Performance:
DecisionPoint Market Scoreboard (Mechanical Trend Model Signals):
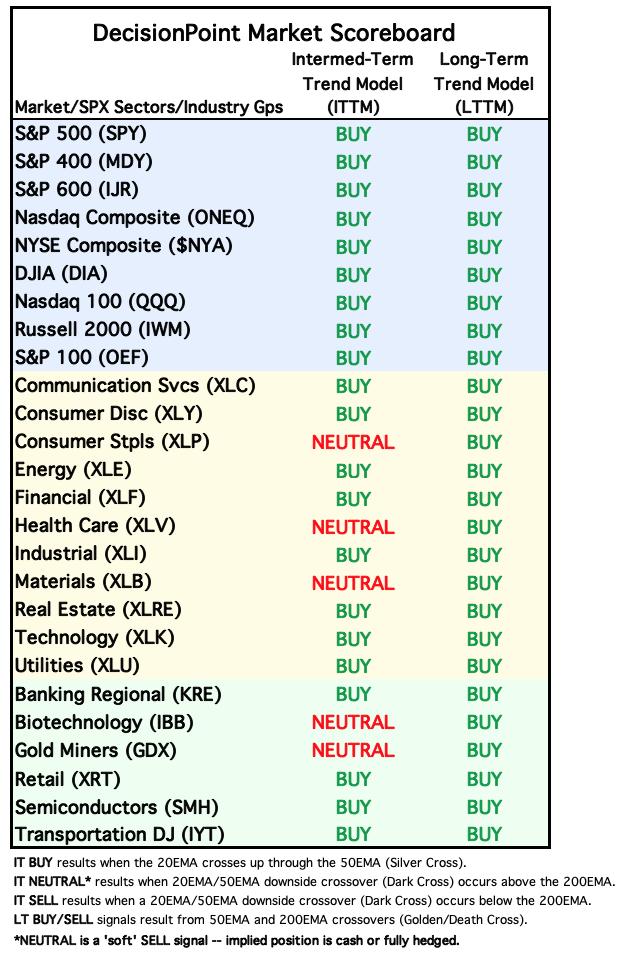
Friday signal changes are outlined in purple.
Click Here to view Carl's annotated "Under the Hood" ChartList!
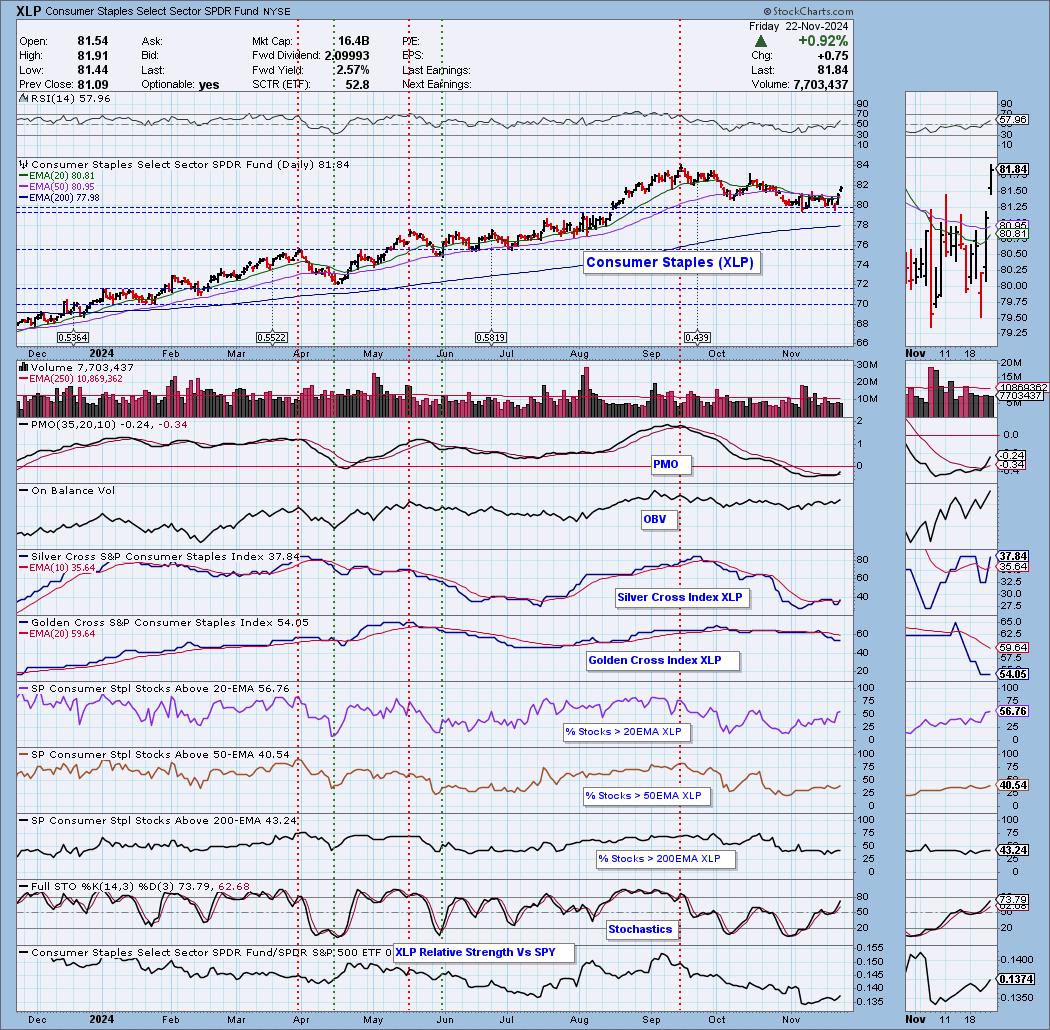
Sector to Watch: Consumer Staples (XLP)
XLP gapped up today, breaking from a declining trend. Price managed to overcome both the 20/50-day EMAs yesterday on its rally and today saw excellent followthrough. Participation isn't particularly robust as far as stocks above key moving averages but we do see a rising trend in %Stocks > 20/50EMAs. Stochastics are on their way higher and the PMO is on a new Crossover BUY Signal. The OBV is rising confirming rising price bottoms. The Silver Cross Index had a Bullish Shift across its signal line today and the Golden Cross Index has stopped its decline. We should see this rally get legs as investors are moving into more defensive areas of the market now.
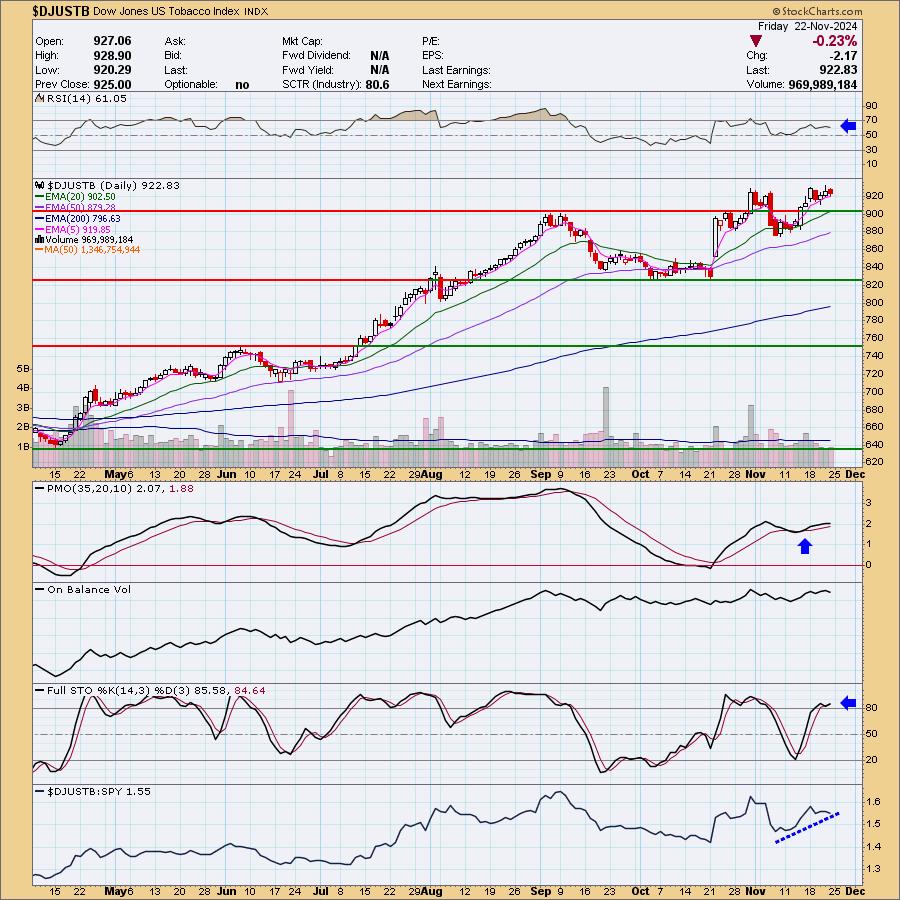
Industry Group to Watch: Tobacco ($DJUSTB)
We don't actually have a breakout yet, but the indicators are bullish enough to look for one. The RSI is positive and not at all overbought so it can accommodate far more upside. The PMO is rising on a Crossover BUY Signal and Stochastics turned up while above 80. Relative strength is mostly on the rise. The stock symbols we found today: UVV, BTI, IMBBY and PM.
Go to our Under the Hood ChartList on DecisionPoint.com to get an in-depth view of all the sectors. On StockCharts.com you can find the Industry Summary.
Good Luck & Good Trading!
- Erin
erin@decisionpoint.com
Full Disclosure: I'm 60% long, 0% short.
Watch the latest episode of the DecisionPoint Trading Room with Carl & Erin Swenlin HERE!
Technical Analysis is a windsock, not a crystal ball. --Carl Swenlin
NOTE: The stocks reported herein are from mechanical trading model scans that are based upon moving average relationships, momentum and volume. DecisionPoint analysis is then applied to get selections from the scans. The selections given should prompt readers to do a chart review using their own analysis process. This letter is not a call for a specific action to buy, sell or short any of the stocks provided. There are NO sure things or guaranteed returns on the selection of "diamonds in the rough."
Helpful DecisionPoint Links:
DecisionPoint Shared ChartList and DecisionPoint Chart Gallery
Price Momentum Oscillator (PMO)
Swenlin Trading Oscillators (STO-B and STO-V)
(c) Copyright 2024 DecisionPoint.com