
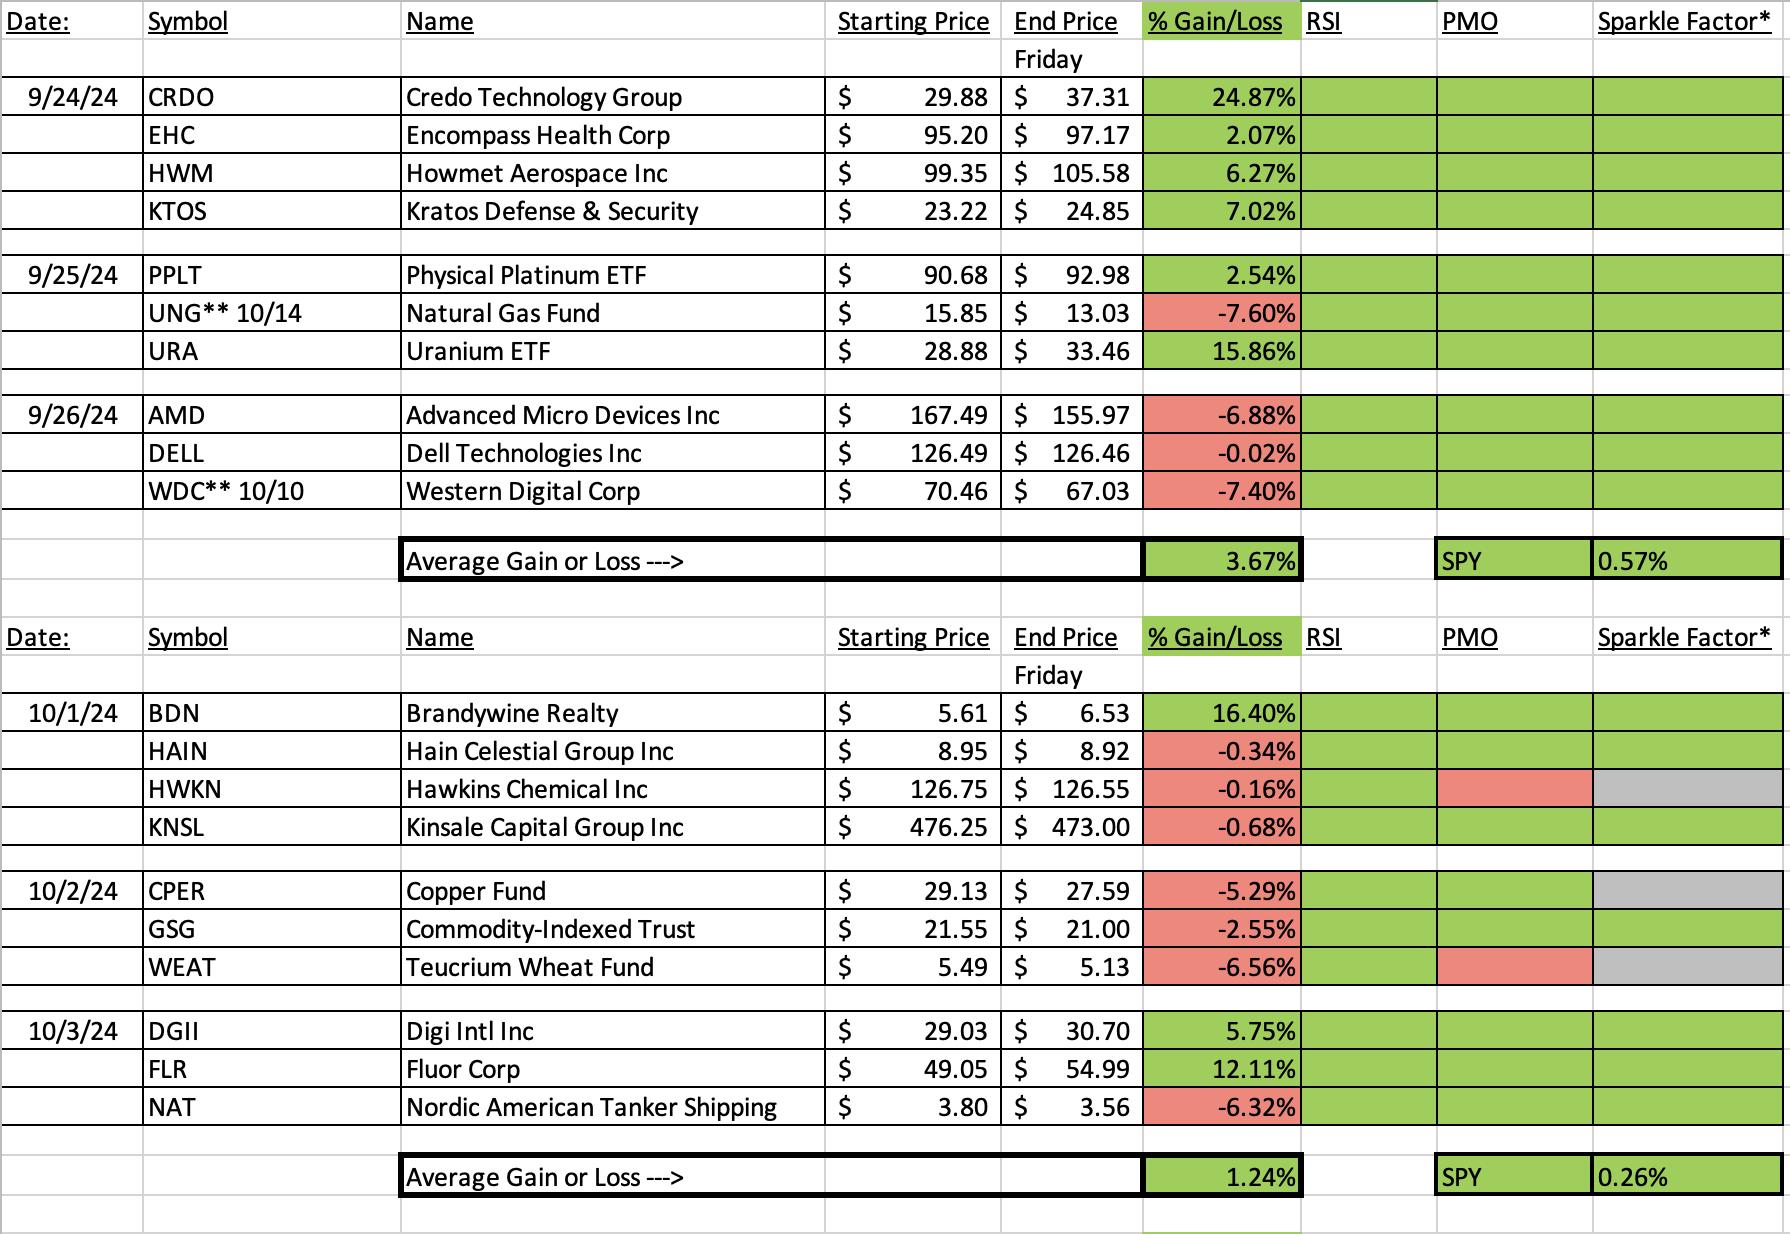
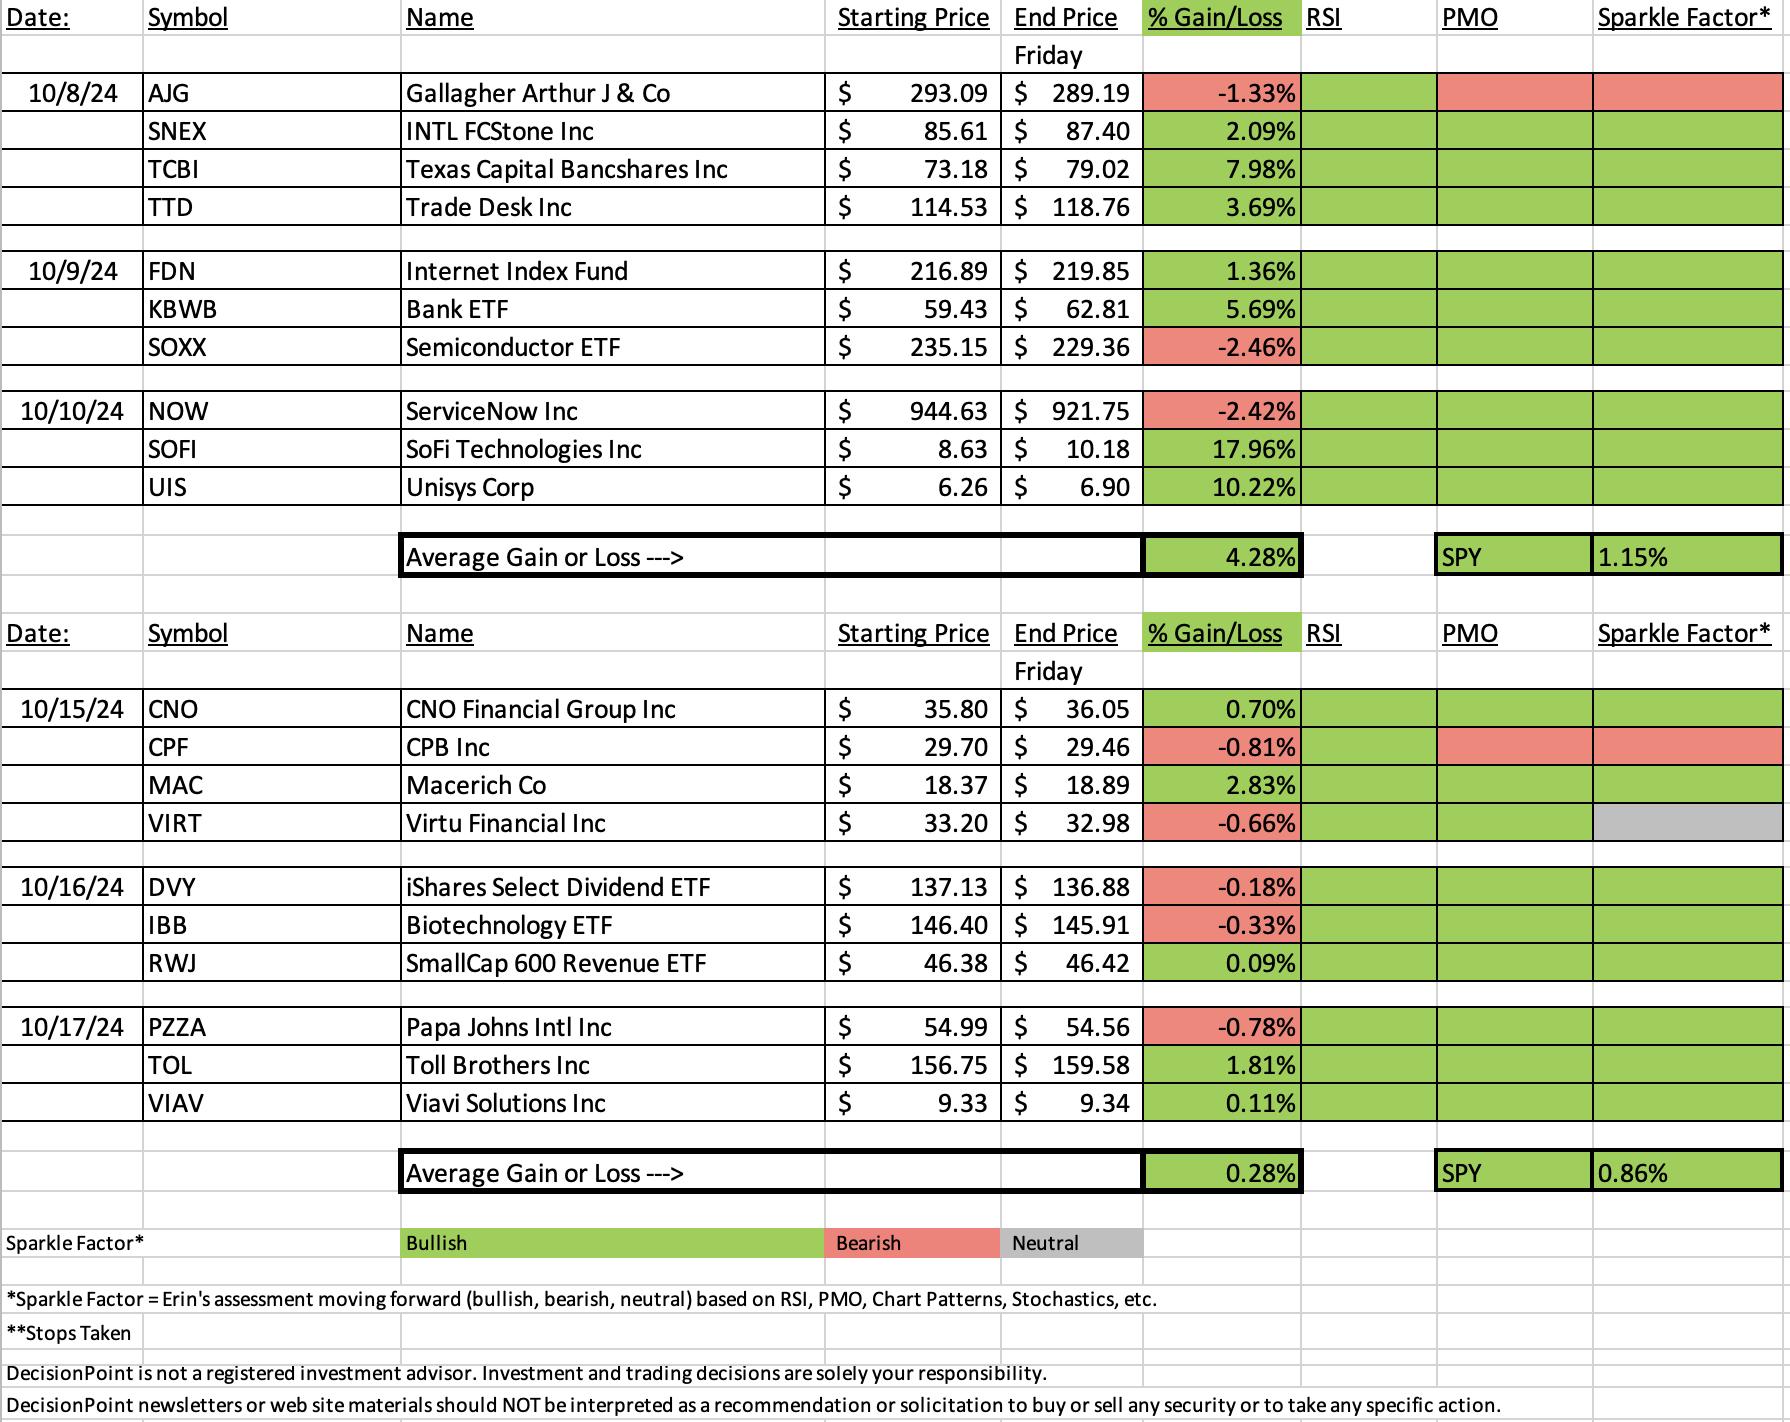
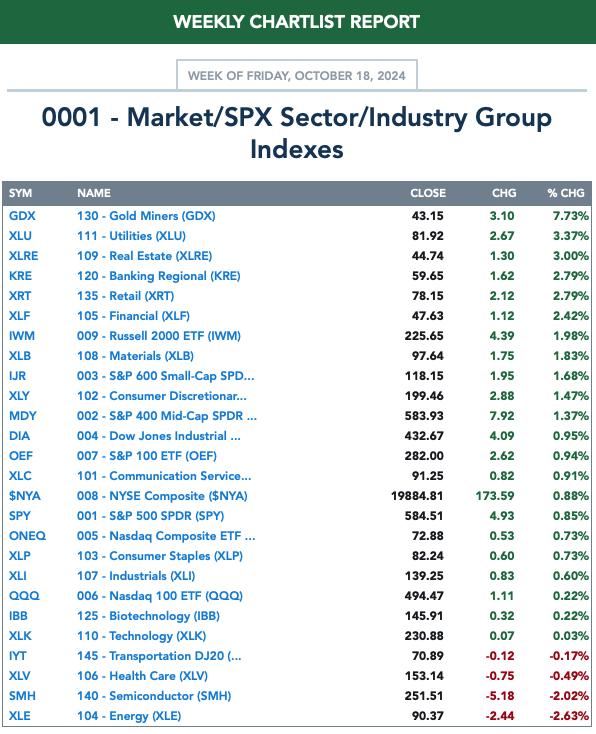
While this week wasn't as positive as last week, it was still a good week with a positive average finish of +0.28%. The SPY averaged higher than this, but we did have two "Diamonds in the Rough" outperform the SPY since being picked.
This week the Sector to Watch was fairly easy to come up with. Materials (XLB) broke out and had a new PMO Crossover BUY Signal. Close in the running was Industrials (XLI) and Utilities (XLU). Real Estate (XLRE) and Consumer Discretionary (XLY) look very interesting as they reverse higher.
The Industry Group to Watch was Steel. We have some very good looking charts in this area: USAP, CLF, STLD, CMC, NUE, X and RS. Plenty to choose from! Take a look at the charts; just copy and paste them into a ChartList if you're a StockCharts member.
This week's "Darling" was Macerich Co (MAC) which was up +2.83% since being picked on Tuesday. The chart is set up well as you'll see.
This week's "Dud" was CPB Inc (CPF) which was down -0.81% since being picked on Tuesday. The chart has definitely gone south and looks like it will be a Dud in the future as well.
I ran the Diamond PMO Scan and Momentum Sleepers Scan at the end of the trading room to find some interesting finds real-time. They did produce some interesting results. Take a look at these charts: RH, CBRE, WELL, ES and CCEP.
Have a great weekend! I'll see you in Monday's trading room. Don't forget, you can send in symbols all week long for Reader Request Day on Thursday.
Good Luck & Good Trading,
Erin

Diamond Mine Trading Room:
RECORDING & DOWNLOAD LINK (10/18/2024):
Topic: DecisionPoint Diamond Mine (10/18/2024) LIVE Trading Room
Recording & Download Link
Passcode: October#18
REGISTRATION for 10/25/2024:
When: October 25, 2024 09:00 AM Pacific Time (US and Canada)
Topic: DecisionPoint Diamond Mine LIVE Trading Room
Register in advance for this webinar HERE
After registering, you will receive a confirmation email containing information about joining the webinar.

Below is the latest free DecisionPoint Trading Room recording from 10/14. You'll find these recordings posted on Mondays to our DP YouTube Channel. Be sure and subscribe HERE.
A few items about the spreadsheet: I've put on the spreadsheet whether the RSI is positive (green) or negative (red). The PMO column tells you if it is rising (green) or falling (red). Finally I've added my own "Sparkle Factor" that gives you my assessment going forward, bullish (green), bearish (red) or neutral (gray). The Sparkle Factor is basically my thoughts on whether I expect it to rise or fall. A neutral means it could really go either way so it could be added to a watch list. If you're in a stock I consider "neutral" going forward, the ball is in your court.
Darling:
Macerich Co. (MAC)
EARNINGS: 2024-11-06 (BMO)
Macerich Co. operates as a real estate investment trust, which engages in the acquisition, ownership, development, redevelopment, management, and leasing of regional and community shopping centers located throughout the United States. The company was founded by Mace Siegel Dana K. Anderson, Arthur M. Coppola and Edward C. Coppola in 1964 and is headquartered in Santa Monica, CA.
Predefined Scans Triggered: Elder Bar Turned Green, Moved Above Upper Price Channel, P&F Double Top Breakout, P&F Triple Top Breakout, New 52-week Highs and Shooting Star.
Below are the commentary and chart from Tuesday, 10/15:
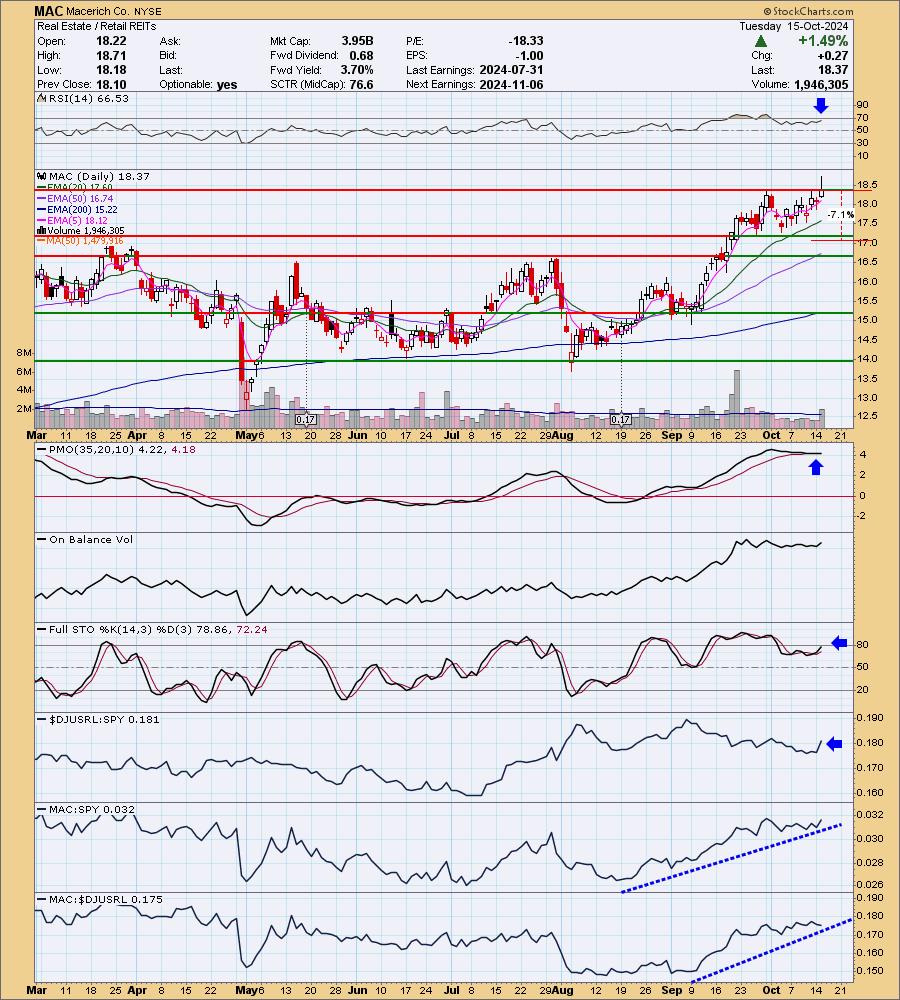
"MAC is up +1.63% in after hours trading. It is a bearish shooting star candlestick today, but based on after hours trading, I don't think we will see a decline tomorrow. I liked the breakout to 52-week highs coming out of a congestion zone that digested the prior rally. The RSI is not overbought so it has upside potential. The PMO looks toppy, but it has actually surged above the signal line. It is well above zero suggesting pure strength. Stochastics turned back up in positive territory and are nearing 80. The group is just starting to outperform right now. Considering this group hasn't been so great, MAC has been a clear outperformer. Imagine if this group gets going what is likely to happen to MAC. The stop is set beneath support at 7.1% or $17.06."
Here is today's chart:
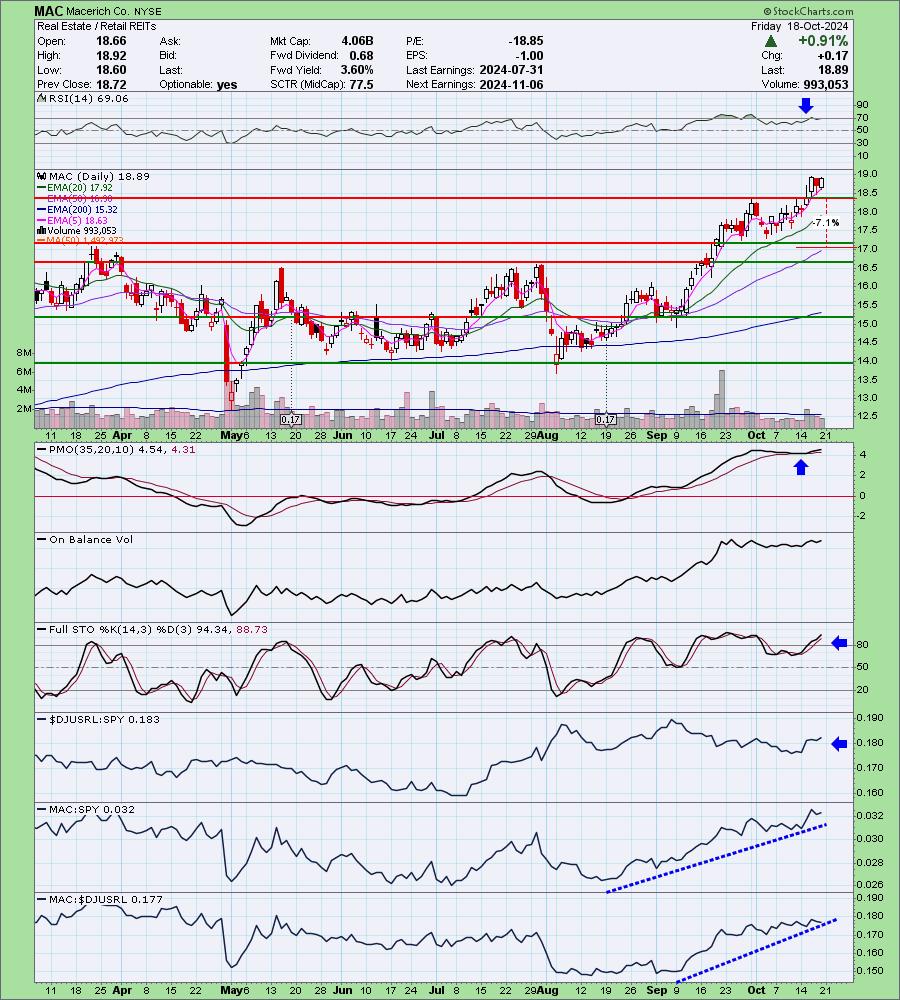
We didn't have the breakout quite yet when it was picked. Since then it did break out, had a day of consolidation and then formed a bullish engulfing candlestick today. The RSI is trying to get overbought, but so far it is not so this could be an entry point. The PMO is continuing higher and Stochastics have popped above 80. I like this one moving forward.
Don't forget, on Thursdays I look at reader-requested symbols, so shoot me an email at erin@decisionpoint.com. I read every email I receive and try to answer them all!
Dud:
CPB, Inc. (CPF)
EARNINGS: 2024-10-30 (BMO)
Central Pacific Financial Corp. is a bank holding company, which engages in the provision of commercial banking services through its wholly owned subsidiary Central Pacific Bank. The firm offers wealth management, personal and business banking. It also provides loan services for commercial and industrial, real estate, and consumer. The company was founded on February 1, 1982 and is headquartered in Honolulu, HI.
Predefined Scans Triggered: Moved Above Upper Bollinger Band, Moved Above Upper Price Channel, P&F Double Top Breakout and New 52-week Highs.
Below are the commentary and chart from Tuesday, 10/15:
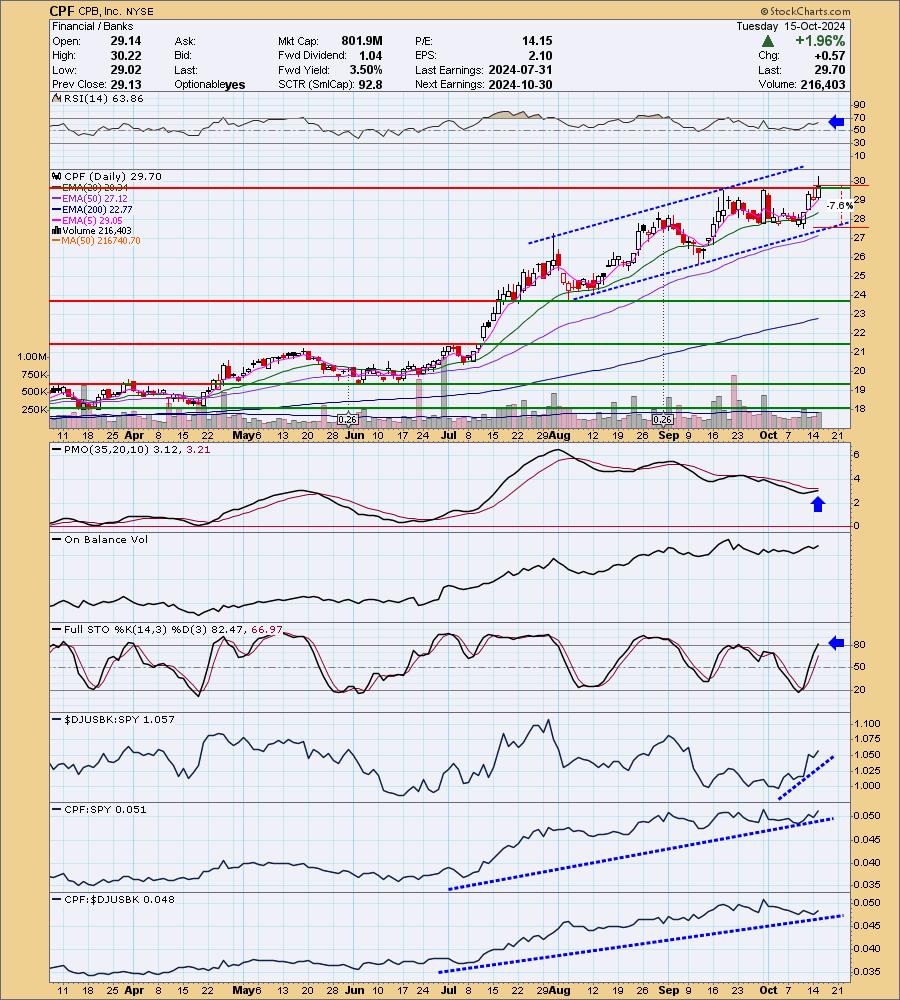
"CPF is down -0.07% in after hours trading. The breakout to new 52-week highs was great. Price is currently in a rising trend channel and it has some time before it will hit the top of the channel. The RSI is not overbought and the PMO is nearing a Crossover BUY Signal well above the zero line. Stochastics just poked above 80. The group is taking off as we all know and it is expressed well by the relative strength line. CPF has been an overall leader within the group over time and is outperforming the SPY right now. The stop is set at support at 7.6% or $27.44."
Here is today's chart:
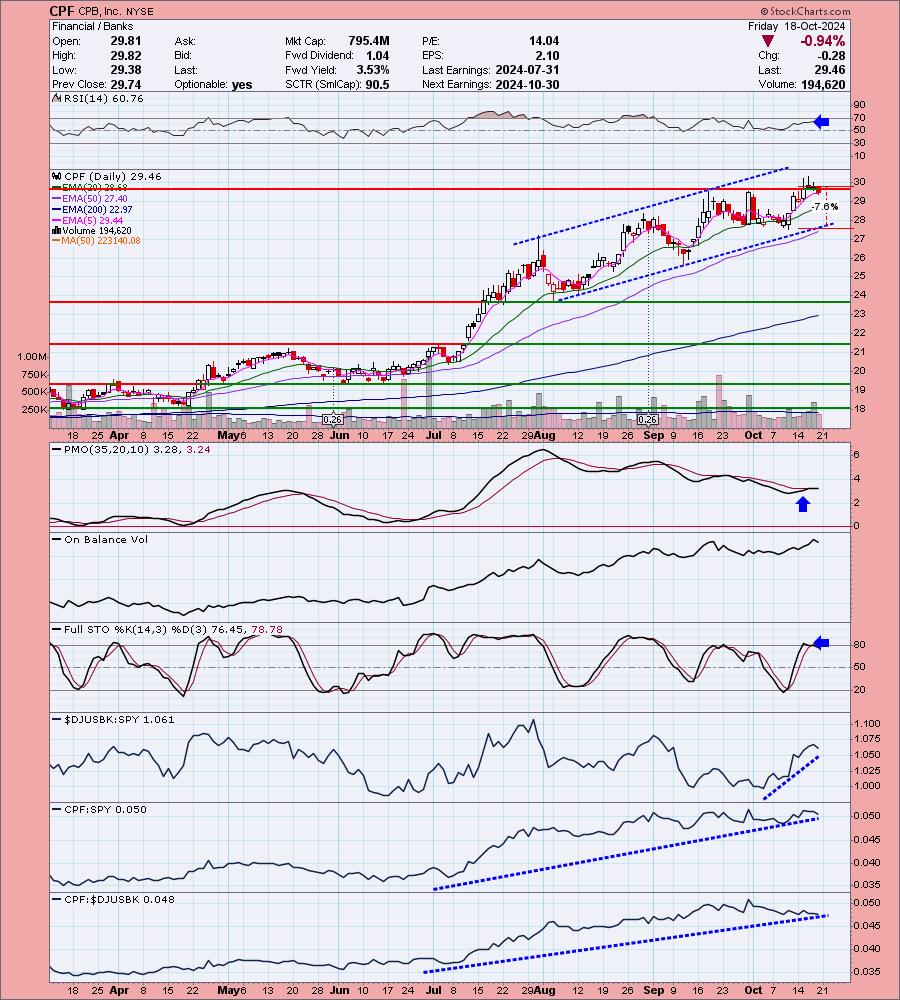
This doesn't look good anymore. Price looks like it is ready to test the bottom of the rising trend channel. It failed to test the top of the channel and that is bearish. The PMO has turned down. I can't see an immediate reason why this one failed. Maybe the fact that the last top didn't make it to the top of the channel was part of the issue. In any case, I don't think this one is worth holding.
THIS WEEK's Performance:
DecisionPoint Market Scoreboard (Mechanical Trend Model Signals):
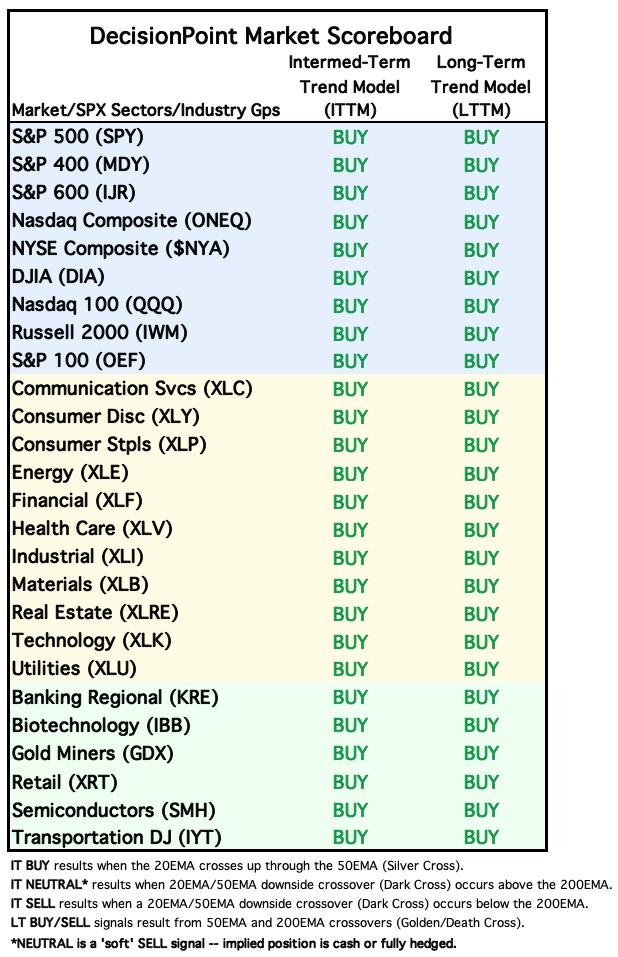
Friday signal changes are outlined in purple.
Click Here to view Carl's annotated "Under the Hood" ChartList!
Sector to Watch: Materials (XLB)
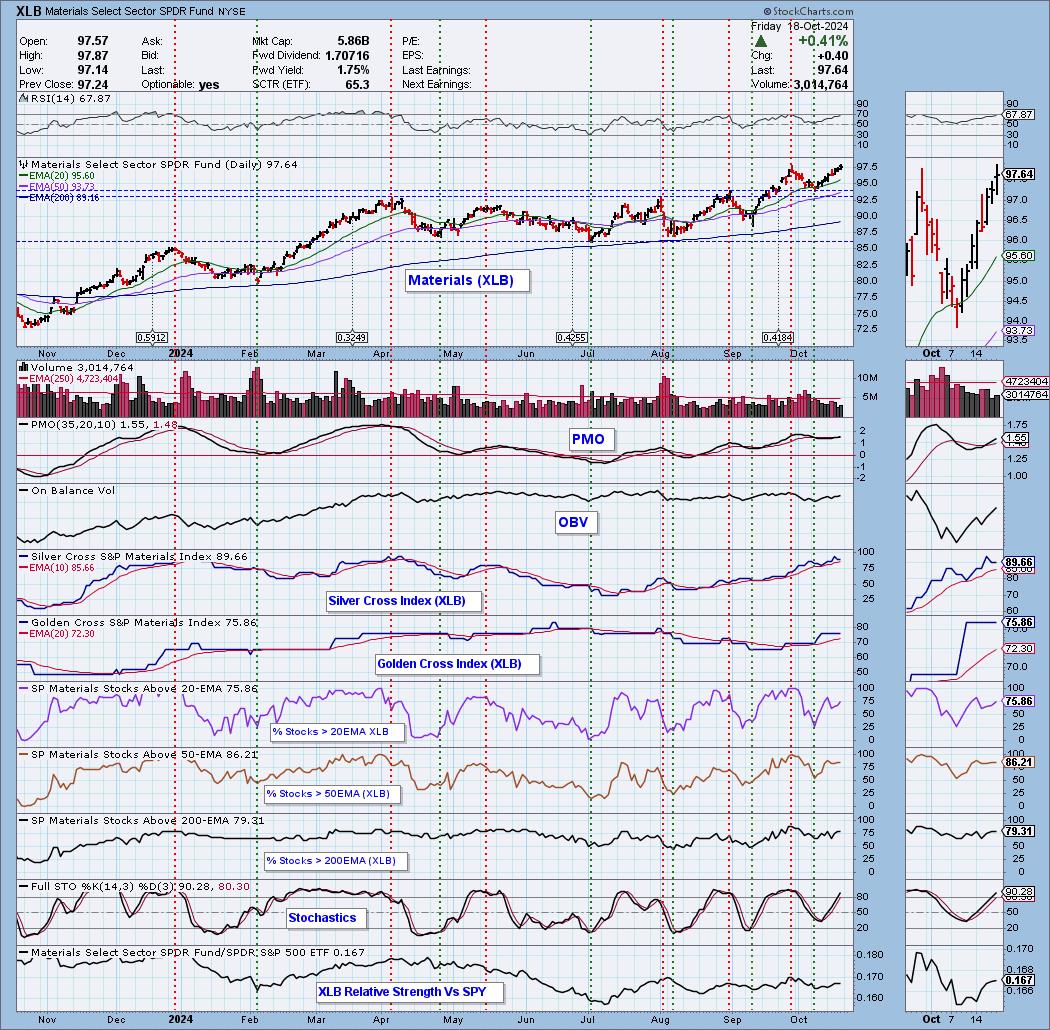
XLB had a small breakout today above the prior top. The RSI is positive and isn't overbought yet. The PMO has given us a positive Crossover BUY Signal above the zero line suggesting pure strength. The Silver Cross Index is at a healthy 90% and is above the signal line. The Golden Cross Index is above its signal line and is at a healthy 76%. Participation is expanding nicely and Stochastics are above 80 again. You can see that we are getting some outperformance right now as well. With Gold, Gold Miners and Metals & Mining going crazy right now, we should see some upside followthrough.
Industry Group to Watch: Steel ($DJUSST)
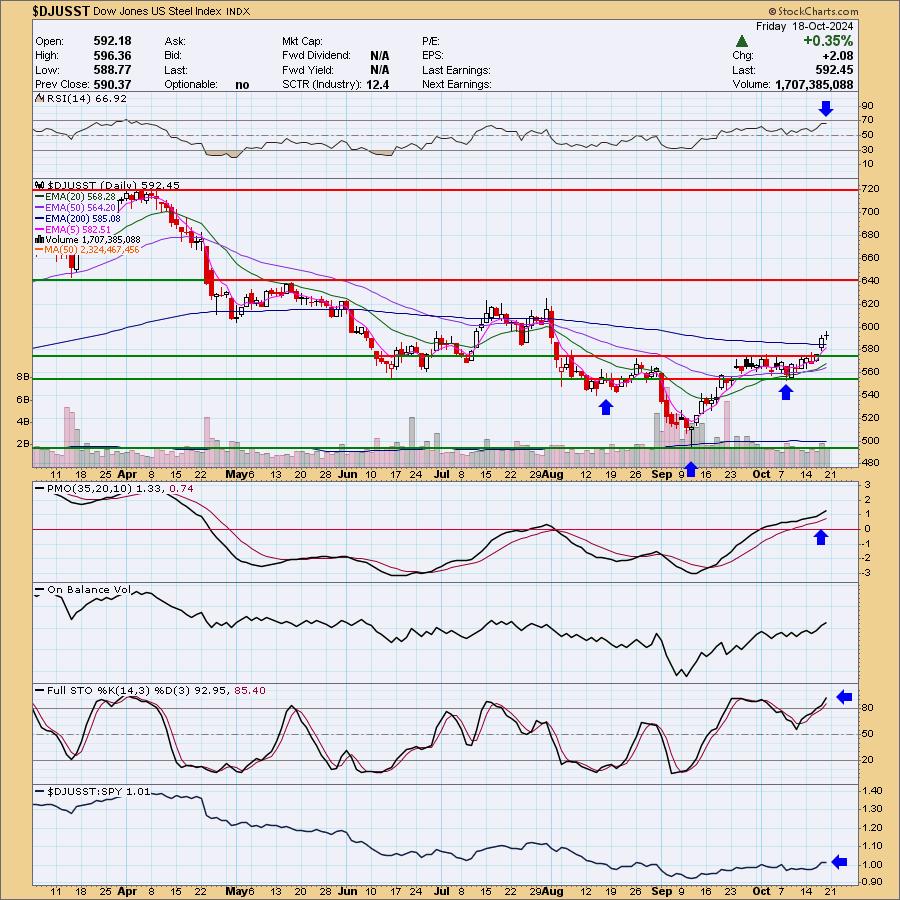
This is a group in the midst of a strong reversal. What sold me on the chart was the reverse head and shoulders and the breakout above the 200-day EMA. The RSI is not overbought and the PMO is accelerating higher. Stochastics are positive and we are seeing a little bit of outperformance right now. There were plenty of steel charts that looked good this morning: USAP, CLF, STLD, CMC, NUE, X and RS. (I own CLF).
Go to our Under the Hood ChartList on DecisionPoint.com to get an in-depth view of all the sectors. On StockCharts.com you can find the Industry Summary.
Good Luck & Good Trading!
- Erin
erin@decisionpoint.com
Full Disclosure: I'm 70% long, 0% short.
Watch the latest episode of the DecisionPoint Trading Room with Carl & Erin Swenlin HERE!
Technical Analysis is a windsock, not a crystal ball. --Carl Swenlin
NOTE: The stocks reported herein are from mechanical trading model scans that are based upon moving average relationships, momentum and volume. DecisionPoint analysis is then applied to get selections from the scans. The selections given should prompt readers to do a chart review using their own analysis process. This letter is not a call for a specific action to buy, sell or short any of the stocks provided. There are NO sure things or guaranteed returns on the selection of "diamonds in the rough."
Helpful DecisionPoint Links:
DecisionPoint Shared ChartList and DecisionPoint Chart Gallery
Price Momentum Oscillator (PMO)
Swenlin Trading Oscillators (STO-B and STO-V)
(c) Copyright 2024 DecisionPoint.com