
My spreadsheet is very close to blowing up and not allowing me to update it. I'll be recreating it soon, but want to give you the heads up that I'll only be including two weeks worth of data. "Diamonds in the Rough" are short-term picks and many times they fade away within the month. We wouldn't be holding most of those that turned mid-month so it seems better to not have polluted readings by including one month's worth of data. If anyone has a strong objection to this, please email and I will rethink this position.
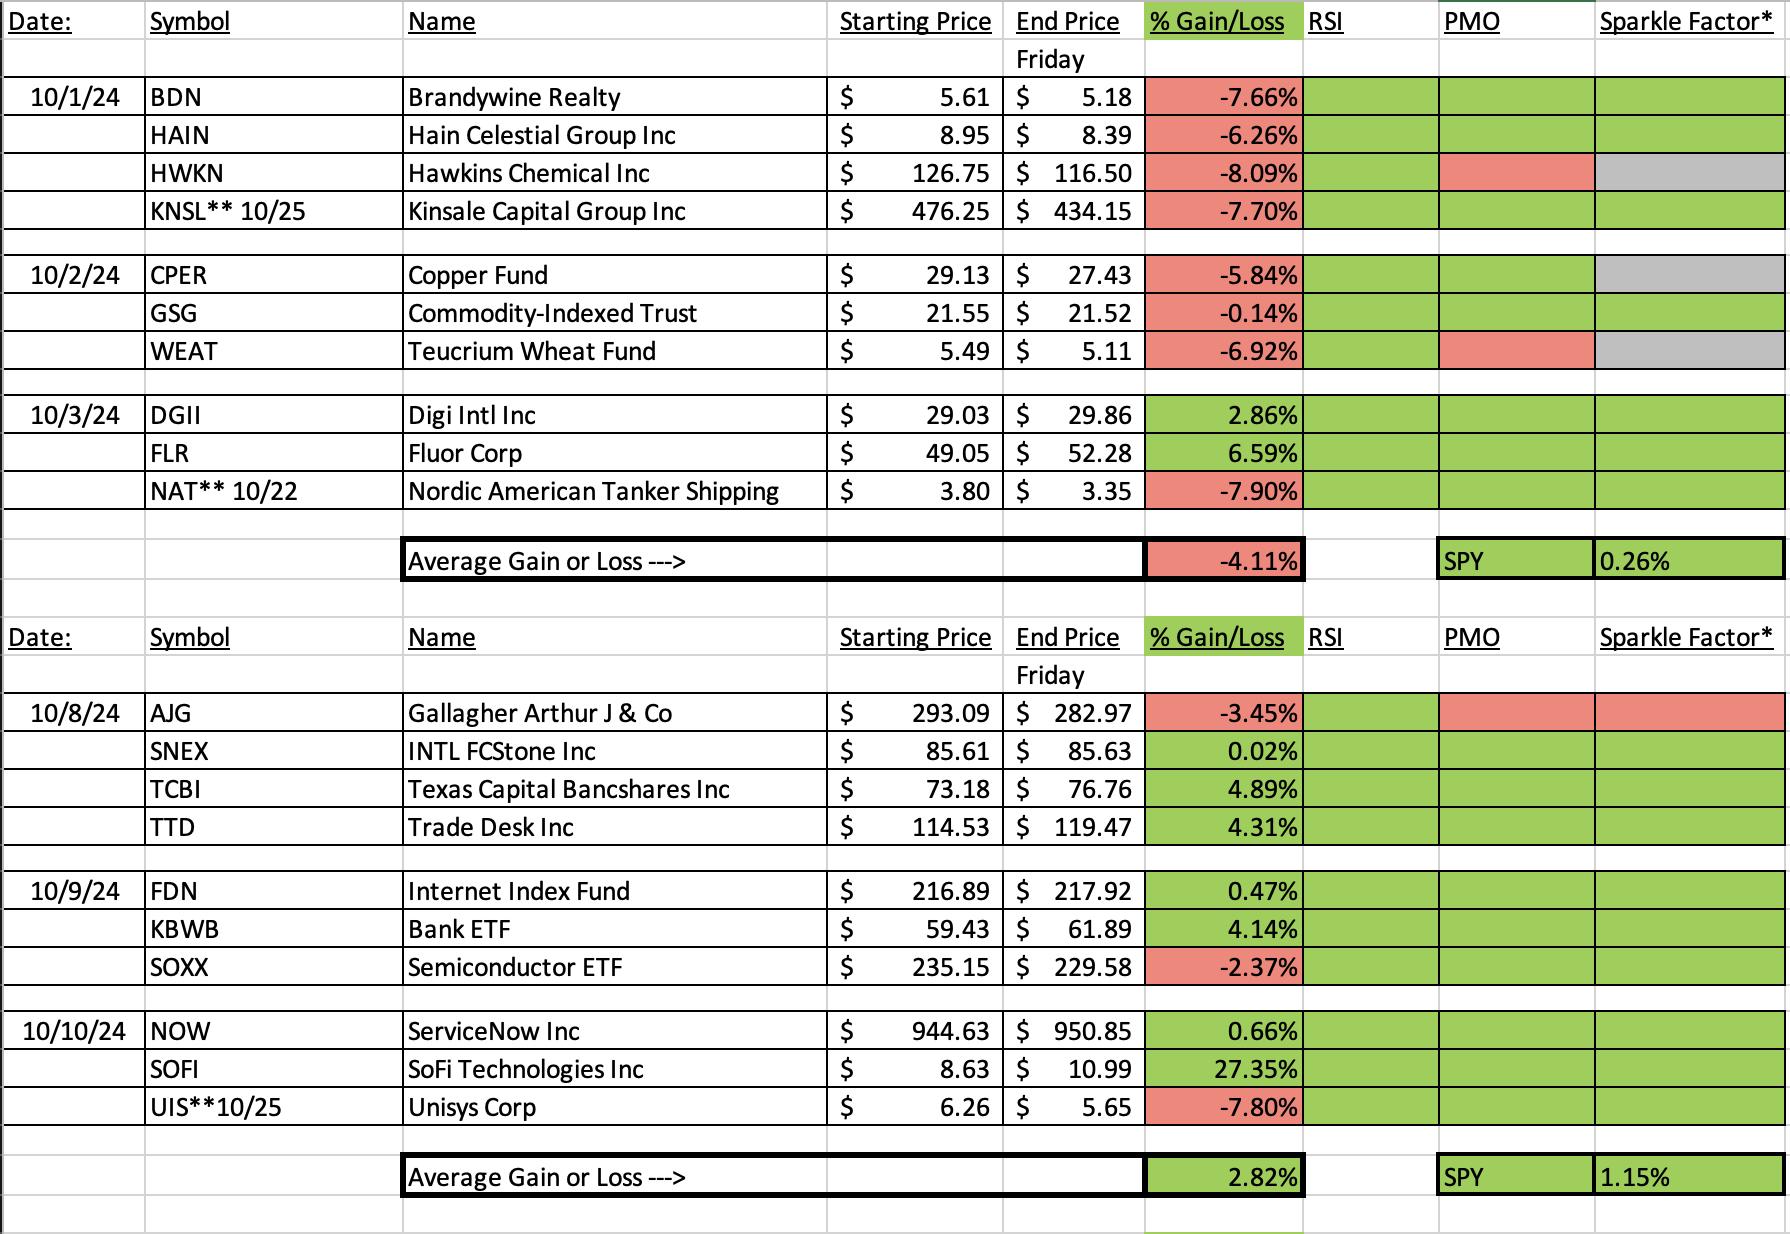
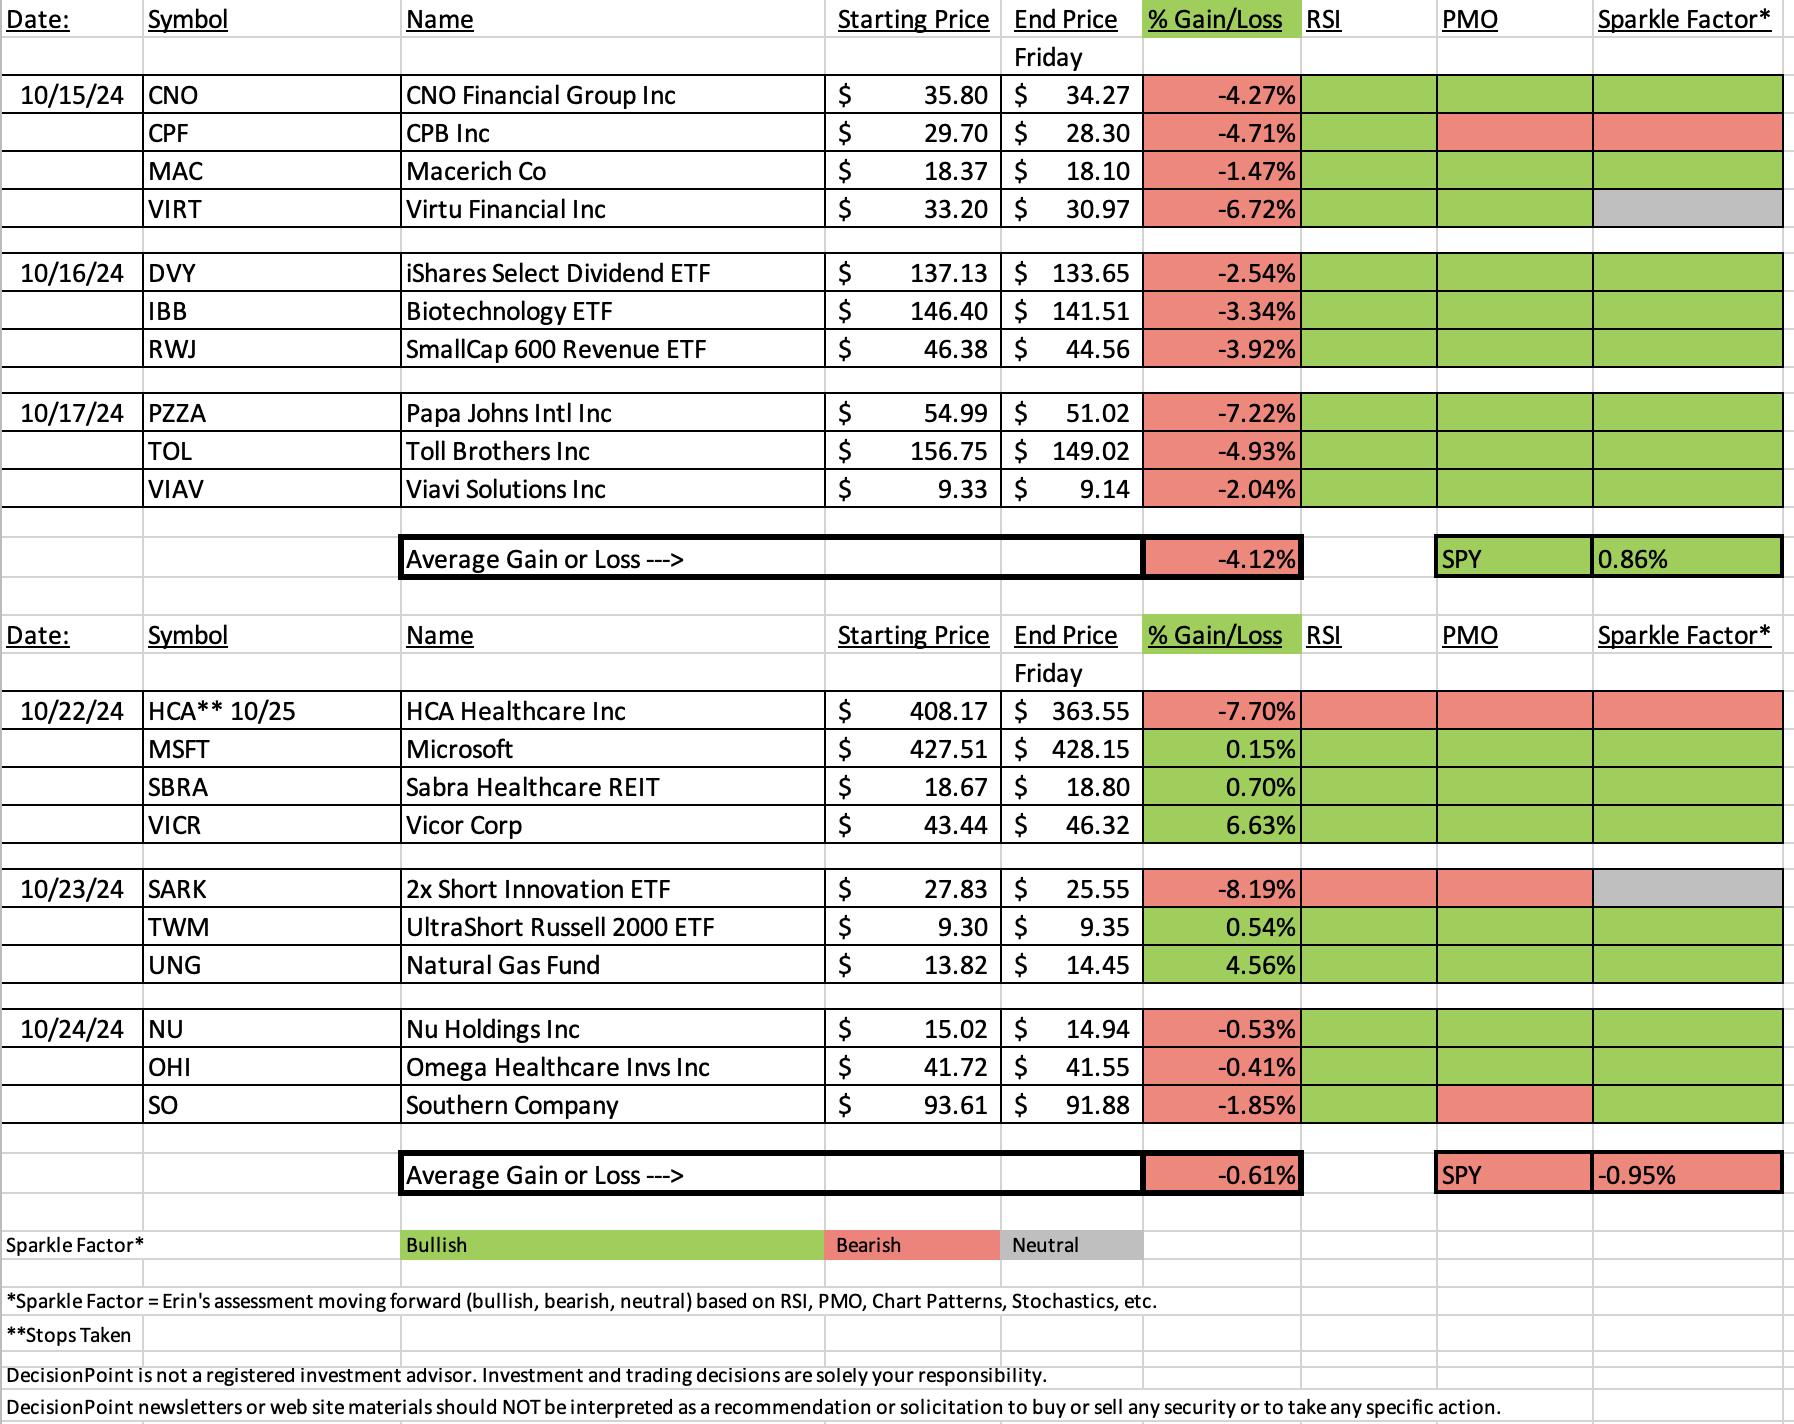
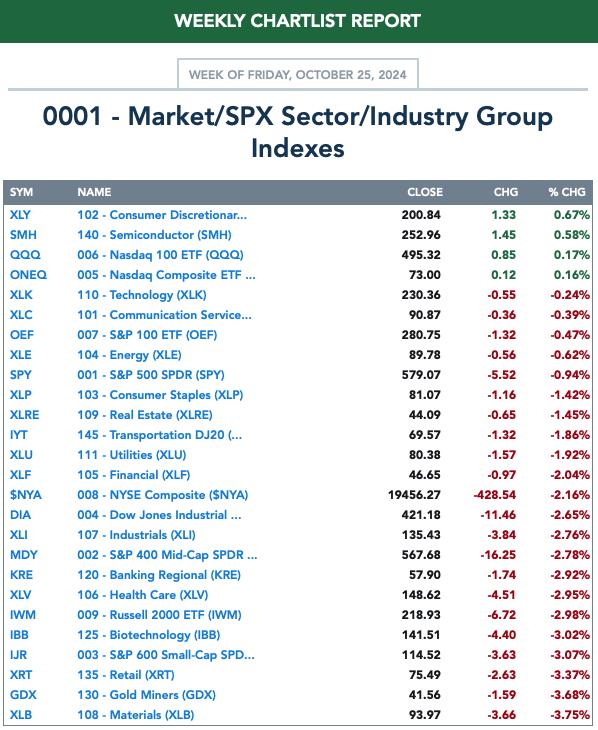
We had an okay week with five stocks/ETFs up and five down. The best I can say is that we did finish lower on average but not as low as the SPY. A big part of the problem the past few weeks is earnings. Some have surprised to the upside, but there have been those like this week's HCA that have hit stops quickly and poor earnings reception. I plan to be more proactive and not pick stocks that are going to report within two weeks. If they will report earlier I will be sure to remind you.
Last week was terrible. None of the stocks/ETFs are up. This is a function of the market decline we just experienced. The charts looked good and as far as I was concerned, all but two were still looking good last Friday. It just goes to show you, it is important to study the trend and condition of the market overall before investing.
This week's Darling was Vicor (VICR) which had an earnings surprise to the upside that pushed it higher very quickly. The Dud technically was the inverse of Innovation (SARK) but given it was a hedge, I won't cover it as the Dud. Instead I made the Dud HCA Healthcare (HCA) which had poor earnings reception and crashed on us.
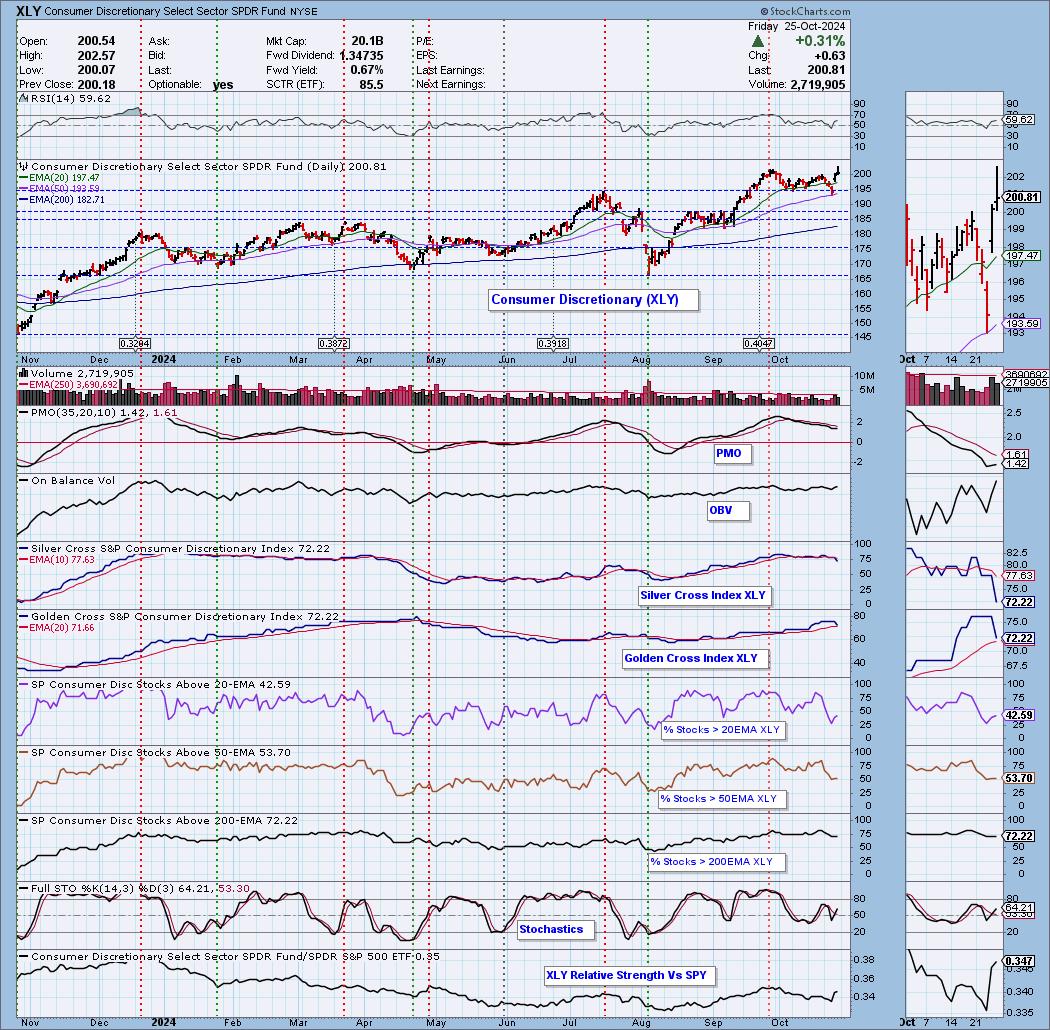
The Sector to Watch turned out to be Technology (XLK) which was showing a PMO Surge above the signal line. Since then XLK the PMO triggered a Crossover SELL Signal. I cannot pick a sector with a new PMO SELL Signal so I'm going to runner-up Consumer Discretionary (XLY) even though it is an aggressive sector. I was also looking at more defensive Real Estate (XLRE), but the PMO also turned down before the close today. XLY is the only sector with rising momentum currently. This is a big sign of weakness for the market in general so be careful out there.
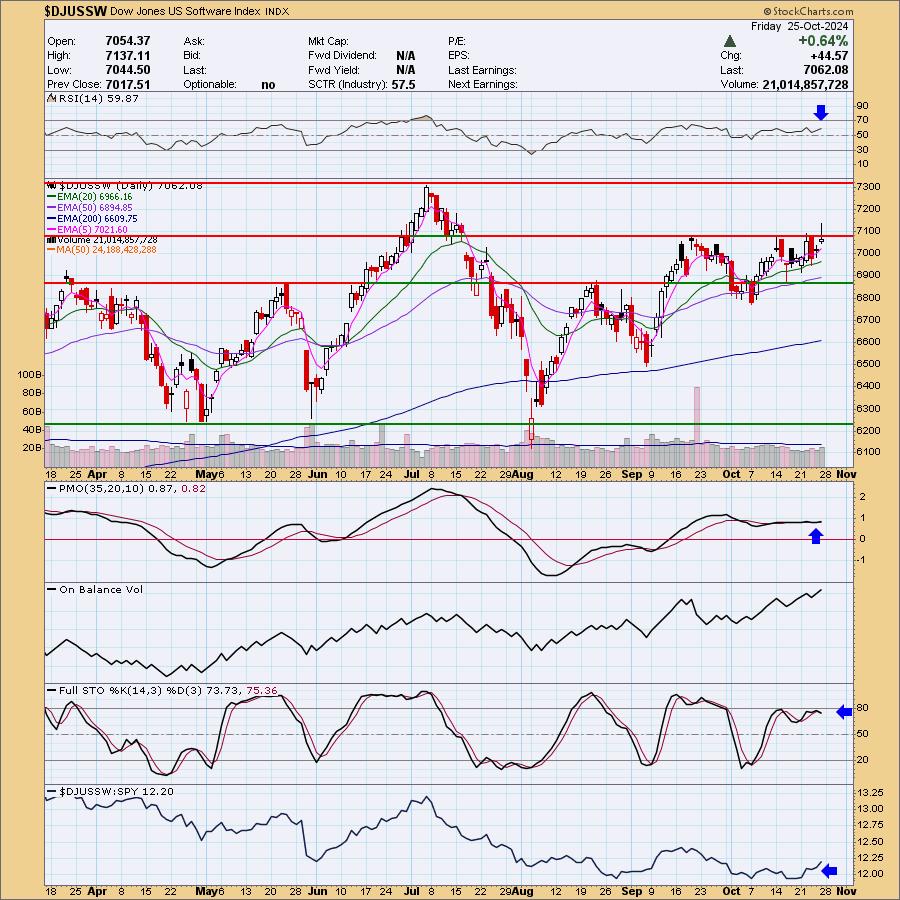
I'm going to leave the Industry Group to Watch is Software even though it is in Technology. The group still looks pretty healthy and I did find some interesting symbols to review from this area: NOW, SAP, OPRA, AUR and MNDY.
I ran two scans at the end of the trading room, Diamond PMO Scan and Momentum Sleepers Scan (I think I may've run the Surge Scan too). I found the following symbols of interest there: WMT, SW, CENX and GBCI.
Have a great weekend! I'll see you in the trading room Monday! If you have any subjects you'd like Carl and I to review, feel free to email me at erin@decisionpoint.com.
Good Luck & Good Trading,
Erin

Diamond Mine Trading Room:
RECORDING & DOWNLOAD LINK (10/25/2024):
Topic: DecisionPoint Diamond Mine (10/25/2024) LIVE Trading Room
Recording & Download Link
Passcode: October#25
REGISTRATION for 11/5/2024:
When: November 5, 2024 09:00 AM Pacific Time (US and Canada)
Topic: DecisionPoint Diamond Mine LIVE Trading Room
Register in advance for this webinar HERE
After registering, you will receive a confirmation email containing information about joining the webinar.

Below is the latest free DecisionPoint Trading Room recording from 10/21. You'll find these recordings posted on Mondays to our DP YouTube Channel. Be sure and subscribe HERE.
Don't miss today's DP Alert video!
A few items about the spreadsheet: I've put on the spreadsheet whether the RSI is positive (green) or negative (red). The PMO column tells you if it is rising (green) or falling (red). Finally I've added my own "Sparkle Factor" that gives you my assessment going forward, bullish (green), bearish (red) or neutral (gray). The Sparkle Factor is basically my thoughts on whether I expect it to rise or fall. A neutral means it could really go either way so it could be added to a watch list. If you're in a stock I consider "neutral" going forward, the ball is in your court.
Darling:
Vicor Corp. (VICR)
EARNINGS: 2024-10-22 (AMC)
Vicor Corp. engages in the design, development, manufacture, and marketing of modular power components. The firm provides complete power systems based upon a portfolio of patented technologies. Its products include AC-DC converters, power systems, and accessories. The company was founded by Patrizio Vinciarelli in 1981 and is headquartered in Andover, MA.
Predefined Scans Triggered: None.
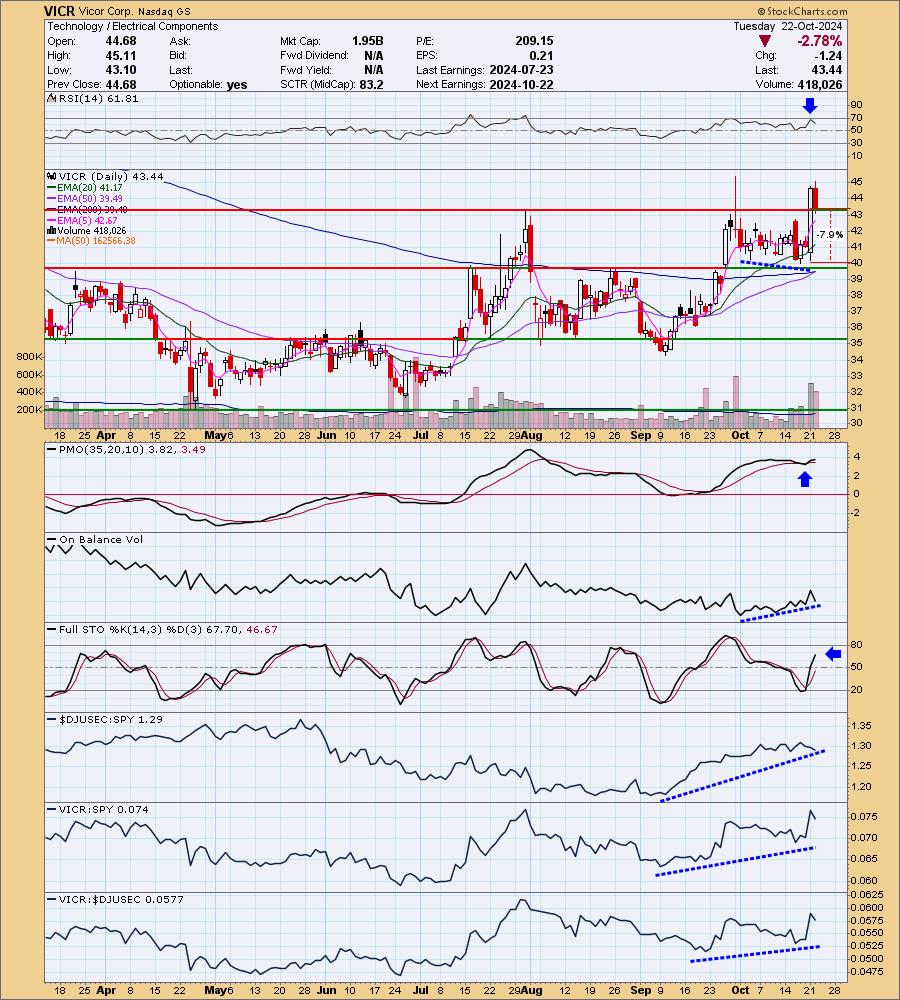
Below are the commentary and chart from Tuesday, 10/22:
"VICR is up +10.5% in after hours trading. We don't have to worry about earnings as they just reported today. Entry might be tough given it is up so much in after hours trading. I liked the strong breakout and mechanical pullback that often precedes lengthy rallies. The RSI is positive and not at all overbought due to today's decline. The PMO is rising after a whipsaw Crossover BUY Signal well above the zero line. Notice the OBV bottoms are rising while the prior price bottoms were falling. That is a positive divergence. Stochastics are rising strongly in positive territory. The group has been outperforming although it has cooled of late. I like the rising relative strength for VICR against the group and the SPY."
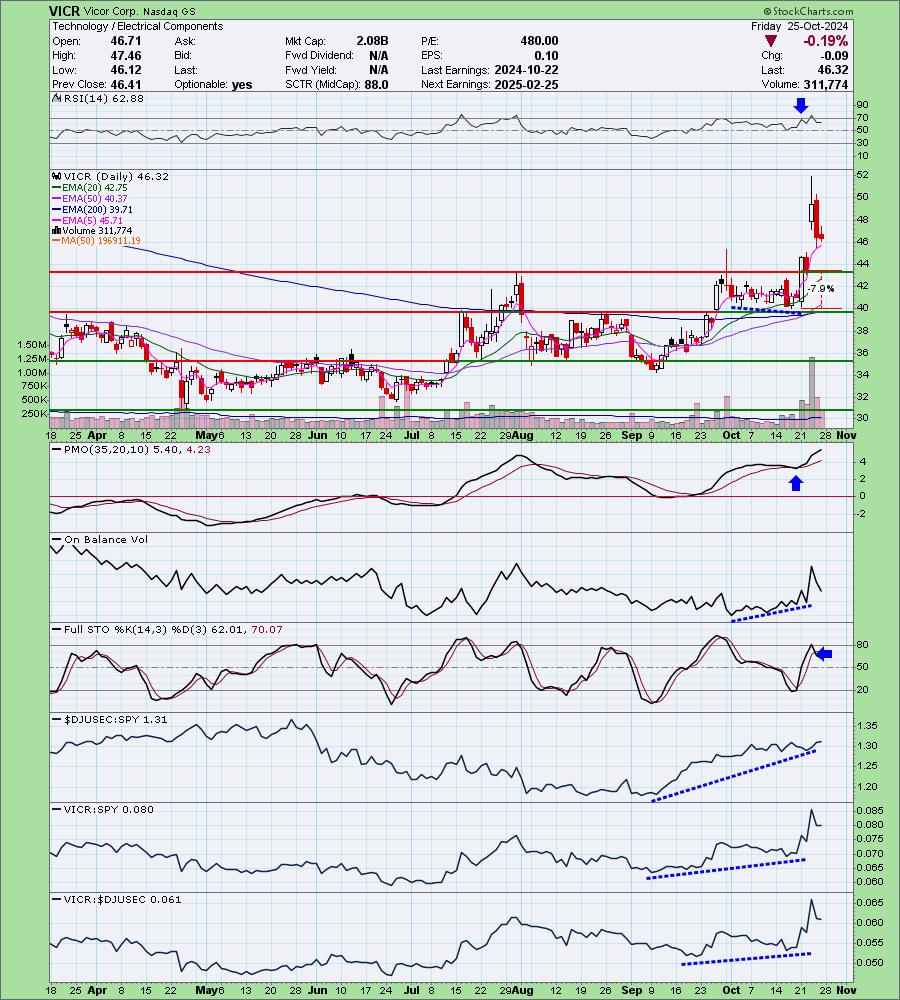
Here is today's chart:
We do see some profit taking after the big gap up on earnings. I think this is just fine, but we do have to be alert for a possible reverse island formation that would imply an upcoming gap down. The PMO and RSI look good, but I do note that Stochastics have topped. Not a surprise given the recent decline. I think this pullback offers an interesting entry, but stay tuned to the market's weakness.
Don't forget, on Thursdays I look at reader-requested symbols, so shoot me an email at erin@decisionpoint.com. I read every email I receive and try to answer them all!
Dud:
HCA Healthcare, Inc. (HCA)
EARNINGS: 2024-10-25 (BMO)
HCA Healthcare, Inc. is a health care services company engaged in operating hospitals, freestanding surgery centers and emergency care facilities, urgent care facilities, walk-in clinics, diagnostic and imaging centers, radiation and oncology therapy centers, comprehensive rehabilitation and physical therapy centers, physician practices, home health, hospice, outpatient physical therapy home and community-based services providers, and various other facilities. The firm operates general and acute care hospitals that offer medical and surgical services, including inpatient care, intensive care, cardiac care, diagnostic, and emergency services, and outpatient services, such as outpatient surgery, laboratory, radiology, respiratory therapy, cardiology, and physical therapy. The company was founded by Dr. Thomas F. Frist, Jr in 1968 and is headquartered in Nashville, TN.
Predefined Scans Triggered: Elder Bar Turned Blue and P&F Double Top Breakout.
Below are the commentary and chart from Tuesday, 10/22:
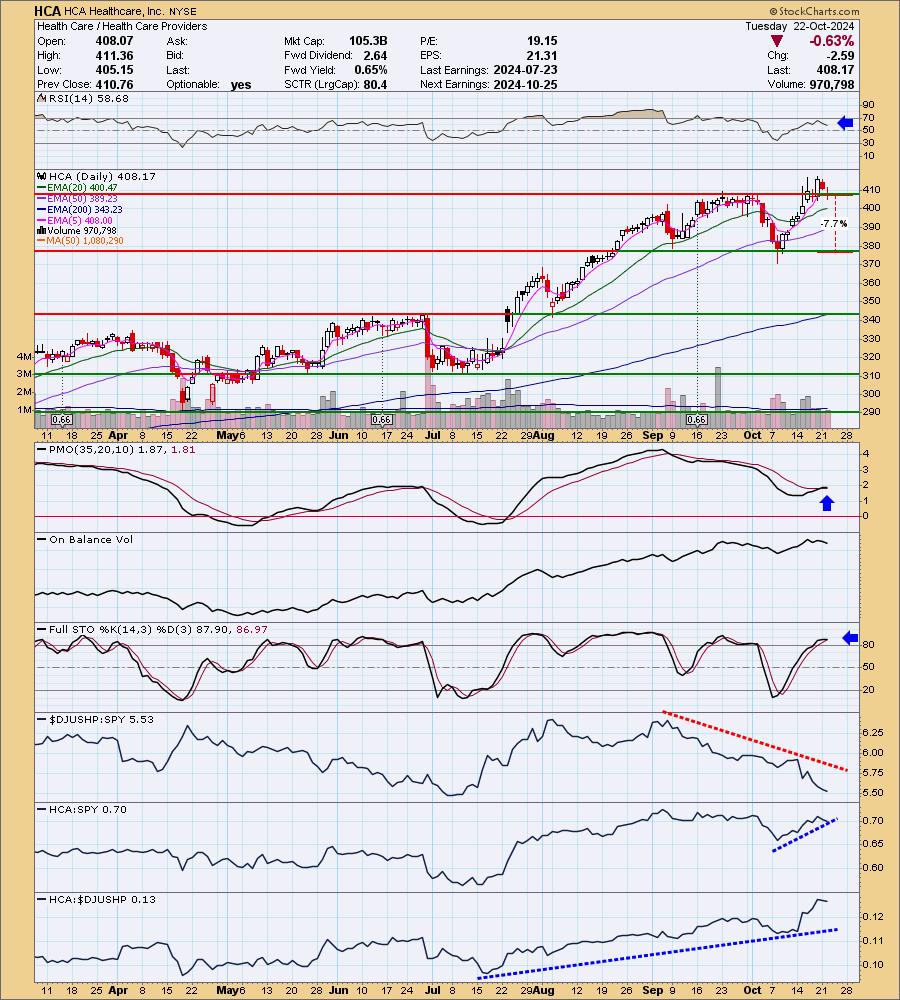
"HCA is unchanged in after hours trading. One of the things I liked about this chart was the breakout and then mechanical pullback to the breakout point. That usually leads into more upside. The small pullback hasn't damaged the indicators. The RSI is positive and not overbought and the PMO is still rising after a recent Crossover BUY Signal above the zero line. Stochastics are holding above 80 and haven't topped yet. I'm not thrilled with the Healthcare sector and I do not like that the group isn't performing right now. Normally I would've skipped this chart, but pickings were slim. I think that given it is outperforming the SPY and the group, we should see more upside here. I set the stop at support at 7.7% or $376.74."
Here is today's chart:
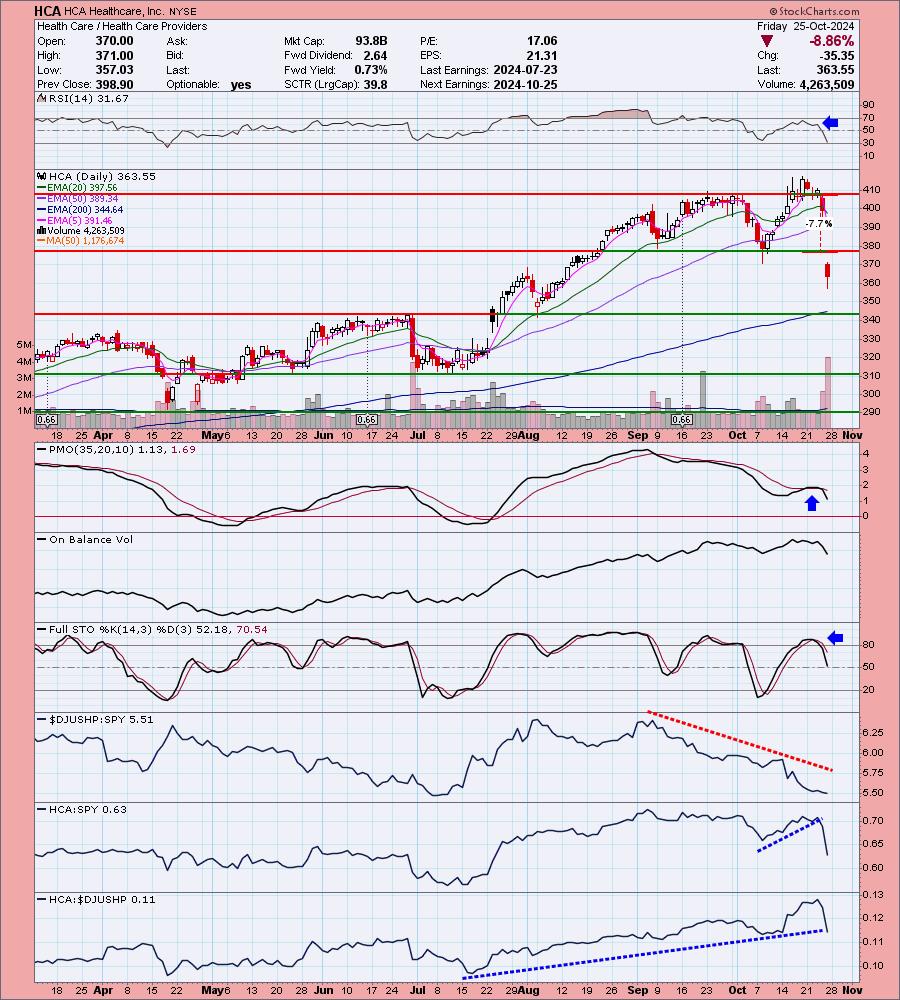
There were two reasons this chart went south. First was earnings which were clearly not well received, but we did have a notion things weren't going our way with the decline yesterday so there was some warning. The second problem is likely due to the poor performing sector and industry group which only proceeded to get worse since this was picked. However, primary problem was definitely earnings. I see no redeeming qualities on this chart currently.
THIS WEEK's Performance:
DecisionPoint Market Scoreboard (Mechanical Trend Model Signals):
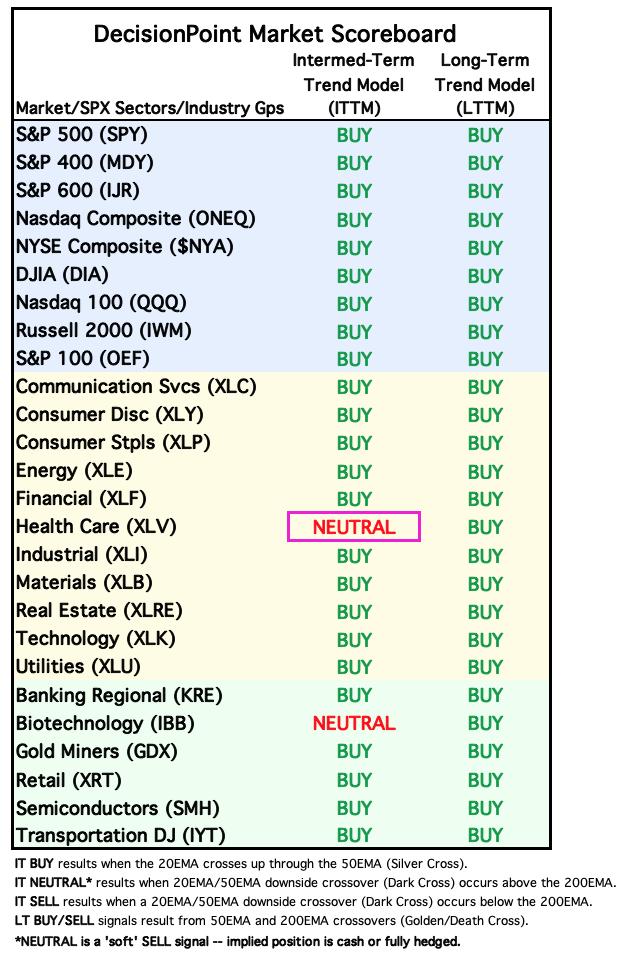
Friday signal changes are outlined in purple.
Click Here to view Carl's annotated "Under the Hood" ChartList!
Sector to Watch: Consumer Discretionary (XLY)
This not a great looking chart but as I mentioned in the opening, it is the only sector with rising momentum. I'm not sure how long this will last though. We have along wick on today's OHLC bar and that implies a bearish shooting star. The RSI is positive and Stochastics are rising. We also saw a little bit of expansion to participation, but ultimately we still have only 43% above their 20-day EMAs which is below our bullish 50% threshold. The Silver Cross Index and Golden Cross Index aren't looking healthy. More than likely this is a last gasp, but we have to go with the positive momentum for now.
Industry Group to Watch: Software ($DJUSSW)
We saw a tiny breakout today, but it did close below resistance to finish the day. It is hard to see without the thumbnail, but the PMO has surged (bottomed) above the signal line. Its flat appearance is a sign of strength in the current move higher. This is an aggressive area of the market so my confidence level is lower than it was this morning given the market's downside reversal today. I don't like the idea of expanding portfolios right now, but here are the symbols that did look bullish this morning: NOW, SAP, OPRA, AUR and MNDY.
Go to our Under the Hood ChartList on DecisionPoint.com to get an in-depth view of all the sectors. On StockCharts.com you can find the Industry Summary.
Good Luck & Good Trading!
- Erin
erin@decisionpoint.com
Full Disclosure: I'm 65% long, 0% short.
Watch the latest episode of the DecisionPoint Trading Room with Carl & Erin Swenlin HERE!
Technical Analysis is a windsock, not a crystal ball. --Carl Swenlin
NOTE: The stocks reported herein are from mechanical trading model scans that are based upon moving average relationships, momentum and volume. DecisionPoint analysis is then applied to get selections from the scans. The selections given should prompt readers to do a chart review using their own analysis process. This letter is not a call for a specific action to buy, sell or short any of the stocks provided. There are NO sure things or guaranteed returns on the selection of "diamonds in the rough."
Helpful DecisionPoint Links:
DecisionPoint Shared ChartList and DecisionPoint Chart Gallery
Price Momentum Oscillator (PMO)
Swenlin Trading Oscillators (STO-B and STO-V)
(c) Copyright 2024 DecisionPoint.com