
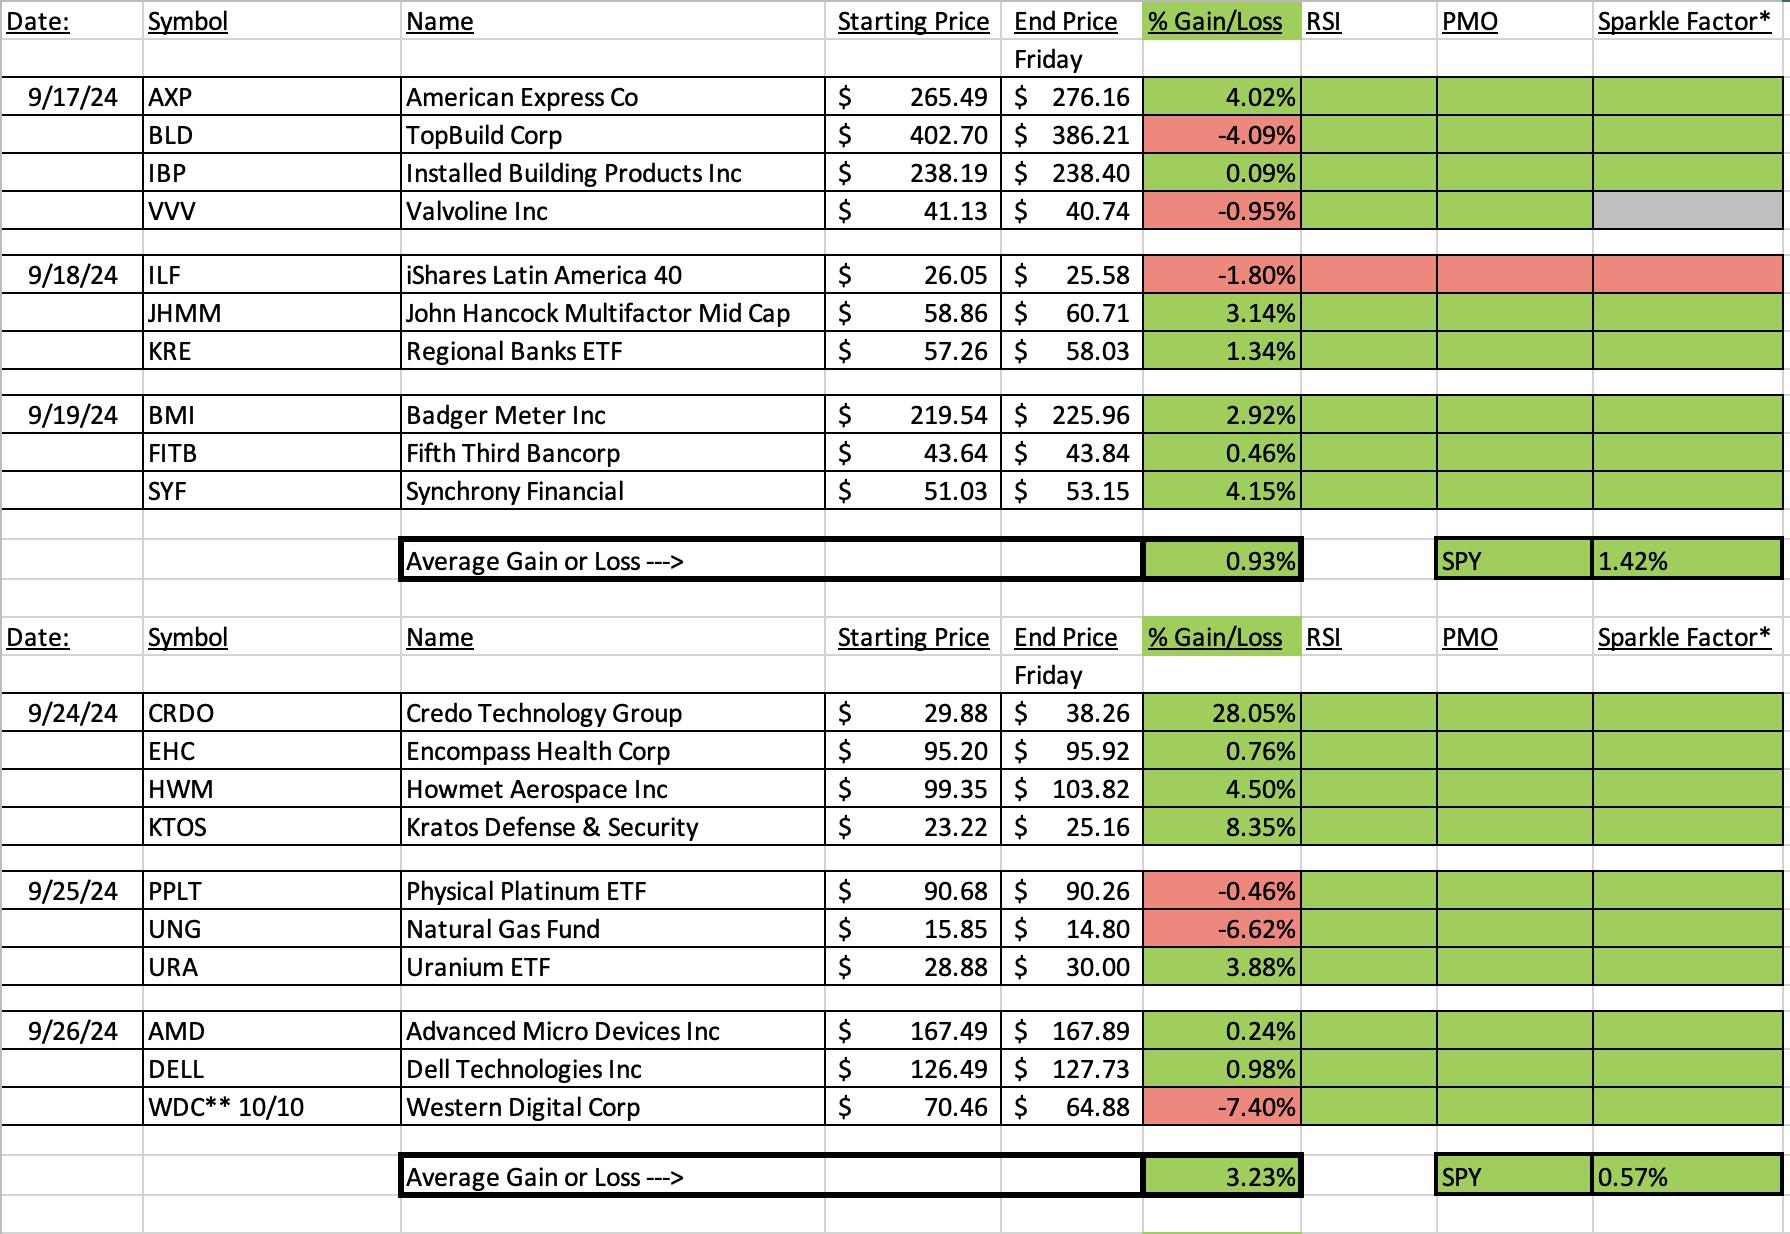
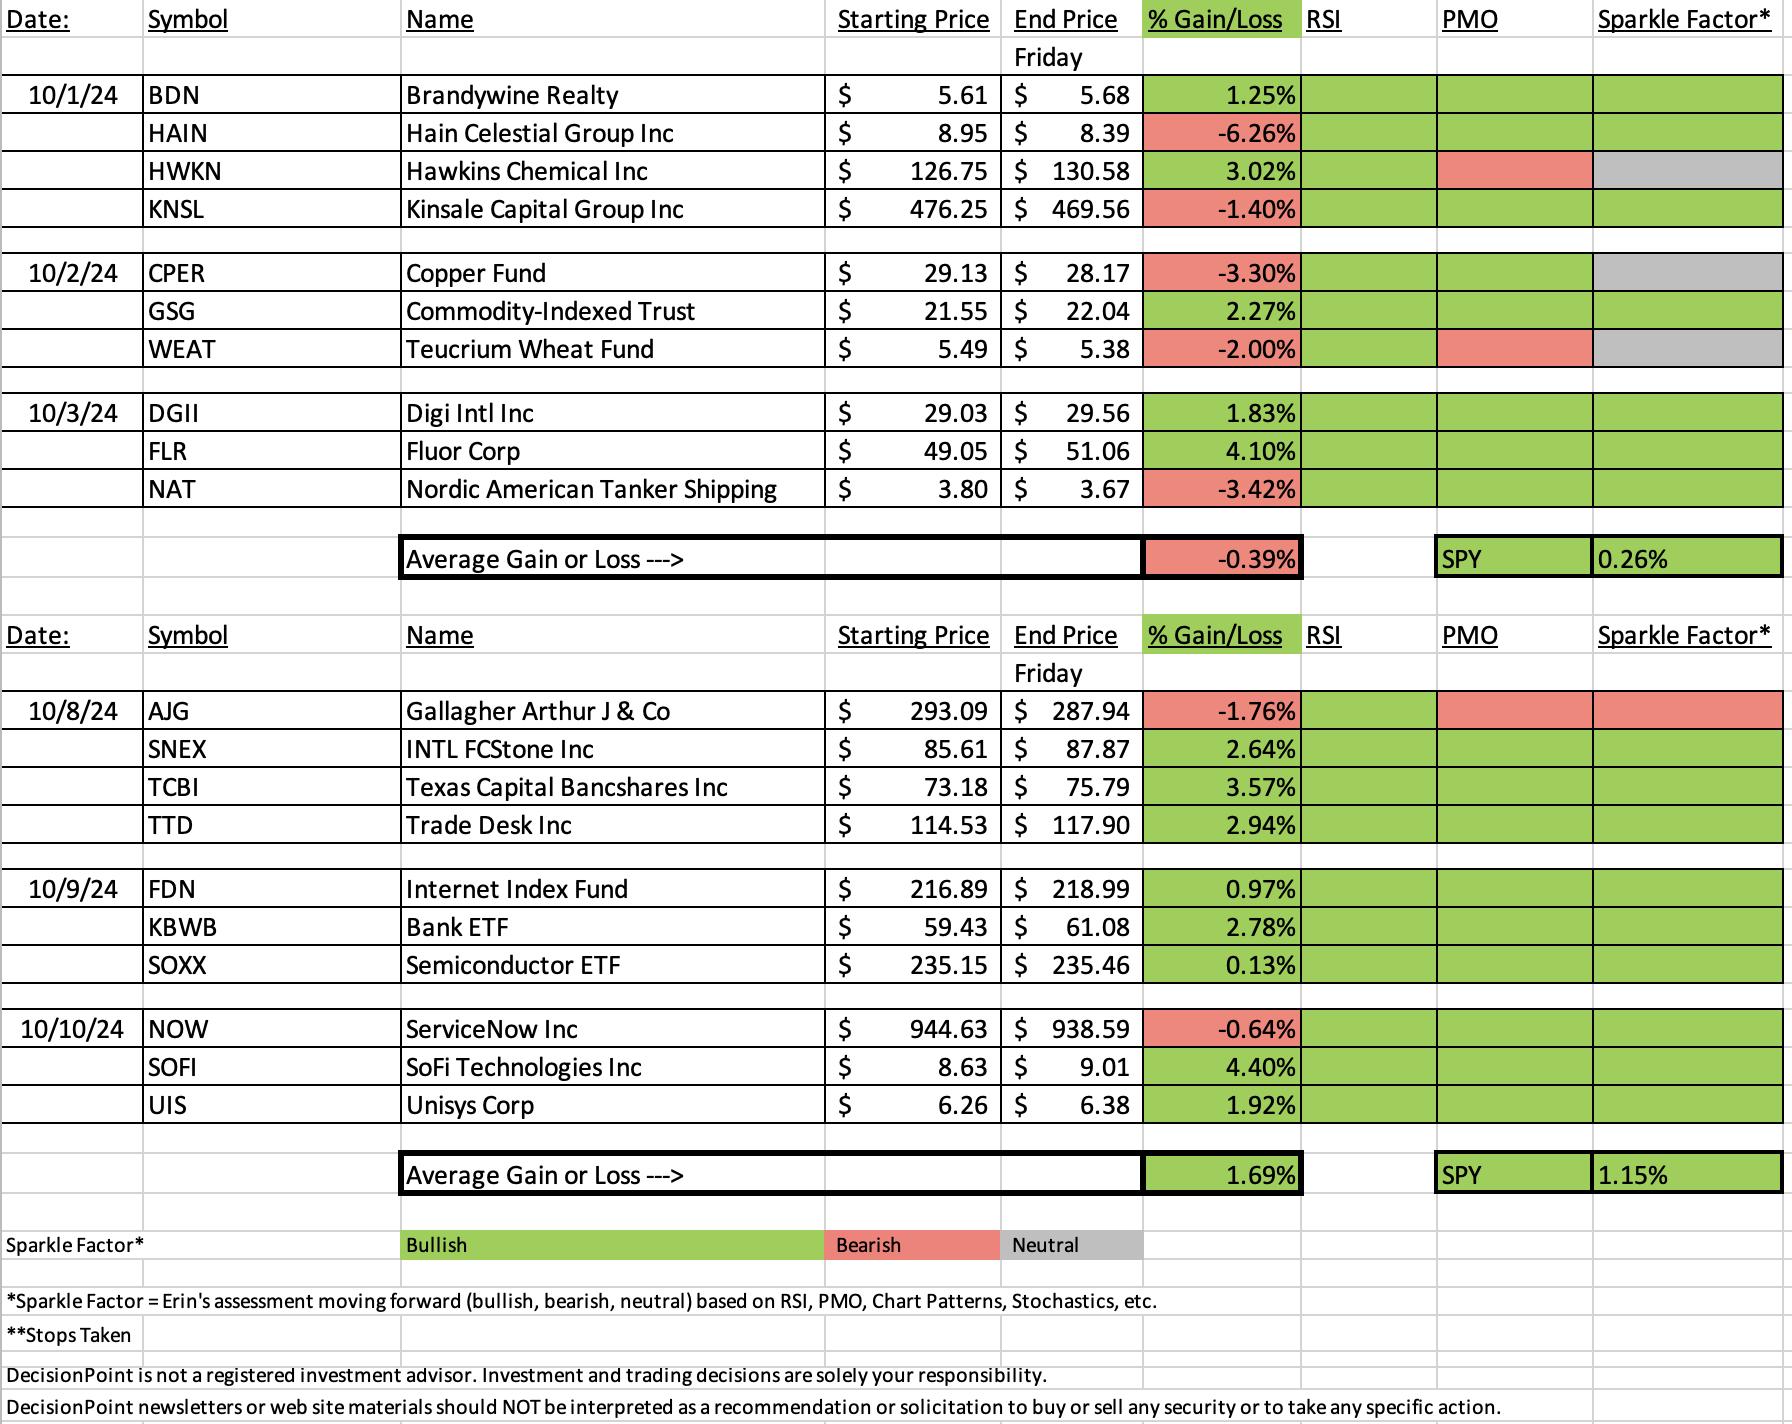
I am definitely happy with how Diamonds in the Rough performed this week. They averaged better than the SPY as they were up +1.69% and the SPY finished up +1.15%. We got help this week from Banks which surged today on good earnings from major banks that reported today. This could keep the market elevated.
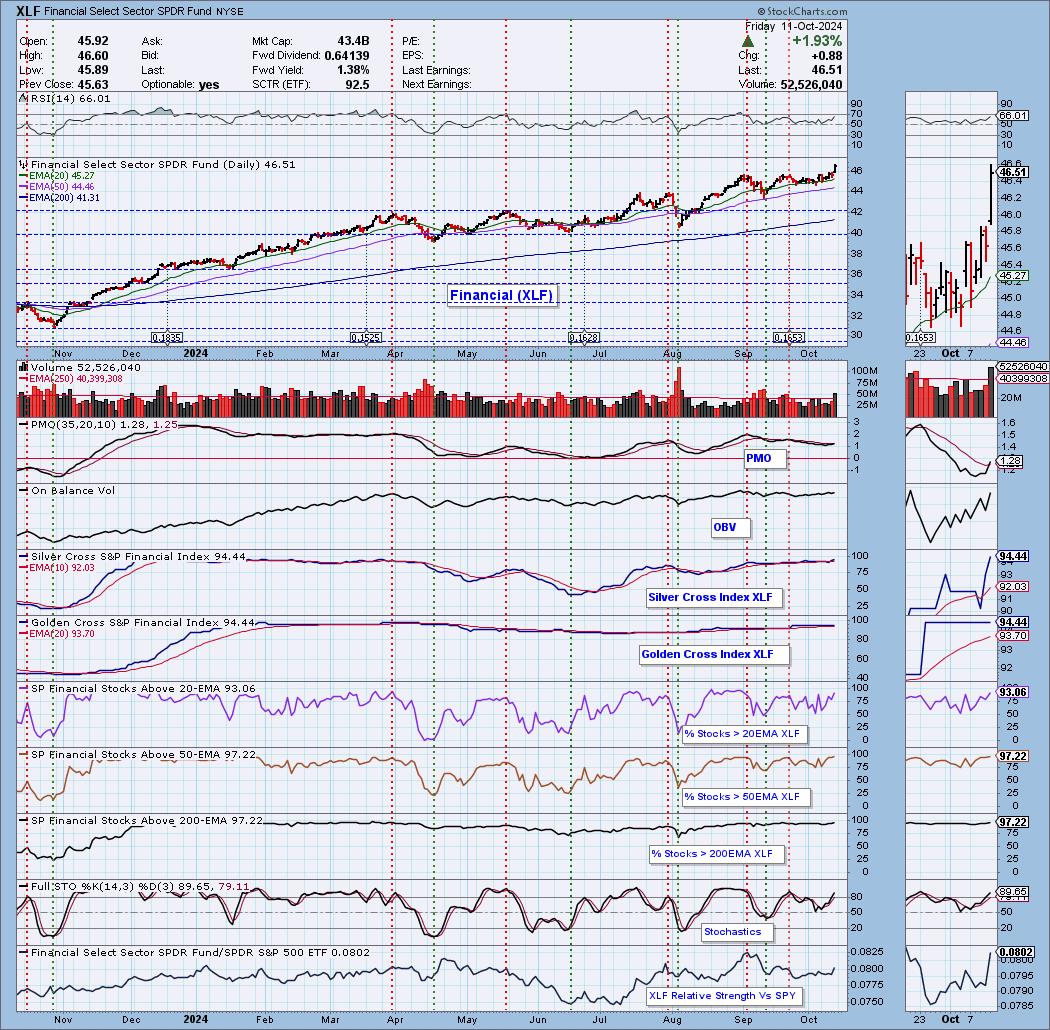
The Financial sector as a whole looks particularly good moving into next week which is why it was picked as the Sector to Watch this week. Technology was a close second and Industrials are looking very good right now too. I think we could have gone with any of them, but since we haven't picked Financials in awhile and they surged today, I decided to give it a try.
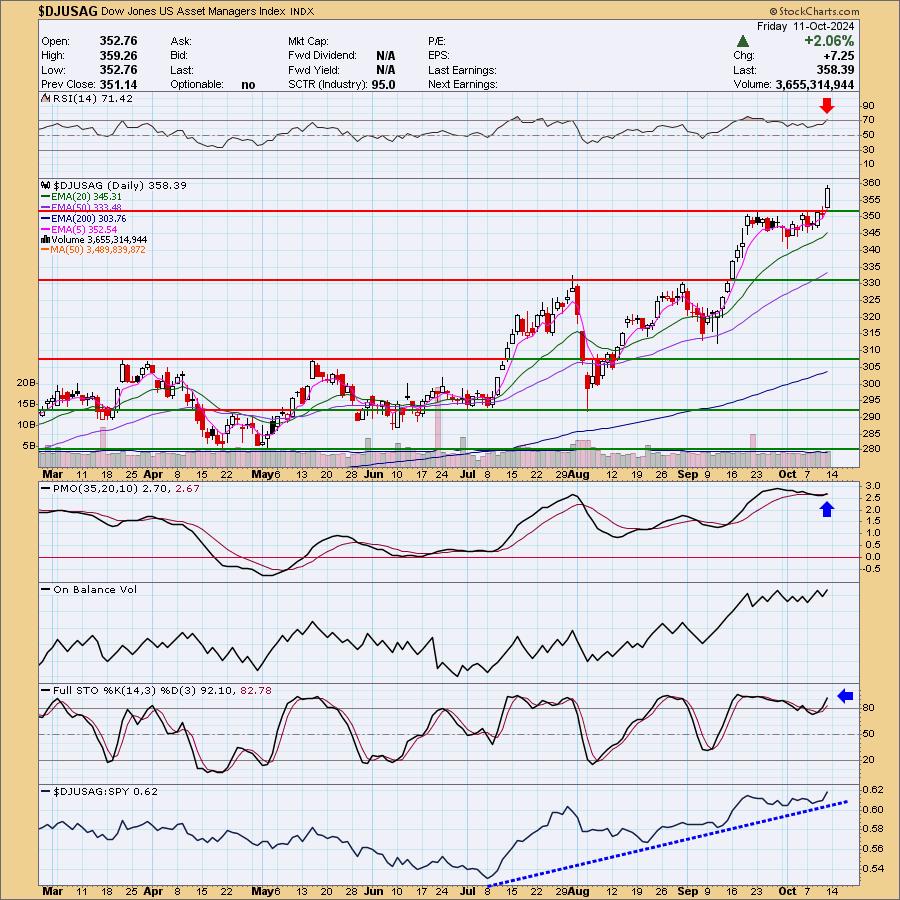
The Industry Group to Watch was Asset Managers. There were plenty of overbought charts within the group but we did find a few that look interesting going into next week: EVR, BAM, JHG and NEWT.
This week's Darling was SOFI which had a strong rally today with the Banks. We'll explore the chart further.
This week's Dud was Gallagher Arthur (AJG) which is in the Financial space. The chart has gone sour and you'll see what I mean when I go through it further down.
I ran three scans at the end of the program and was honestly unimpressed with the results. I did manage to find three of interest: CARG, TGNA and VRSN. I noticed that after today's close there were quite a few results from the scans today so Scan Alert System subscribers should have plenty to choose from.
Have a great weekend! I'll see you in Monday's trading room.
Good Luck & Good Trading,
Erin

Diamond Mine Trading Room:
RECORDING & DOWNLOAD LINK (10/11/2024):
Topic: DecisionPoint Diamond Mine (10/11/2024) LIVE Trading Room
Recording & Download Link
Passcode: October#11
REGISTRATION for 10/18/2024:
When: October 18, 2024 09:00 AM Pacific Time (US and Canada)
Topic: DecisionPoint Diamond Mine LIVE Trading Room
Register in advance for this webinar HERE
After registering, you will receive a confirmation email containing information about joining the webinar.

Below is the latest free DecisionPoint Trading Room recording from 10/7. You'll find these recordings posted on Mondays to our DP YouTube Channel. Be sure and subscribe HERE.
A few items about the spreadsheet: I've put on the spreadsheet whether the RSI is positive (green) or negative (red). The PMO column tells you if it is rising (green) or falling (red). Finally I've added my own "Sparkle Factor" that gives you my assessment going forward, bullish (green), bearish (red) or neutral (gray). The Sparkle Factor is basically my thoughts on whether I expect it to rise or fall. A neutral means it could really go either way so it could be added to a watch list. If you're in a stock I consider "neutral" going forward, the ball is in your court.
Darling:
SoFi Technologies, Inc. (SOFI)
EARNINGS: 2024-10-29 (BMO)
SoFi Technologies, Inc. is a financial service platform, which engages in the provision of student loan refinancing options to the private student loan market. It offers home loans, personal loans, and credit cards. It operates through the following segments: Lending, Technology Platform, and Financial Services. The Lending segment includes personal loan, student loan, home loan products, and related servicing activities. The Technology Platform segment focuses on technology products and solutions revenue. The Financial Services segment includes the SoFi Money product, SoFi Invest product, SoFi Credit Card product, SoFi Relay personal finance management product, and other financial services such as lead generation and content for other financial services institutions. The company was founded in 2011 and is headquartered in San Francisco, CA.
Predefined Scans Triggered: Stocks in a New Uptrend (ADX) and P&F Double Top Breakout.
Below are the commentary and chart from Thursday, 10/10:
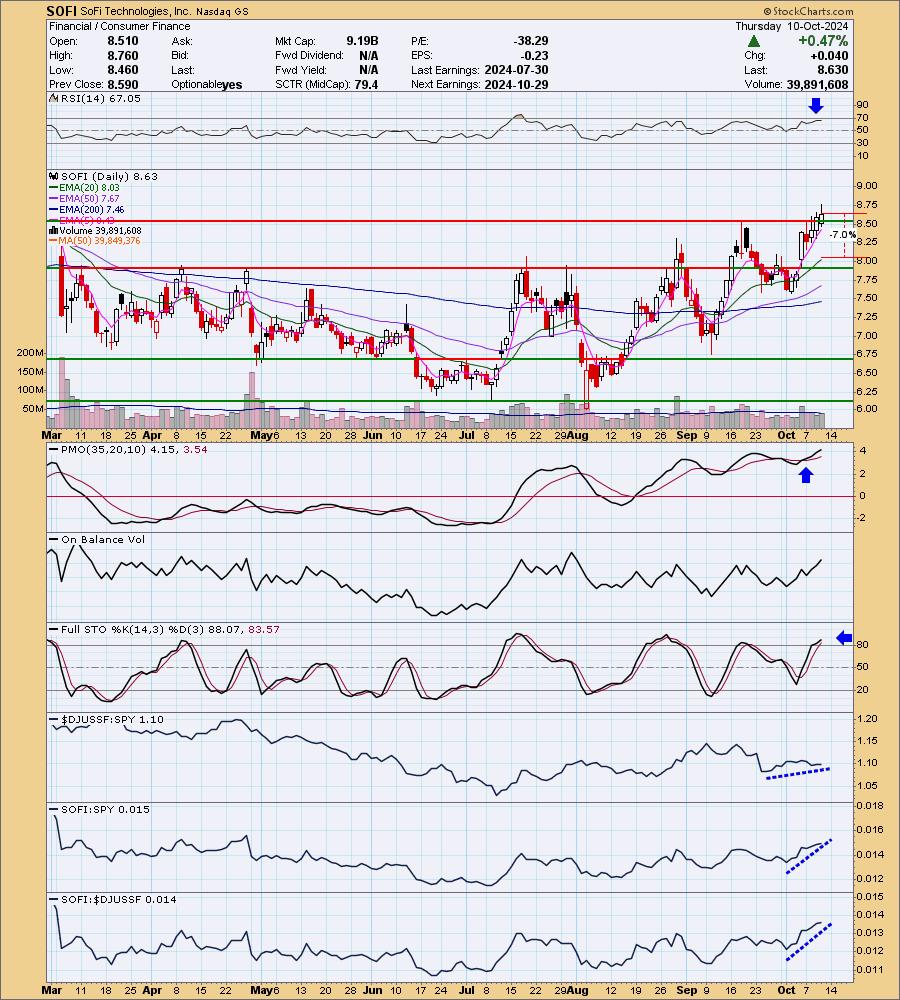
"SOFI is unchanged in after hours trading. I didn't annotate it, but we have a rounded bottom taking up the whole chart. We have a nice breakout above resistance. The RSI is not overbought yet and the PMO is rising on a Crossover BUY Signal well above the signal line. We also have rising bottoms on the PMO. Stochastics are above 80. Relative strength is slowly picking up for the Consumer Finance group. SOFI is definitely showing leadership within the group and consequently it is outperforming the SPY by a mile. We don't have to set too deep a stop. I've set it around the 20-day EMA at 7% or $8.02."
Here is today's chart:
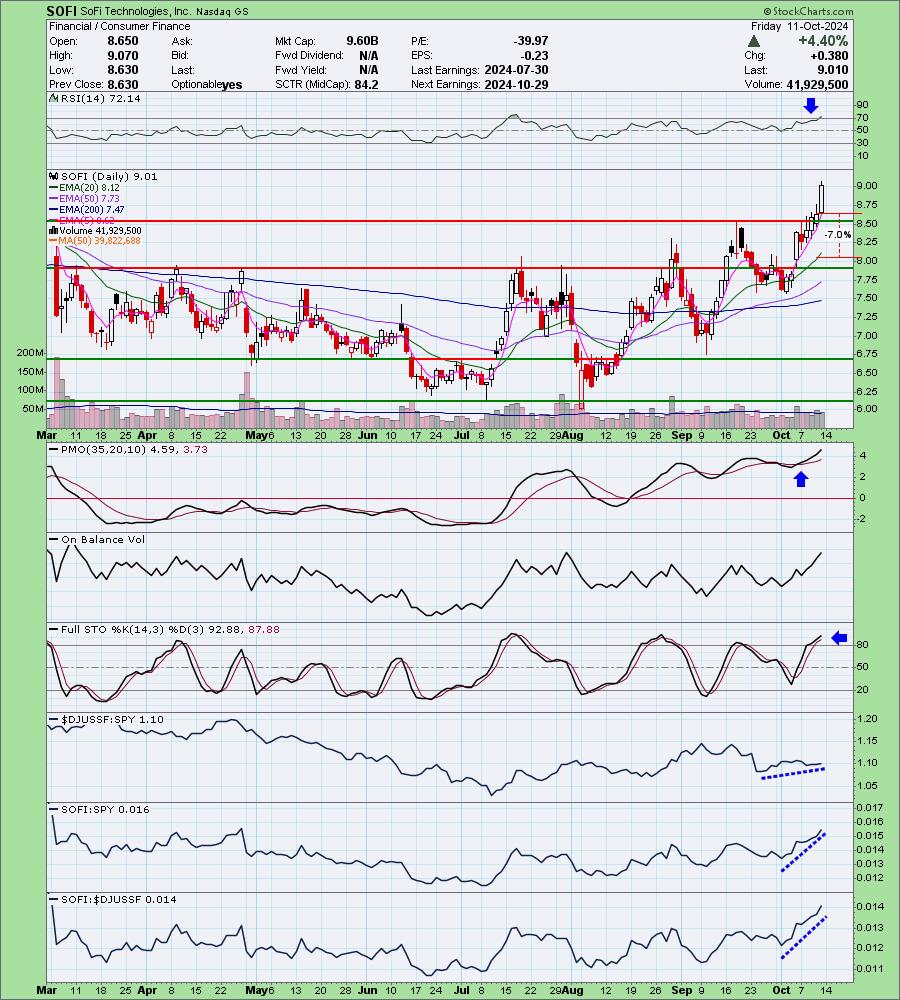
Today's big rally higher did put SOFI into overbought territory based on the RSI so entry may be a bit late here, but it does look very strong so a buy would likely work too. It's only been a day since being picked so with the positive indicators we do have to look for higher prices here. Clearly it was the Darling due to the big move in Banks today.
Don't forget, on Thursdays I look at reader-requested symbols, so shoot me an email at erin@decisionpoint.com. I read every email I receive and try to answer them all!
Dud:
Gallagher Arthur J & Co. (AJG)
EARNINGS: 2024-10-24 (AMC)
Arthur J. Gallagher & Co. engages in the provision of insurance brokerage, reinsurance brokerage, consulting, and third-party claims settlement and administration services. It operates through the following business segments: Brokerage, Risk Management, and Corporate. The Brokerage segment consists of retail and wholesale insurance brokerage operations. The Risk Management segment provides contract claim settlement and administration services. The Corporate segment manages clean energy and other investments. The company was founded by Arthur J. Gallagher in 1927 and is headquartered in Rolling Meadows, IL.
Predefined Scans Triggered: Parabolic SAR Buy Signals.
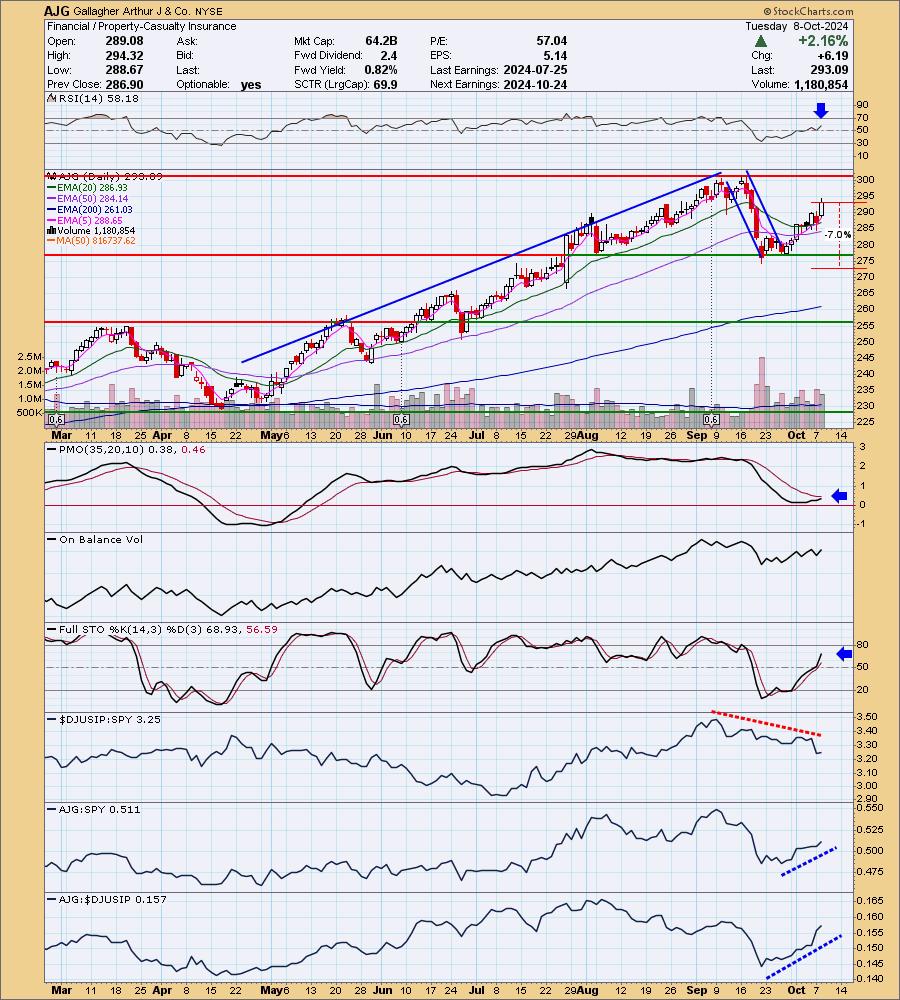
Below are the commentary and chart from Tuesday, 10/8:
"AJG is up +0.02% in after hours trading. This one has been steadily rising since bouncing off support. I see a large bull flag on this one and based on minimum upside targets for these patterns, there is plenty of upside available. The RSI is not overbought and the PMO is making its way toward a Crossover BUY Signal. Stochastics are rising strongly in positive territory. The group has not been performing well, but AJG is outperforming on its own so that is okay. If this one fails, we could point to that relative strength line as the possible culprit, but I like its chances of another extended rally. The stop is set beneath support at 7% or $272.57."
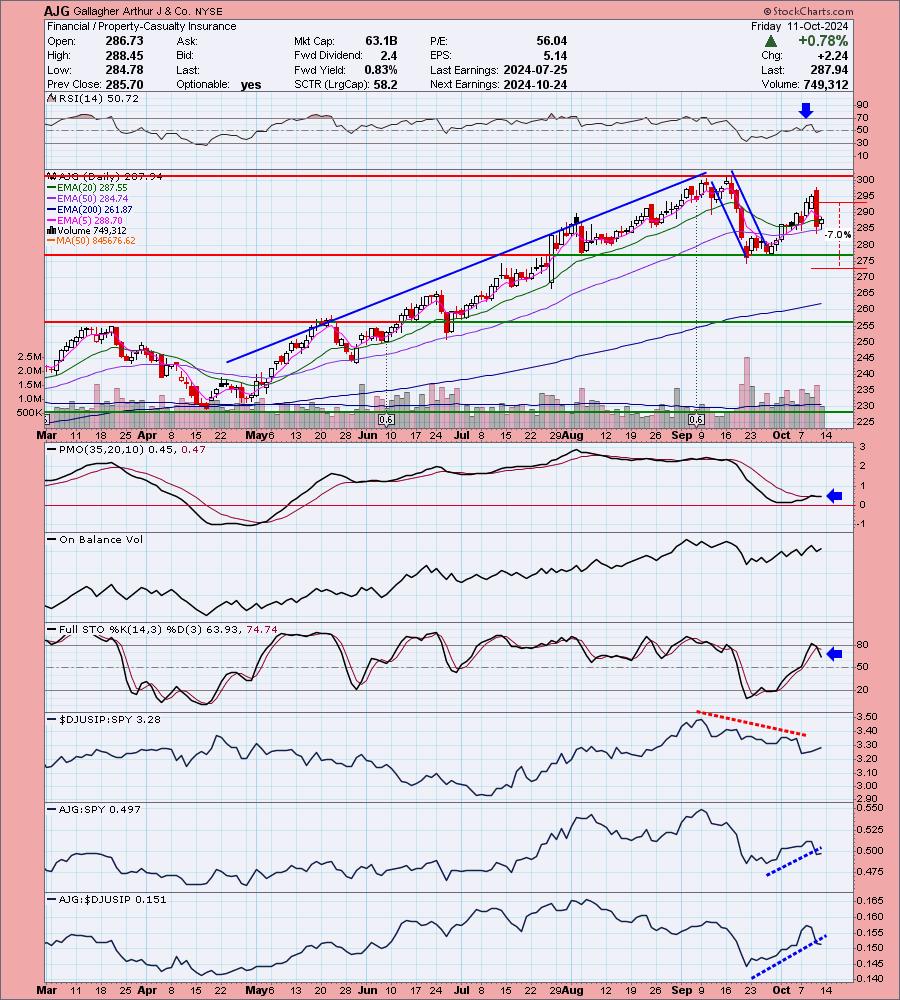
Here is today's chart:
Unfortunately, this decline turned the PMO upside down and triggered a Crossover SELL Signal. A risk taker could consider entry here with price holding above the 50-day EMA, but I know some of our other Diamond charts look better than this one. I can't say what went wrong here. The industry group wasn't performing that well, but this week the relative strength line was rising. It's a weak stock right now and probably can be taken off the watch list.
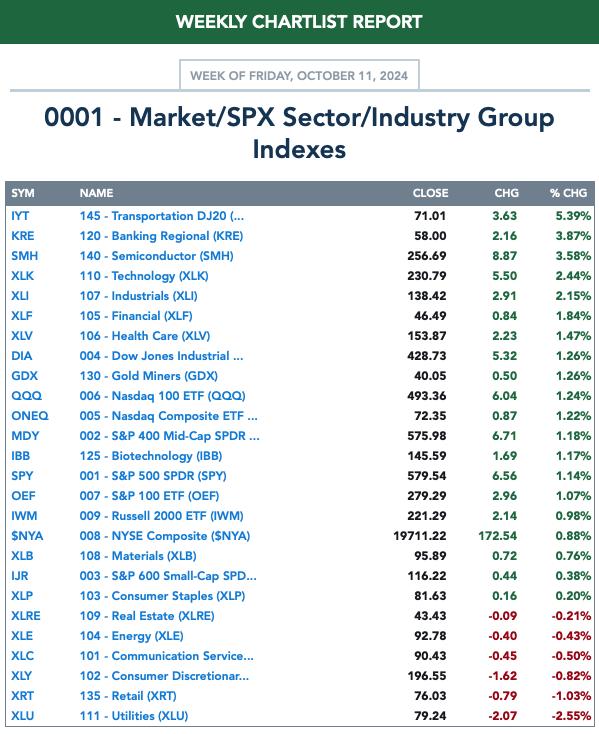
THIS WEEK's Performance:
DecisionPoint Market Scoreboard (Mechanical Trend Model Signals):
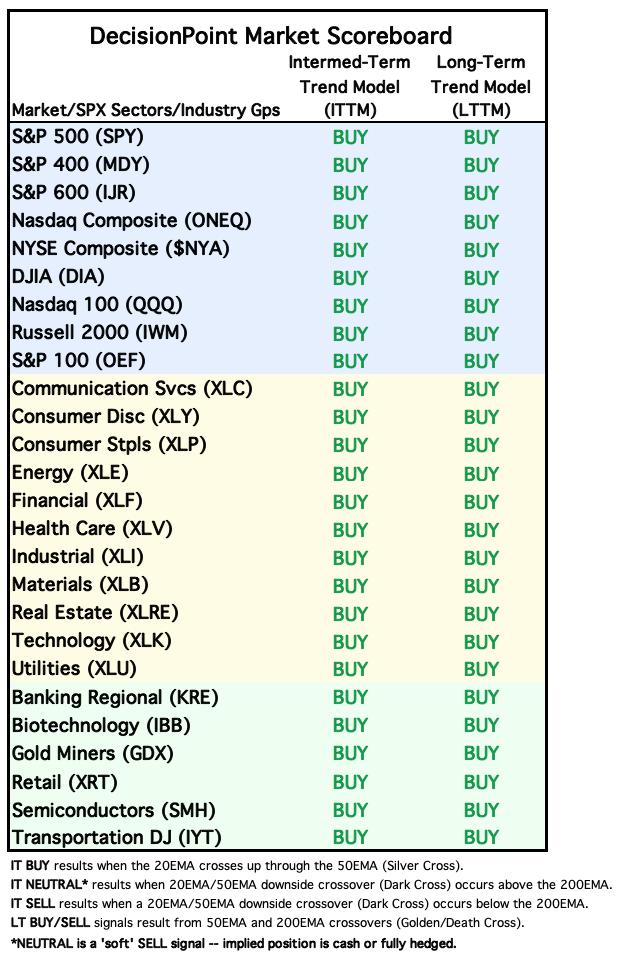
Friday signal changes are outlined in purple.
Click Here to view Carl's annotated "Under the Hood" ChartList!
Sector to Watch: Energy (XLE)
Financials saw a big breakout move today and it goes well with the very strong participation under the hood. %Stocks indicators are all above 90% as is the Silver Cross Index and Golden Cross Index. Price had already been melting up going into today's breakout. The RSI is not overbought yet. The PMO is on a new Crossover BUY Signal and Stochastics are above 80. Relative strength is picking up speed. As I mentioned earlier, you could easily go with Technology or Industrials as they are all showing nice breakout moves.
Industry Group to Watch: Asset Managers ($DJUSAG)
I really liked today's breakout move on this group. I do note that it is overbought based on the RSI so maybe I got to this group a little too late. However, we know that overbought conditions can persist in a strong bull market run like we have for this group. There is a new PMO Crossover BUY Signal that is occurring well above the zero line. Stochastics are very strong and relative strength has been on this group's side for some time. I think we can get more upside out of this corner of the market.
Go to our Under the Hood ChartList on DecisionPoint.com to get an in-depth view of all the sectors. On StockCharts.com you can find the Industry Summary.
Good Luck & Good Trading!
- Erin
erin@decisionpoint.com
Full Disclosure: I'm 60% long, 0% short.
Watch the latest episode of the DecisionPoint Trading Room with Carl & Erin Swenlin HERE!
Technical Analysis is a windsock, not a crystal ball. --Carl Swenlin
NOTE: The stocks reported herein are from mechanical trading model scans that are based upon moving average relationships, momentum and volume. DecisionPoint analysis is then applied to get selections from the scans. The selections given should prompt readers to do a chart review using their own analysis process. This letter is not a call for a specific action to buy, sell or short any of the stocks provided. There are NO sure things or guaranteed returns on the selection of "diamonds in the rough."
Helpful DecisionPoint Links:
DecisionPoint Shared ChartList and DecisionPoint Chart Gallery
Price Momentum Oscillator (PMO)
Swenlin Trading Oscillators (STO-B and STO-V)
(c) Copyright 2024 DecisionPoint.com