
I'm should be surprised by the lack of results in the scans given the market is close to new all-time highs, but I'm not. The market is churning sideways for now with mostly weak internals so finding fewer stocks and ETFs makes sense, but it makes my job harder.
I didn't find any real themes to today's scan results. It was all over the place. The ETFs I'm presenting today do look pretty good, but if the market takes a turn for the worse, they will be susceptible to losses so keep your stops in play.
Tomorrow is Reader Request Day! It is your opportunity to send me symbols that you are considering or even a portfolio position that you want some clarification on. Tomorrow is your day so take advantage! Click HERE to send me an email.
Good Luck & Good Trading,
Erin
Today's "Diamonds in the Rough": FNGS, KSA and WCLD.

Diamond Mine Trading Room:
RECORDING & DOWNLOAD LINK (10/25/2024):
Topic: DecisionPoint Diamond Mine (10/25/2024) LIVE Trading Room
Recording & Download Link
Passcode: October#25
REGISTRATION for 11/5/2024:
When: November 5, 2024 09:00 AM Pacific Time (US and Canada)
Topic: DecisionPoint Diamond Mine LIVE Trading Room
Register in advance for this webinar HERE
After registering, you will receive a confirmation email containing information about joining the webinar.

Below is the latest free DecisionPoint Trading Room recording from 10/28. You'll find these recordings posted on Mondays to our DP YouTube Channel. Be sure and subscribe HERE.
Welcome to DecisionPoint Diamonds, wherein I highlight ten "Diamonds in the Rough" per week. These are selected from the results of my DecisionPoint Scans which search for stocks that could benefit from the trend and condition of the market. Remember, these are not recommendations to buy or sell, but are the most interesting of the stocks that surfaced in my scans. My objective is to save you the work of the initial, tedious culling process, but you need to apply your own analysis to see if these stocks pique your interest as well. There are no guaranteed winners here!
"Predefined Scans Triggered" are taken from StockCharts.com using the "Symbol Summary" option instead of a "SharpChart" on the workbench.
Stop levels are all rounded down.
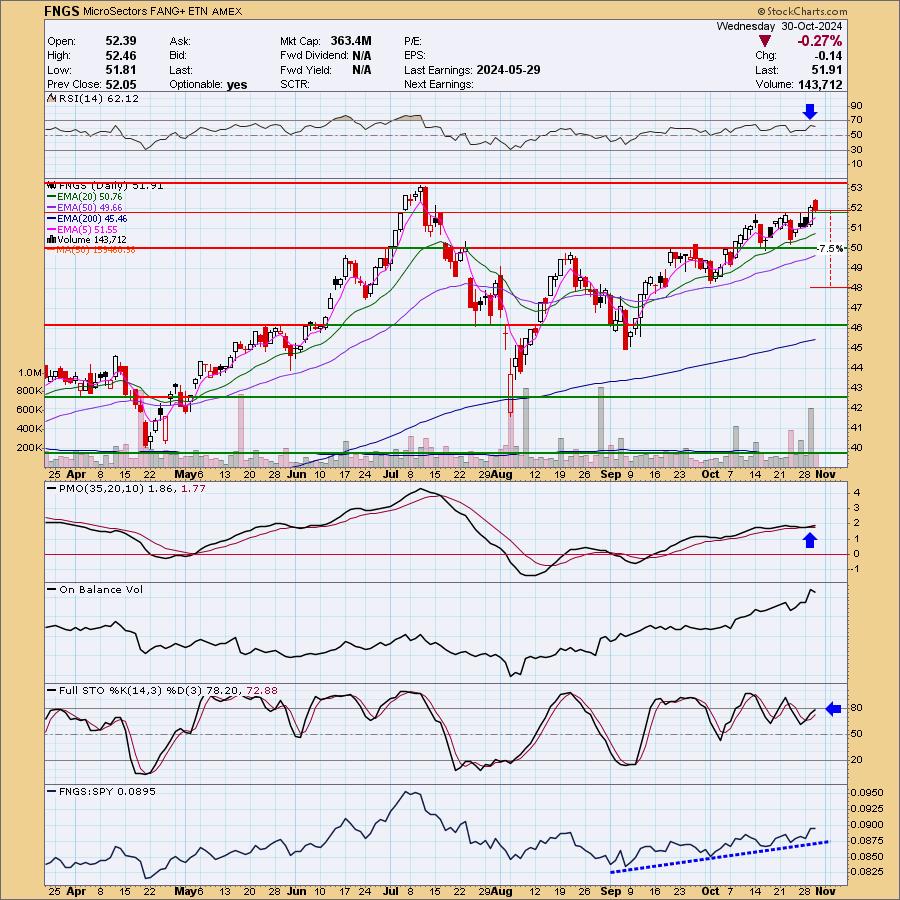
MicroSectors FANG+ ETN (FNGS)
EARNINGS: N/A
MicroSectors™ ETNs provide efficient and cost effective access to concentrated sectors of the market. The FANG+™ lineup provides exposure to NYSE® FANG+™ Index performance. Click HERE for more information.
Predefined Scans Triggered: Stocks in a New Uptrend (ADX), P&F Double Top Breakout and P&F Bullish Triangle.
FNGS is down -0.50% in after hours trading. We have a solid rising trend with a near-term breakout from a congestion zone. It was down today, but set a higher high and a higher low. The RSI is positive and not overbought. The PMO has surged (bottomed) above the signal line while above the zero line. Stochastics are rising and should get over 80 soon. This ETF has been showing great leadership. With mega-caps particularly FANG+ stocks reporting earnings, this should be a good ETF to be in. However, if the market takes a downturn, you won't want to hold this very long. The stop is set arbitrarily at 7.5% or $48.01.
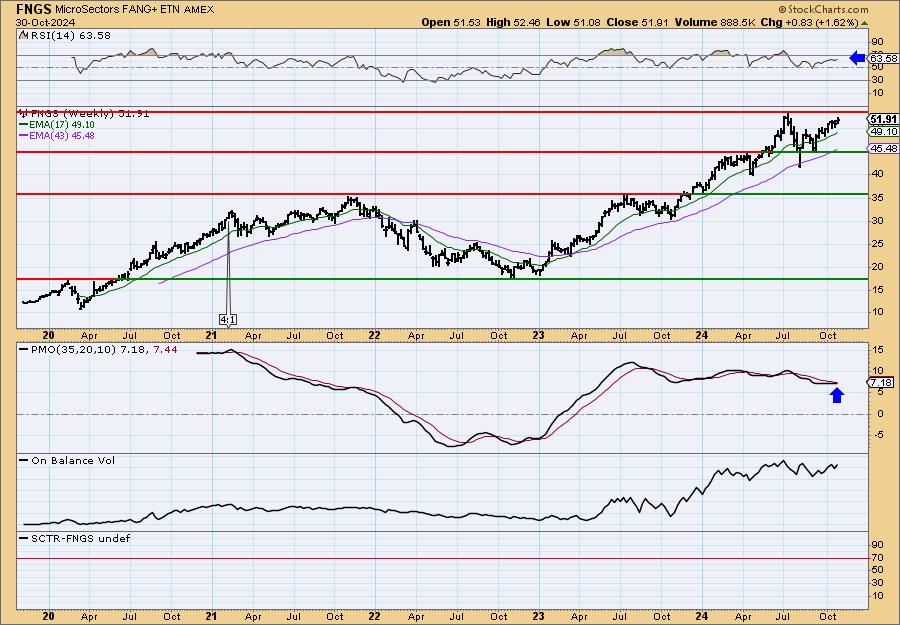
The weekly chart is favorable. We have a strong rising trend and price is headed for a breakout. The weekly RSI is not overbought and the weekly PMO has turned up. Consider a 17% upside target at $60.73.
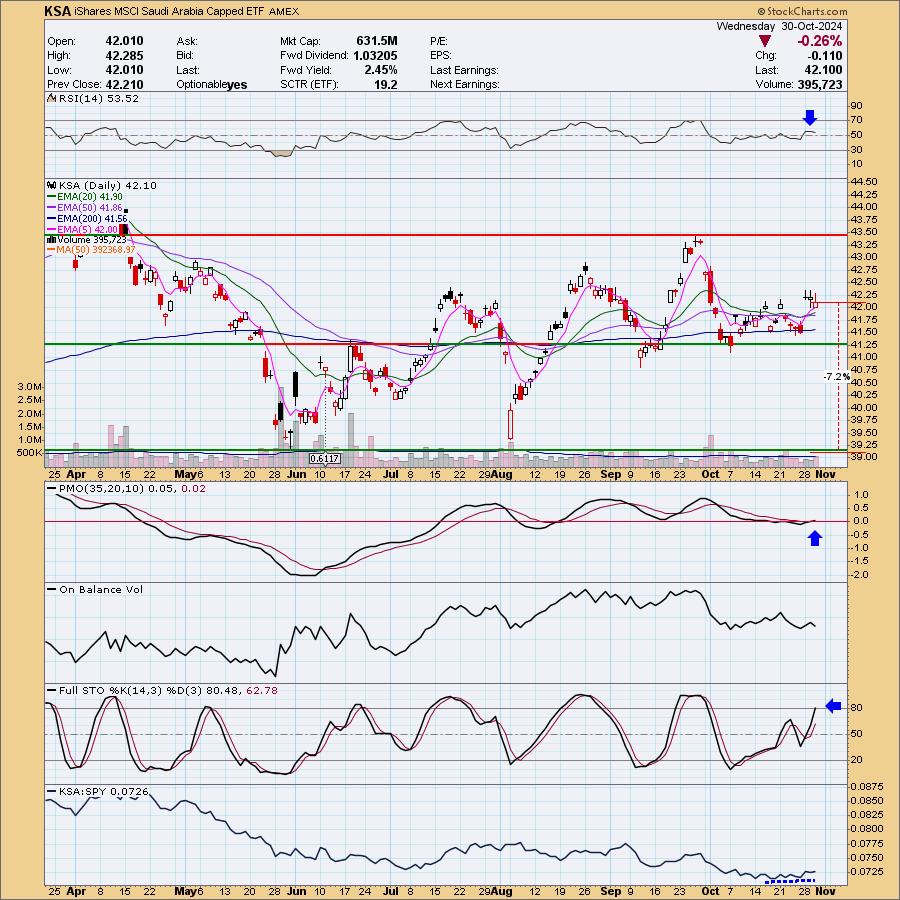
iShares MSCI Saudi Arabia Capped ETF (KSA)
EARNINGS: N/A
KSA tracks a market-cap-weighted index of Saudi Arabian firms covering 99% of the market cap spectrum. Click HERE for more information.
Predefined Scans Triggered: Hollow Red Candles, Entered Ichimoku Cloud and Shooting Star.
KSA is up +1.69% in after hours trading. I liked that price is holding support and appears ready to break from its congested trading zone. Price is essentially in a rising trend out of the May low. The RSI is not overbought and is in positive territory above net neutral (50). The PMO is on a new Crossover BUY Signal. Stochastics are rising strongly and just moved above 80. We're seeing slight outperformance against the SPY. You don't have to set your stop as deeply as mine, but I set it up at the next level of support at 7.2% or $39.06.
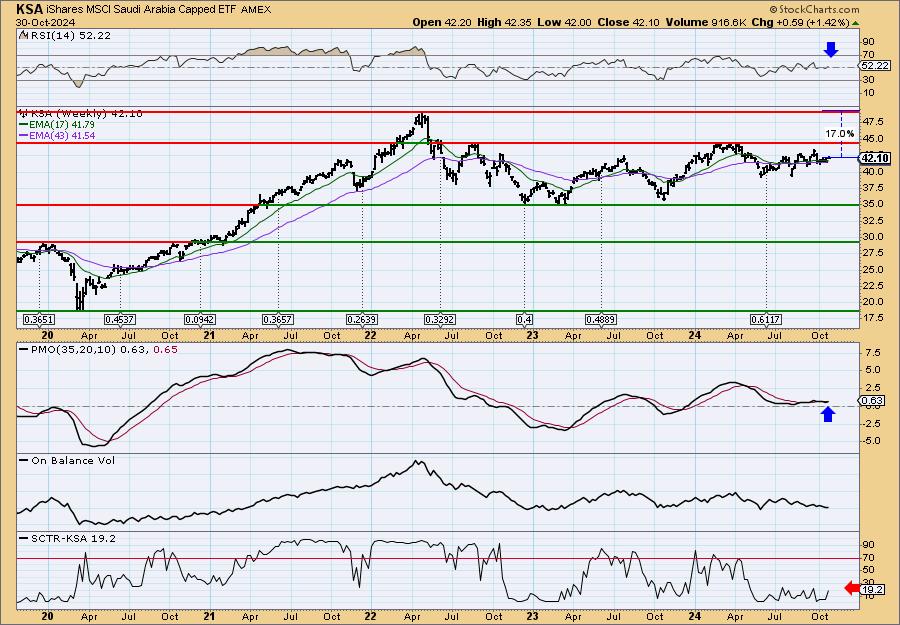
It's not the best weekly chart as it is in a trading range and near the top of it which makes it vulnerable. However, we do see a positive weekly RSI and the weekly PMO has just turned up. The StockCharts Technical Rank (SCTR) is very low and outside the hot zone*. There is some good upside potential should it reach all-time highs again.
*If a stock is in the "hot zone" above 70, it implies that it is stronger than 70% of its universe (large-, mid-, small-caps and ETFs) primarily in the intermediate to long terms.
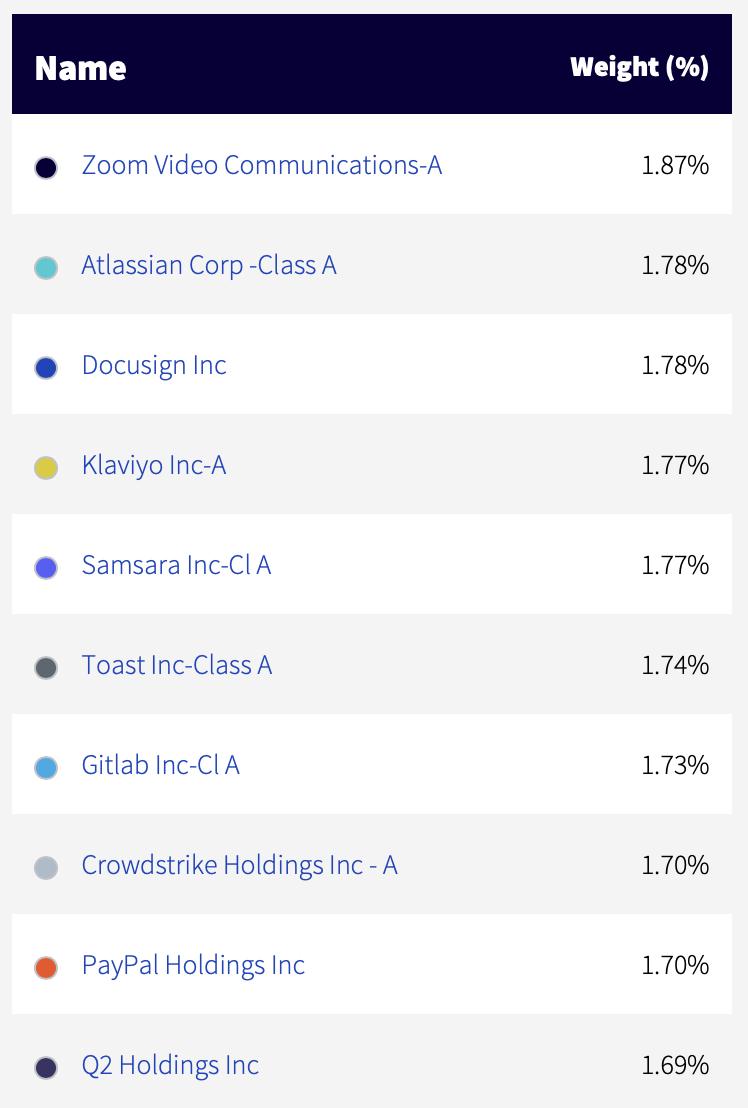
WisdomTree Cloud Computing Fund (WCLD)
EARNINGS: N/A
WCLD tracks and index of US companies primarily focused on cloud software and services. Stocks are equal weighted in the index. Click HERE for more information.
Predefined Scans Triggered: Stocks in a New Uptrend (Aroon) and Shooting Star.
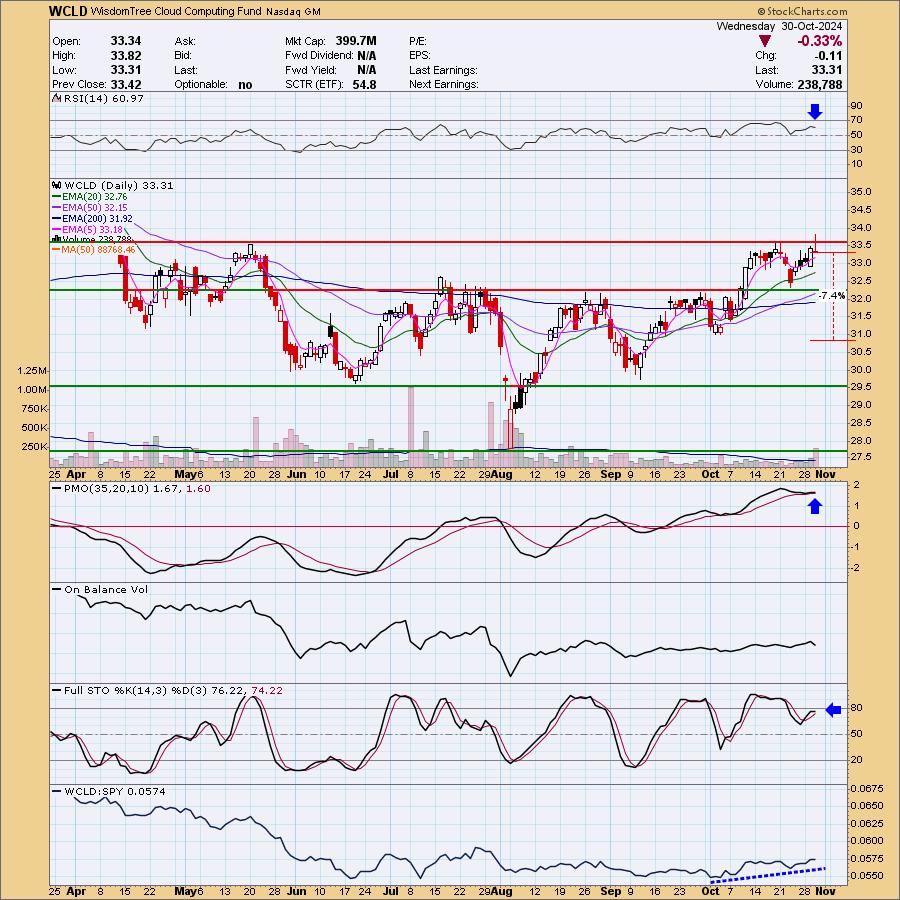
WCLD is down -0.78% in after hours trading. Intraday we saw a breakout that was encouraging. It did form a bearish shooting star candlestick so you may be able to get it at a better price point. We do have to be careful if it really begins to decline as that would form a double top. No need to give it a lot of rope if you don't want to. The RSI is positive and not overbought. The PMO has surged above the signal line well above the zero line. Stochastics are flat, but we do see that this ETF has been outperforming the SPY. The stop is set at the October low at 7.4% or $30.84.
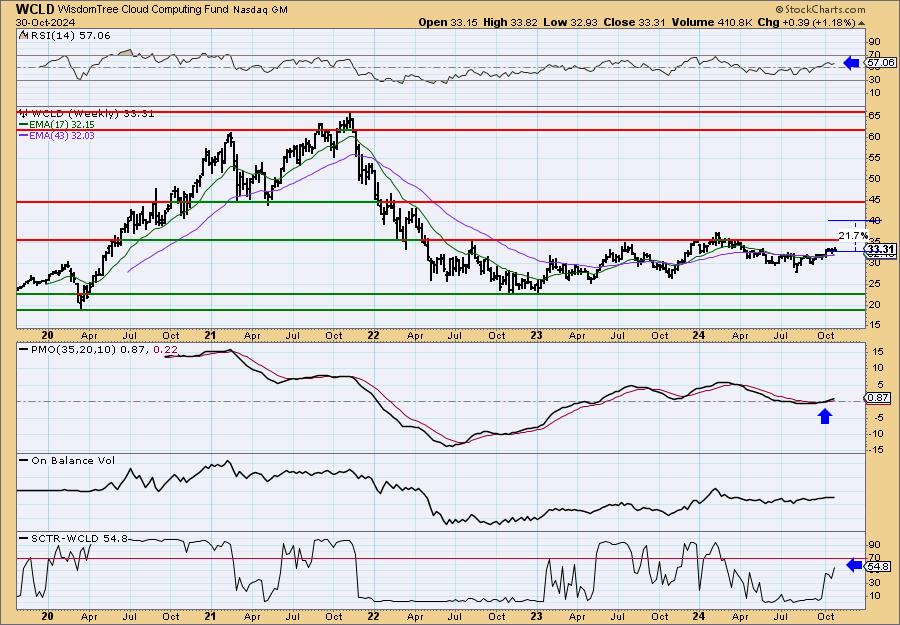
This is in a trading range right now and it is near the top which I'm not happy about except the indicators do suggest we'll see a breakout this time around. The weekly RSI is positive and the weekly PMO is undulating upward. It is on a Crossover BUY Signal and is now above the zero line. The SCTR isn't in the hot zone yet, but it is moving quickly in that direction. I'm looking for a challenge of the 2024 top.
Don't forget, on Thursdays I look at reader-requested symbols, click HERE to send me an email. I read every email I receive and try to answer them all!
Current Market Outlook:
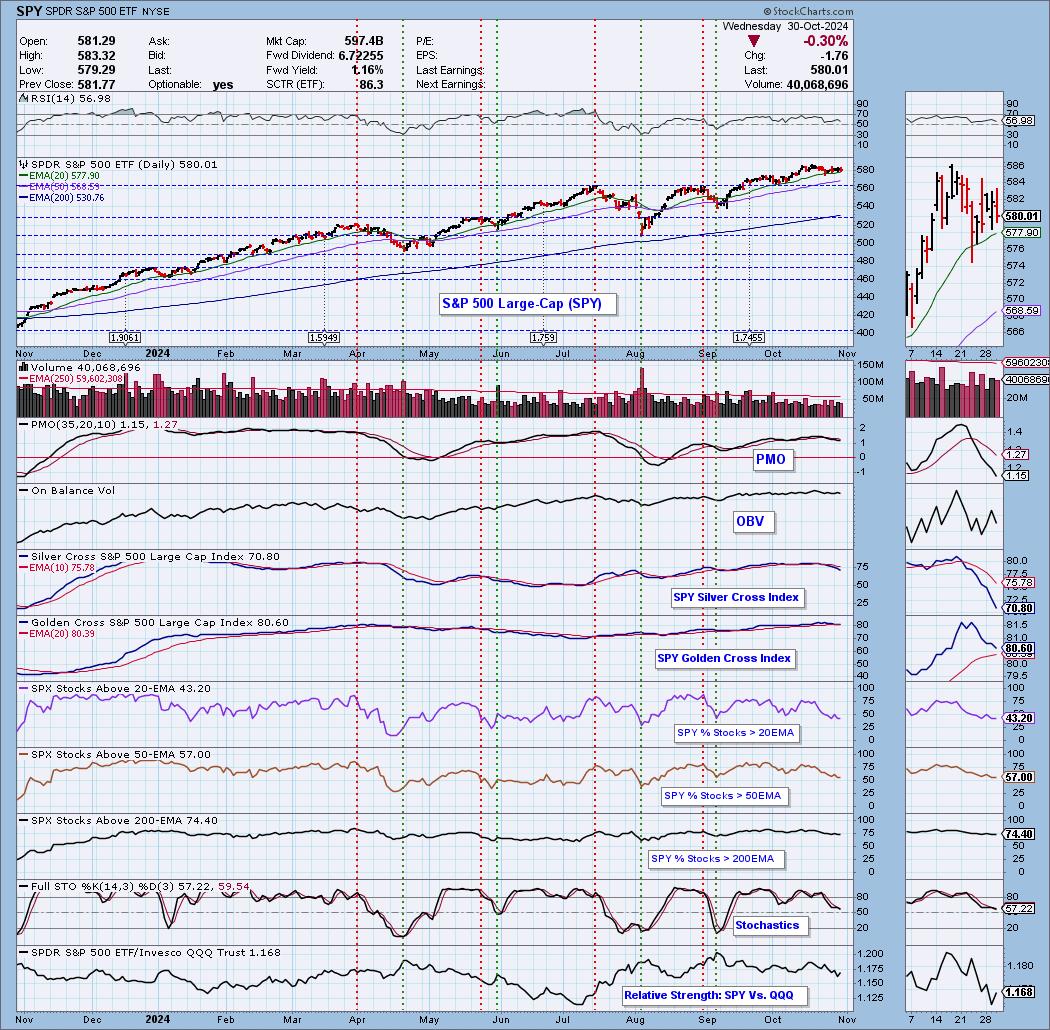
Market Environment: It is important to consider the odds for success by assessing the market tides. The following chart uses different methodologies for objectively showing the depth and trend of participation for intermediate- and long-term time frames.
- The Silver Cross Index (SCI) shows the percentage of SPX stocks on IT Trend Model BUY signals (20-EMA > 50-EMA)
- The Golden Cross Index (GCI) shows the percentage of SPX stocks on LT Trend Model BUY signals (50-EMA > 200-EMA)
Don't forget that as a "Diamonds" member, you have access to our "Under the Hood" curated ChartList on DecisionPoint.com. You'll find it under "Members Only" links on the left side on the Blogs and Links Page.
Here is the current chart:
Full Disclosure: I am 65% long, 0% short.
I'm required to disclose if I currently own a stock I mention and/or may buy/short it within the next 72 hours.
"Technical Analysis is a windsock, not a crystal ball." - Carl Swenlin
(c) Copyright 2024 DecisionPoint.com
Watch the latest episode of DecisionPoint Trading Room with Carl & Erin Swenlin Mondays on the DecisionPoint YouTube channel here!
NOTE: The stocks reported herein are from mechanical trading model scans that are based upon moving average relationships, momentum and volume. DecisionPoint analysis is then applied to get five selections from the scans. The selections given should prompt readers to do a chart review using their own analysis process. This letter is not a call for a specific action to buy, sell or short any of the stocks provided. There are NO sure things or guaranteed returns on the daily selection of "Diamonds in the Rough."
Regarding BUY/SELL Signals: The signal status reported herein is based upon mechanical trading model signals and crossovers. They define the implied bias of the price index/stock based upon moving average relationships and momentum, but they do not necessarily call for a specific action. They are information flags that should prompt chart review. Further, they do not call for continuous buying or selling during the life of the signal. For example, a BUY signal will probably (but not necessarily) return the best results if action is taken soon after the signal is generated. Additional opportunities for buying may be found as price zigzags higher, but the trader must look for optimum entry points. Conversely, exit points to preserve gains (or minimize losses) may be evident before the model mechanically closes the signal.
Helpful DecisionPoint Links:
Price Momentum Oscillator (PMO)
Swenlin Trading Oscillators (STO-B and STO-V)
For more links, go to DecisionPoint.com