
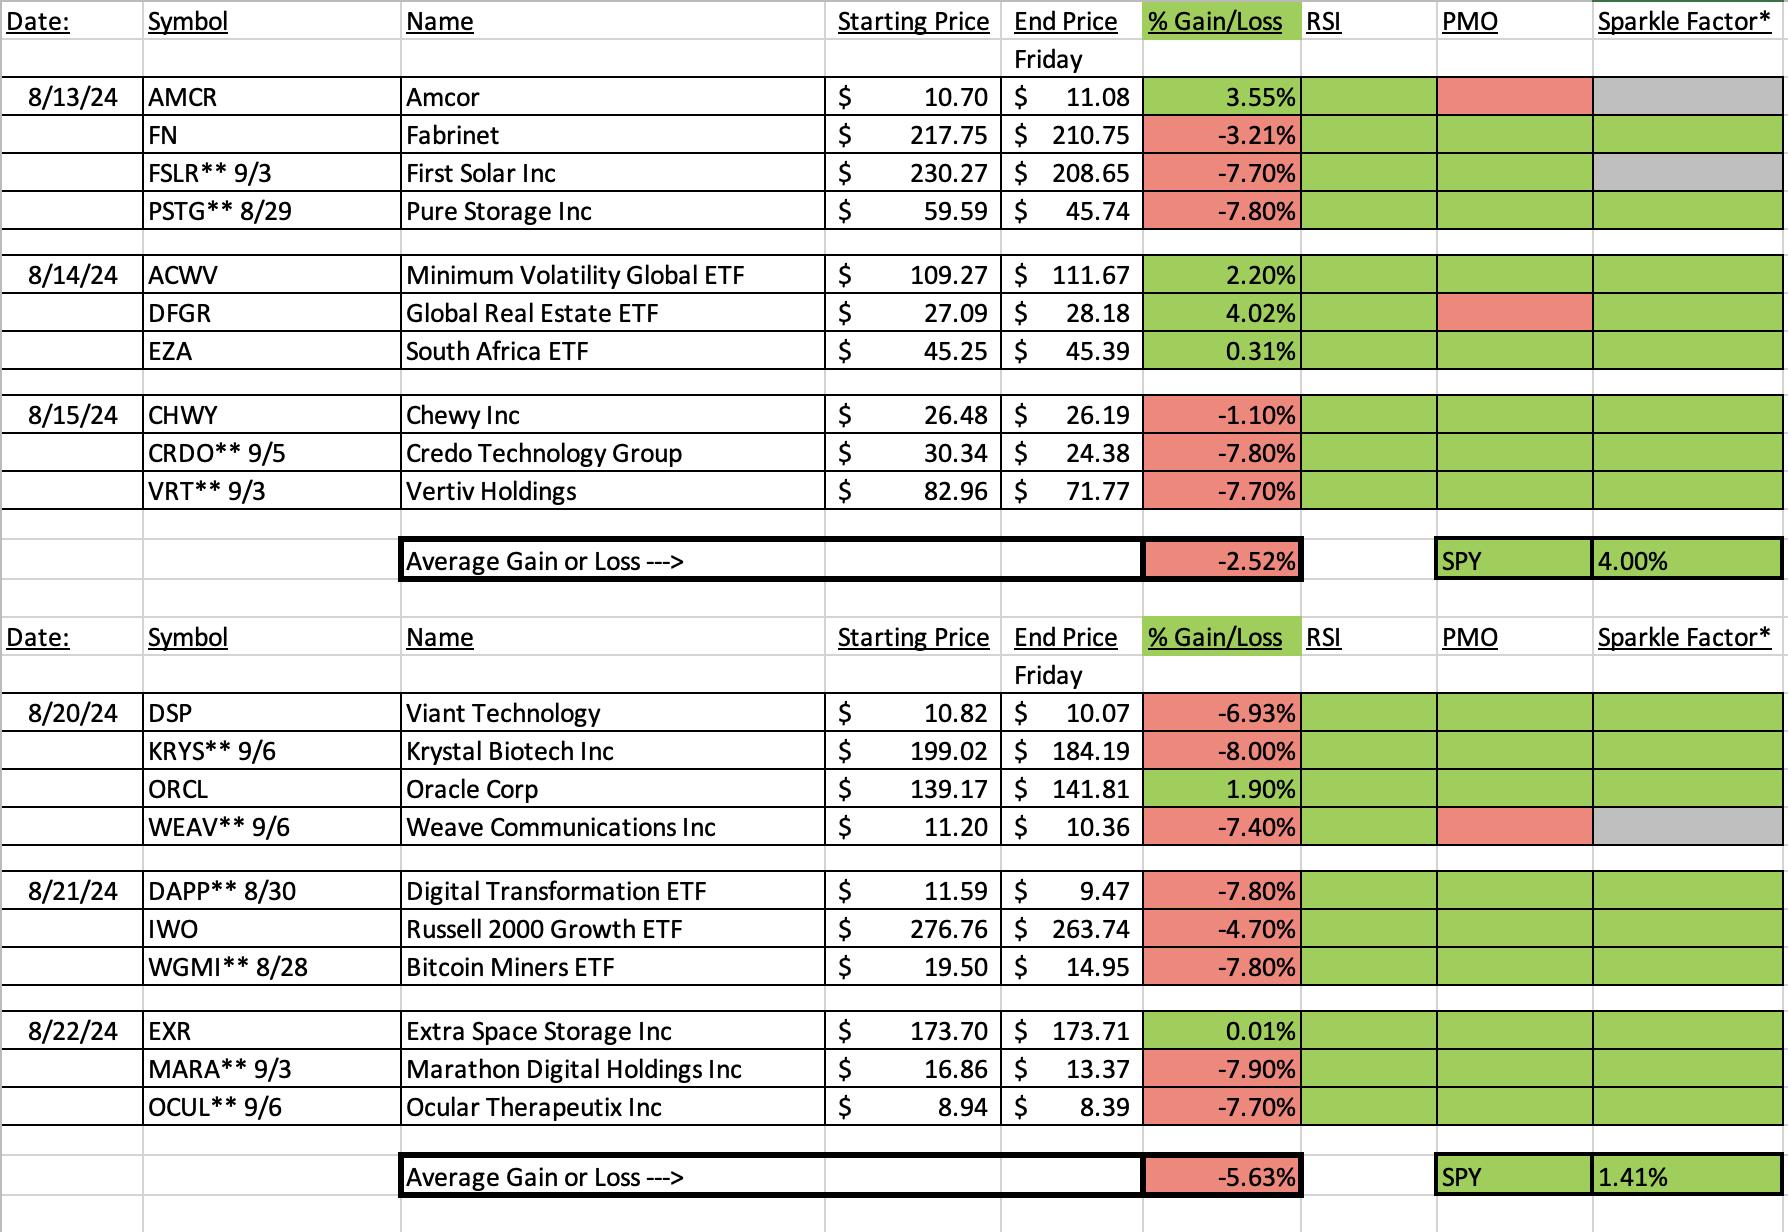
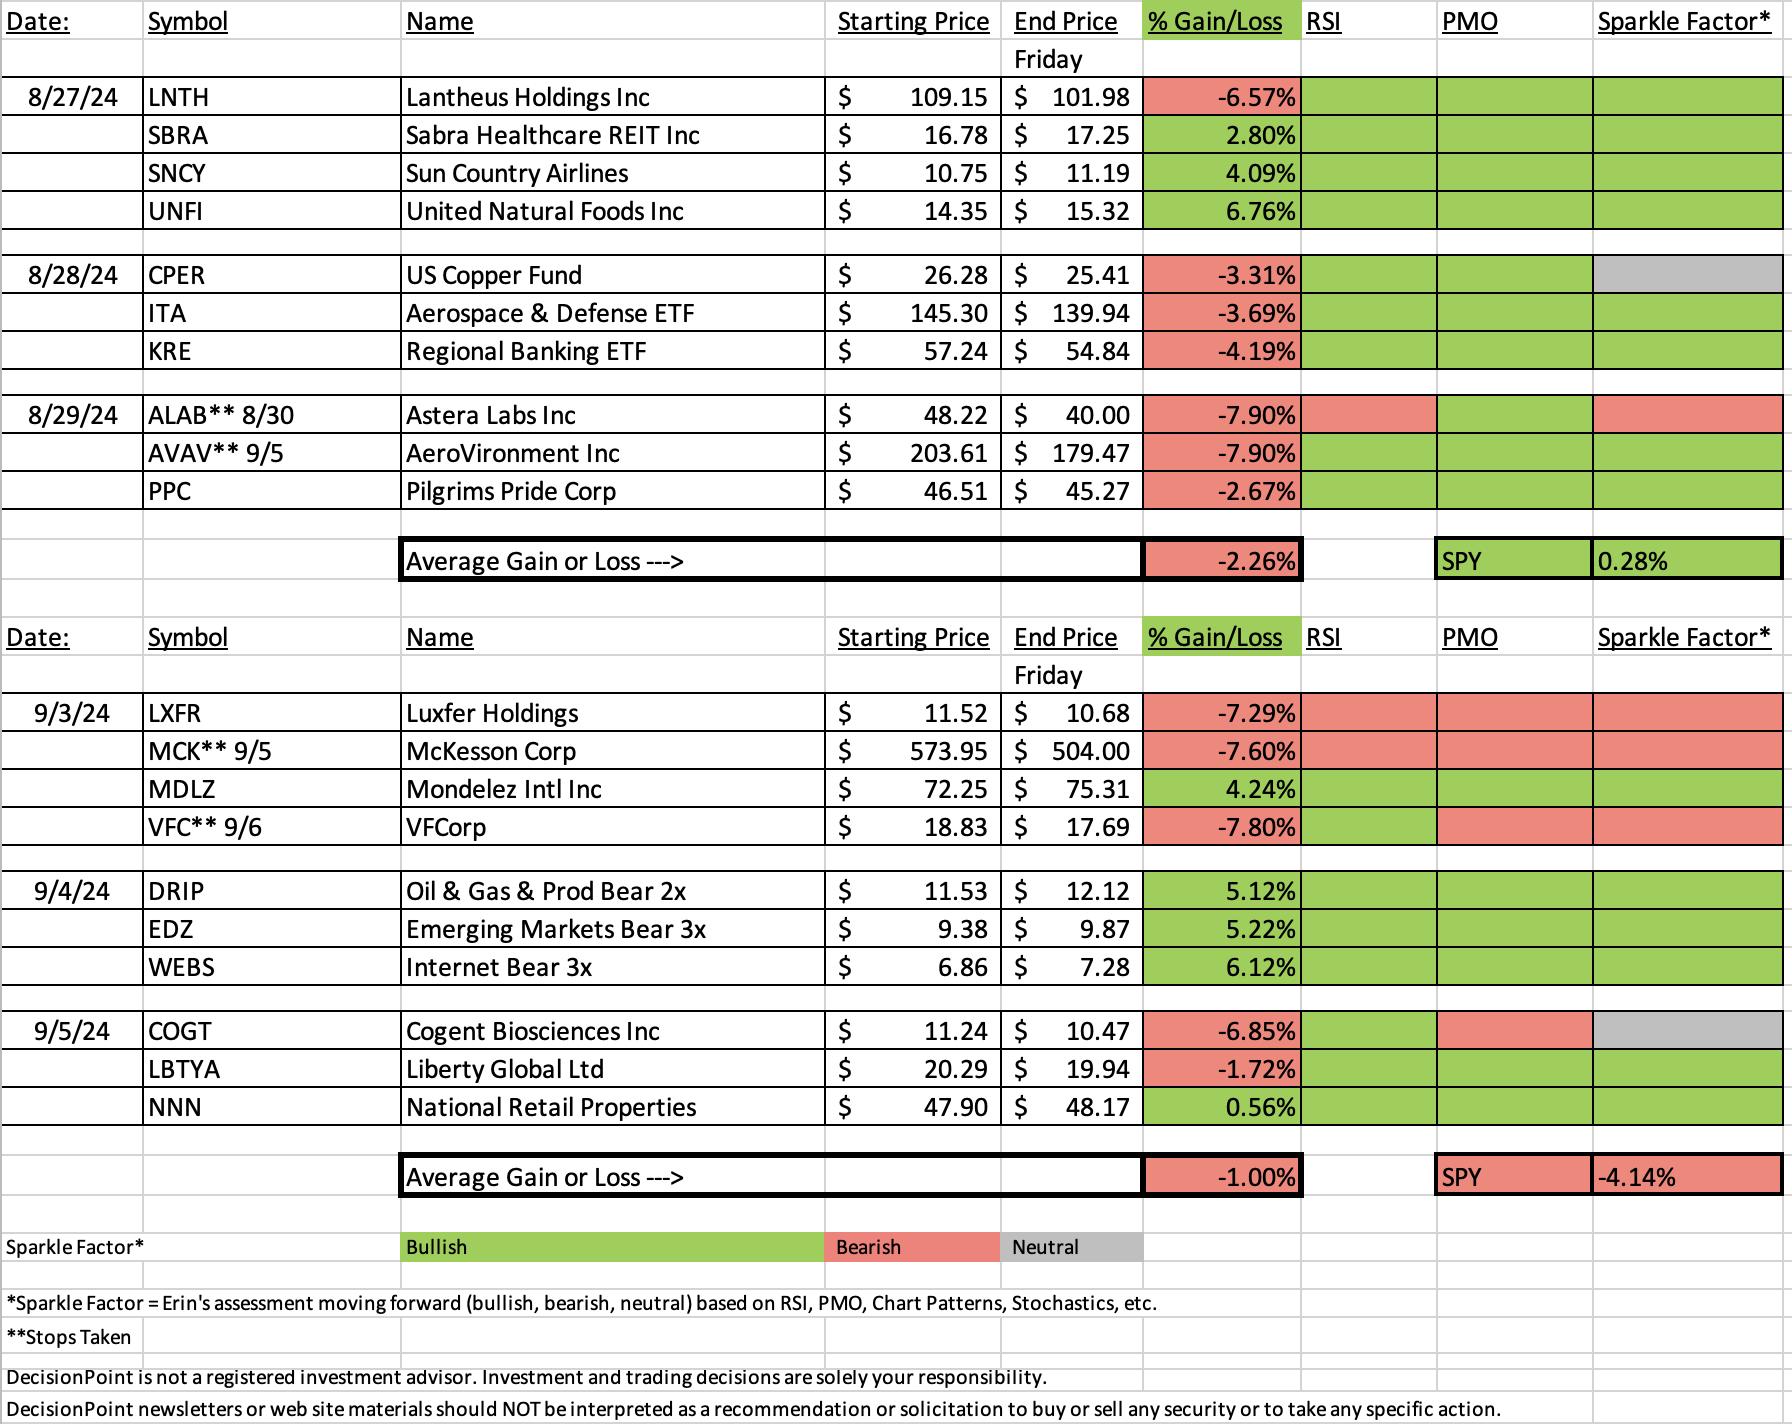
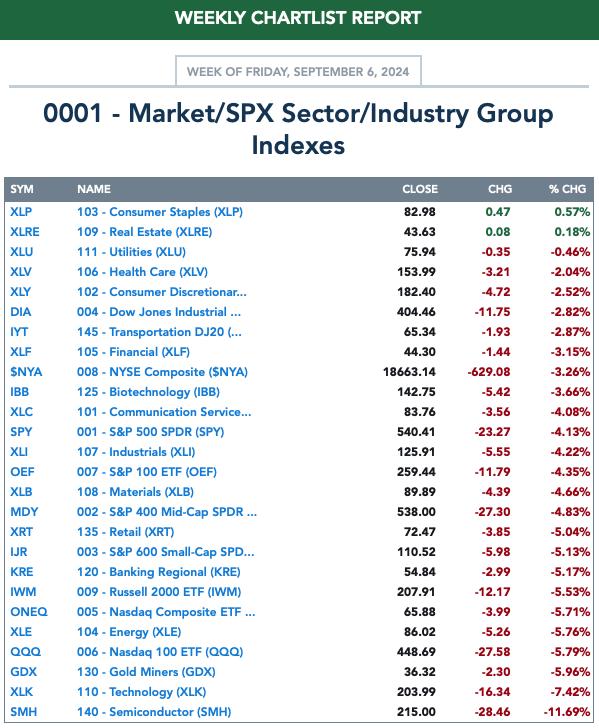
Thanks to our hedges on ETF Day, "Diamonds in the Rough" finished down only 1% on the week while the SPY was down -4.14%! The market took a turn for the worse this week and it was evident on the spreadsheet this week. We had numerous stops hit on positions we monitor for one month. At this point I would prepare for more decline.
I'm not feeling well today so the Diamond Mine ended earlier this morning, but we still had an opportunity to find possible targets for next week using the scans. The Diamond Dog Scan came up with the most results. That scan helps us find shorting opportunities. Here are some shorts to look at: CRWD, EW, CTRA and ALGN. I did find two longs as well: AWK and SO.
The Sector to Watch was easy to pick this week as it was the only sector showing a rising PMO. That was Consumer Staples. There were certainly hits and misses among the industry groups, but I decided I liked Distillers and Vintners the most. Unfortunately, it is a very small industry group so I was only able to find one stock I liked: STZ.
This week's Darling was the Internet Bear 3x ETF which was up +6.12% since being picked. It should be an excellent hedge moving forward (also of interest this morning, the Semiconductor Bear 3x ETF (SOXS)).
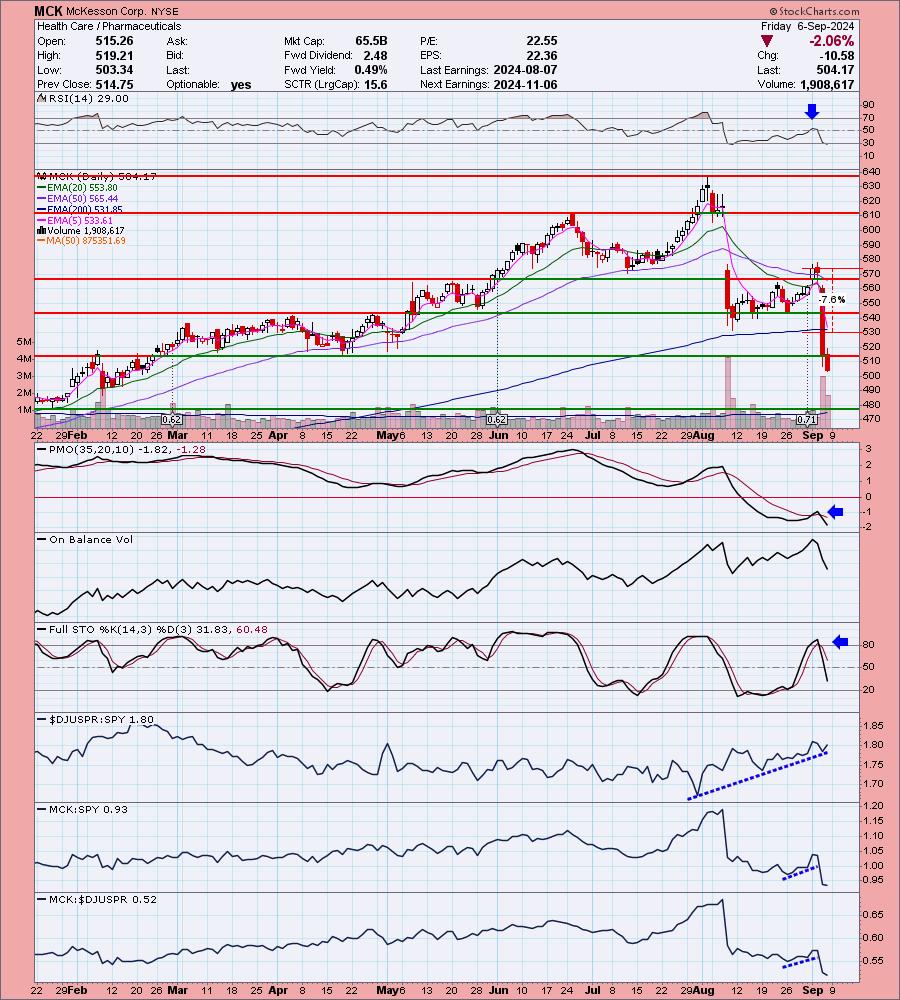
The week's Dud was McKesson (MCK). I have no idea what hit this stock, but it was down over 10% yesterday on a price shock. We'll look at the chart, but I didn't see much in the way of warning on this one. It was the Dud even though the stop was lower because of the magnitude of the drop.
It wasn't a good week. Let's hope next week's picks can weather the market storm. Time to think short.
Good Luck & Good Trading,
Erin

Diamond Mine Trading Room:
RECORDING & DOWNLOAD LINK (9/6/2024):
Topic: DecisionPoint Diamond Mine (9/6/2024) LIVE Trading Room
Recording & Download Link
Passcode: September#6
REGISTRATION for 9/13/2024:
When: September 13, 2024 09:00 AM Pacific Time (US and Canada)
Topic: DecisionPoint Diamond Mine LIVE Trading Room
Register in advance for this webinar HERE
After registering, you will receive a confirmation email containing information about joining the webinar.

Below is the latest free DecisionPoint Trading Room recording from 8/26. You'll find these recordings posted on Mondays to our DP YouTube Channel. Be sure and subscribe HERE.
A few items about the spreadsheet: I've put on the spreadsheet whether the RSI is positive (green) or negative (red). The PMO column tells you if it is rising (green) or falling (red). Finally I've added my own "Sparkle Factor" that gives you my assessment going forward, bullish (green), bearish (red) or neutral (gray). The Sparkle Factor is basically my thoughts on whether I expect it to rise or fall. A neutral means it could really go either way so it could be added to a watch list. If you're in a stock I consider "neutral" going forward, the ball is in your court.
Darling:
Direxion Daily Dow Jones Internet Bear 3X Shares (WEBS)
EARNINGS: N/A
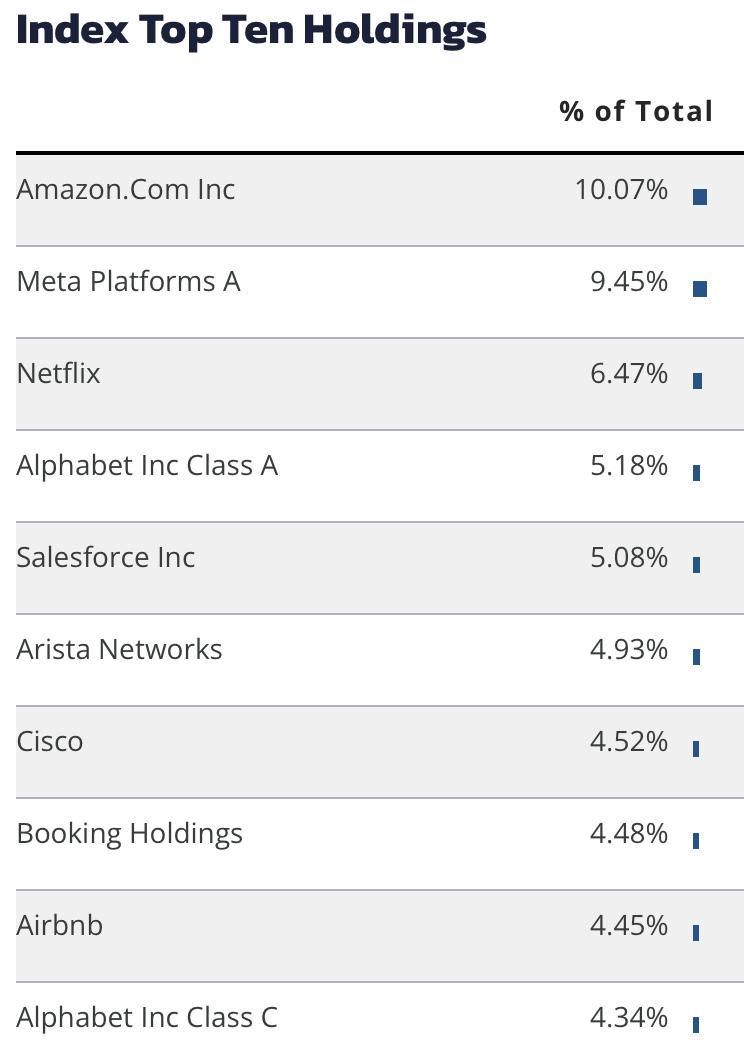
WEBS provides 3x daily inverse exposure to a market-cap-weighted index of the largest and most liquid U.S. Internet companies. Click HERE for more information.
Predefined Scans Triggered: Filled Black Candles and P&F High Pole.
Below are the commentary and chart from Wednesday, 9/4:
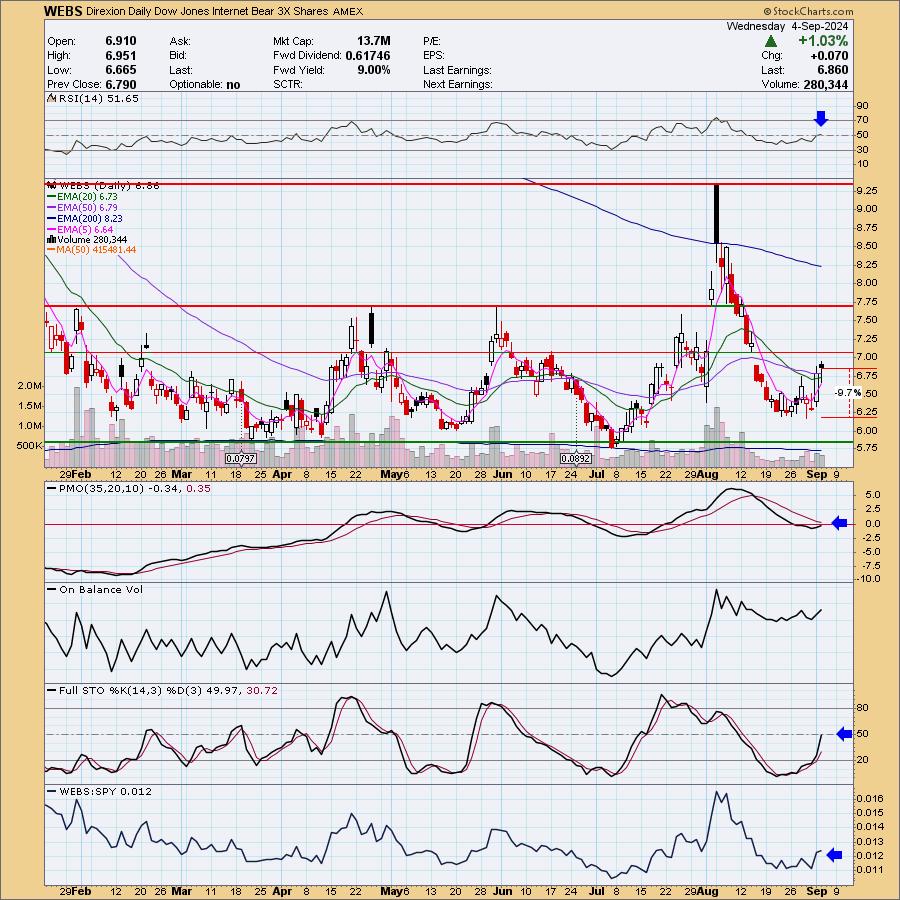
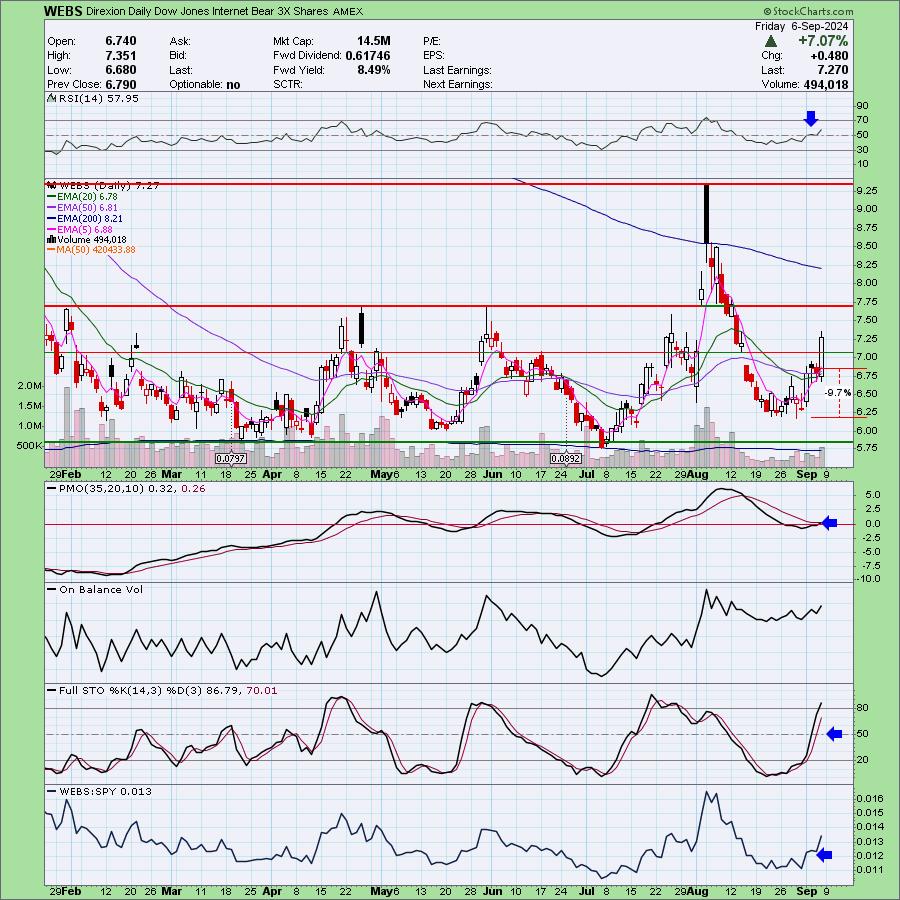
"WEBS is unchanged in after hours trading. This is a nice reversal coming before support was reached which is bullish. The scooped bottom also could be looked at as a bullish double bottom. This is an interesting way to hedge mega-cap in the Communication Services and Technology related space. There was a bearish filled black candlestick today so we could see a decline tomorrow. The RSI is just now above net neutral (50) and the PMO is on the rise and nearing a Crossover BUY Signal. Stochastics look very strong and relative strength tells us a hedge is probably a good idea. The stop has to be set deeply as this is leveraged 3x so I set it at 9.7% or $6.19."
Here is today's chart:
Today's blood bath helped WEBS gain over 7% today. It is getting close to overhead resistance so we will want to be on the lookout there for a possible reversal, but overall I would expect to see it continue to make its way up as the market will likely continue its decline next week. The technicals were good, but this was primarily picked for its hedge qualities.
Don't forget, on Thursdays I look at reader-requested symbols, so shoot me an email at erin@decisionpoint.com. I read every email I receive and try to answer them all!
Dud:
McKesson Corp. (MCK)
EARNINGS: 2024-11-06 (AMC)
McKesson Corp. engages in providing healthcare services. It operates through the following segments: U.S. Pharmaceutical, Prescription Technology Solutions (RxTS), Medical-Surgical Solutions, and International. The U.S. Pharmaceutical segment distributes branded, generic, specialty, biosimilar and over-the-counter pharmaceutical drugs. The RxTS segment offers prescription price transparency, benefit insight, dispensing support services, third-party logistics, and wholesale distribution. The Medical-Surgical Solutions segment provides medical-surgical supply distribution, logistics, and other services to healthcare providers. The International segment refers to the distribution and services to wholesale, institutional, and retail customers in Europe and Canada. The company was founded by John McKesson and Charles Olcott in 1833 and is headquartered in Irving, TX.
Predefined Scans Triggered: P&F Ascending Triple Top Breakout and P&F Double Top Breakout.
Below are the commentary and chart from Tuesday, 9/3:
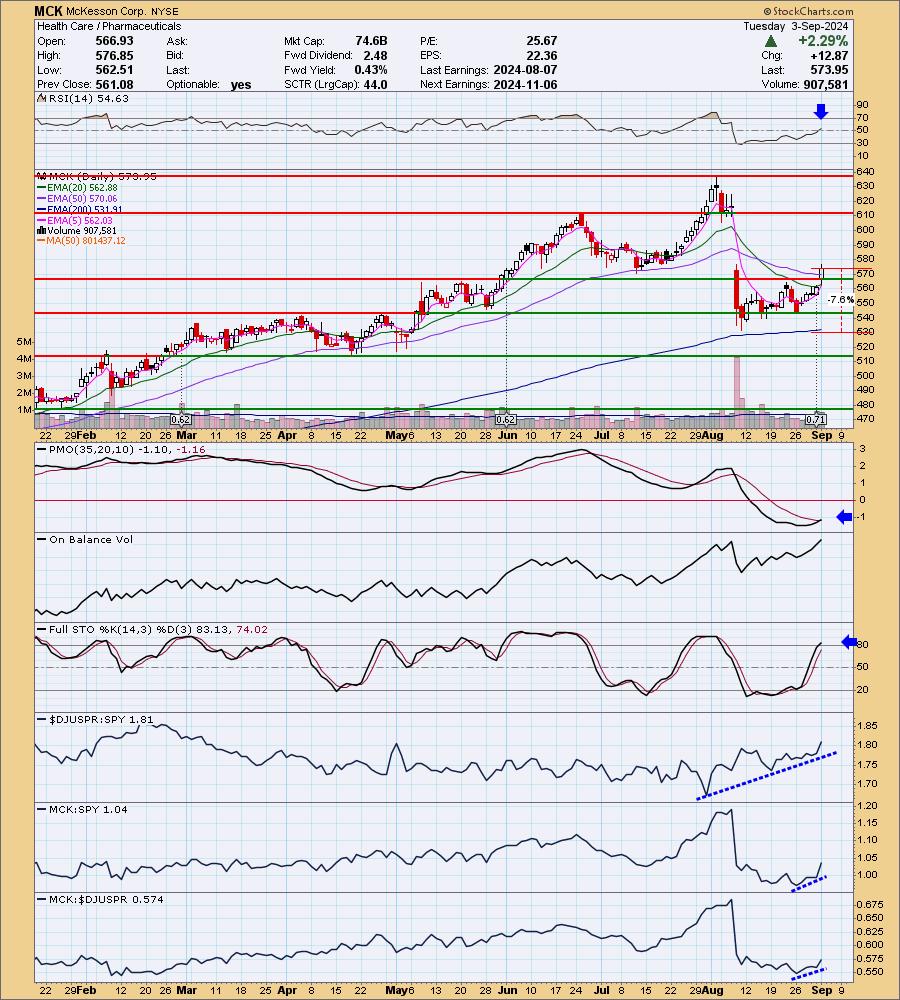
"MCK is unchanged in after hours trading. Today saw a very nice breakout from a recent trading range. The RSI just hit positive territory. There is a new Crossover BUY Signal. Stochastics are rising above 80 and relative strength is picking up across the board. One issue may be gap resistance. It didn't quite overcome it, but the breakout above both the 20/50-day EMAs tell me we should see more follow through to the upside. The stop is set beneath the 200-day EMA at 7.6% or $530.33."
Here is today's chart:
The question I had was what could possibly have gone wrong here. Everything in the chart above was bullish. I decided what could have been an issue is that it did not do well after earnings on 8/7. Poor earnings can suggest weakness further ahead and that could've been the culprit here.
THIS WEEK's Performance:
DecisionPoint Market Scoreboard (Mechanical Trend Model Signals):
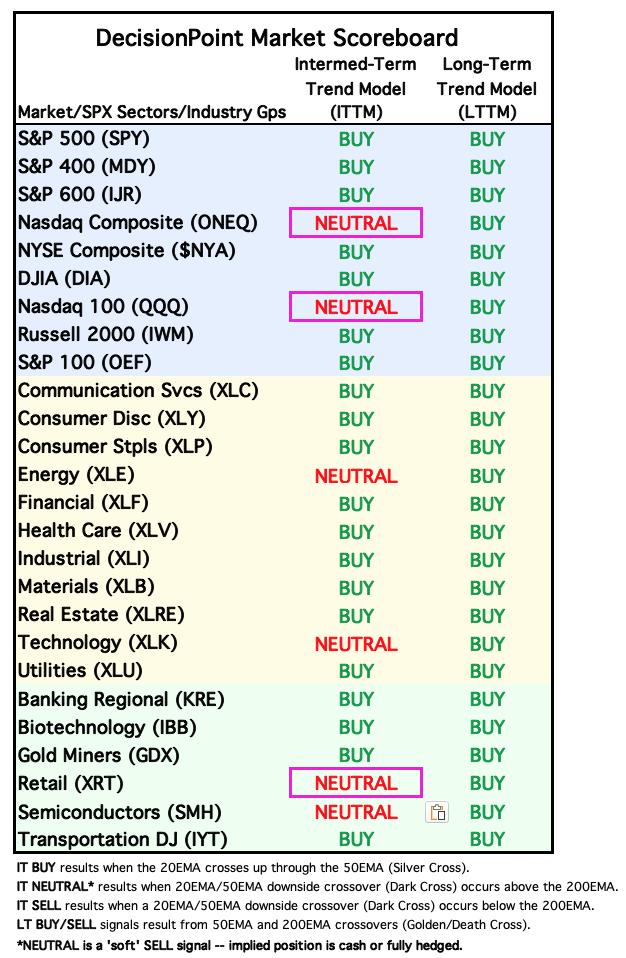
Friday signal changes are outlined in purple.
Click Here to view Carl's annotated "Under the Hood" ChartList!
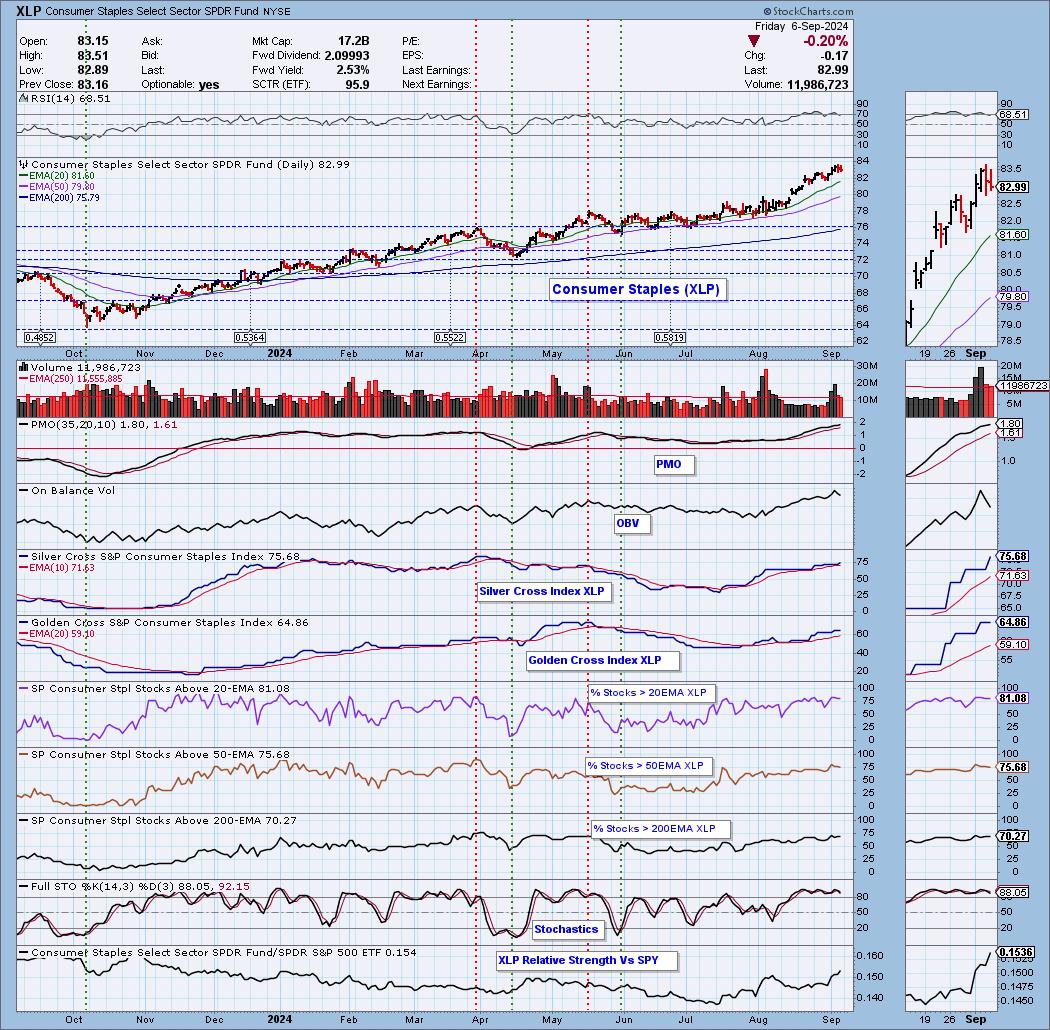
Sector to Watch: Consumer Staples (XLP)
Right now there are three sectors worth looking at on the bullish side, Real Estate (XLRE), Utilities (XLU) and Consumer Staples (XLP). Not surprisingly these are all defensive. A runaway decline could take everyone down with it so stay alert even if you are in these defensive areas of the market. XLP has a great foundation of participation and even on a decline, it didn't lose much ground. The Silver Cross Index is moving higher above its signal line so we have a BULLISH IT Bias. Stochastics are strong above 80 and relative strength is there against the SPY. The recent declines offered the RSI an opportunity to leave overbought territory. This seems to be the safest place in the market right now.
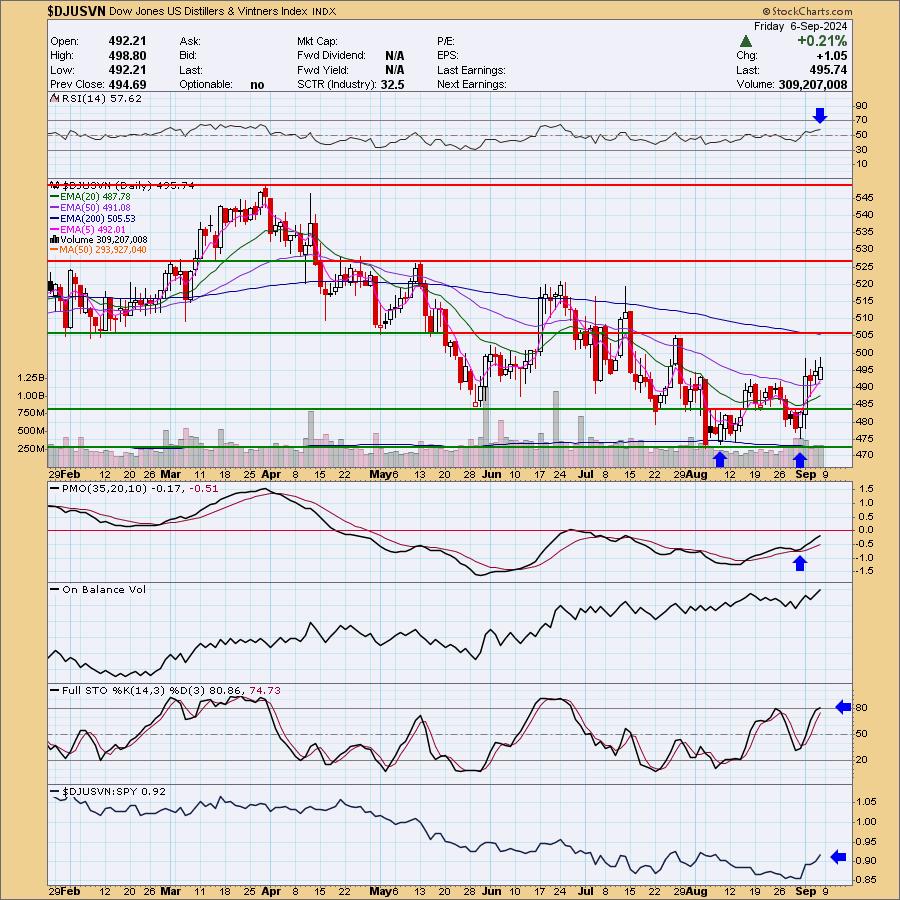
Industry Group to Watch: Distillers & Vintners ($DJUSVN)
I primarily picked this group because it was not as overbought as many of the others. What I didn't realize is that there are only a handful of stocks (most of them too low on volume) to choose from so we only have one stock from this group to watch next week: STZ. I liked the double bottom on this chart. We also have a PMO Surge above the signal line leading into the latest rally. Stochastics are now above 80. This chart looks remarkably similar to STZ because it is the leader in the group. I would recommend checking out some of the other industry groups in XLP using the Industry Summary on StockCharts.com.
Go to our Under the Hood ChartList on DecisionPoint.com to get an in-depth view of all the sectors. On StockCharts.com you can find the Industry Summary.
Good Luck & Good Trading!
- Erin
erin@decisionpoint.com
Full Disclosure: I'm 20% long, 0% short.
Watch the latest episode of the DecisionPoint Trading Room with Carl & Erin Swenlin HERE!
Technical Analysis is a windsock, not a crystal ball. --Carl Swenlin
NOTE: The stocks reported herein are from mechanical trading model scans that are based upon moving average relationships, momentum and volume. DecisionPoint analysis is then applied to get selections from the scans. The selections given should prompt readers to do a chart review using their own analysis process. This letter is not a call for a specific action to buy, sell or short any of the stocks provided. There are NO sure things or guaranteed returns on the selection of "diamonds in the rough."
Helpful DecisionPoint Links:
DecisionPoint Shared ChartList and DecisionPoint Chart Gallery
Price Momentum Oscillator (PMO)
Swenlin Trading Oscillators (STO-B and STO-V)
(c) Copyright 2024 DecisionPoint.com