
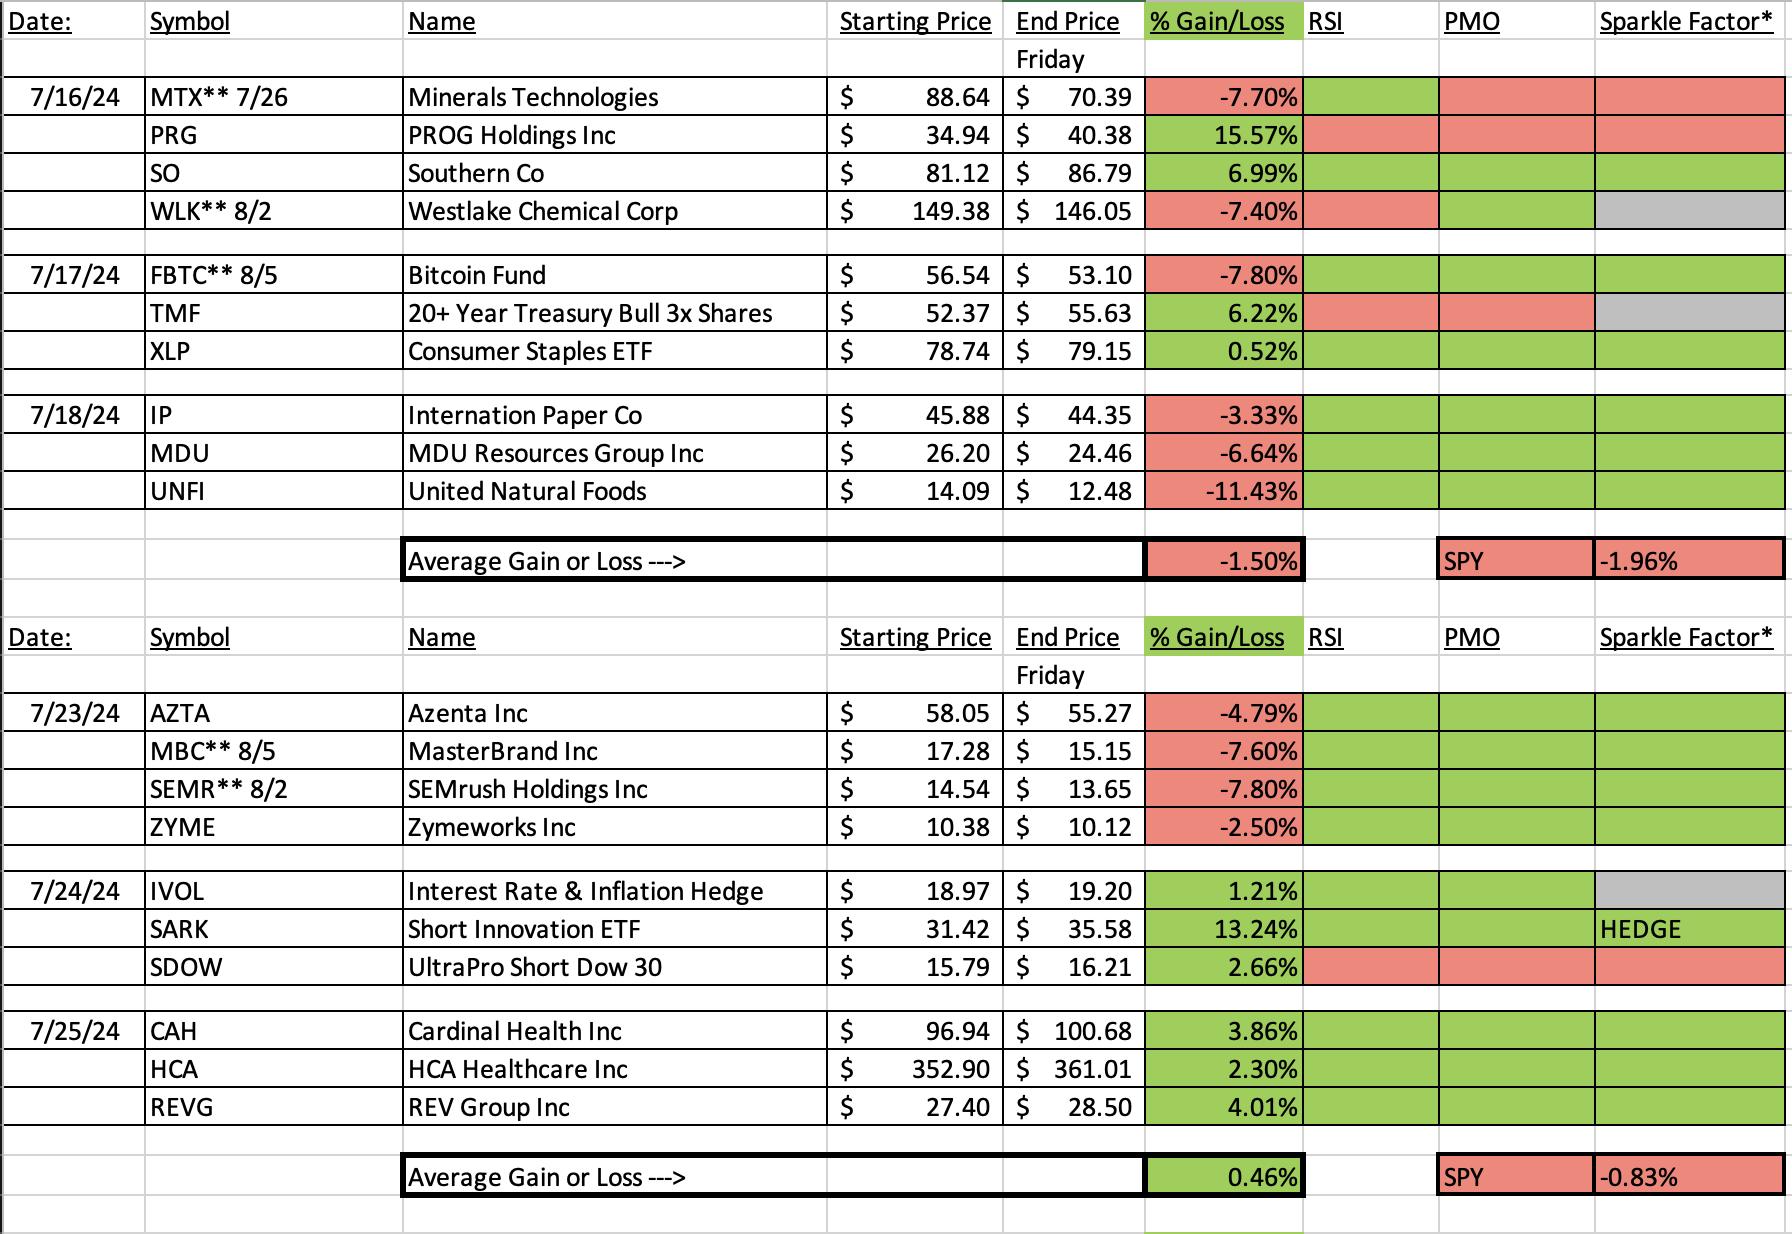
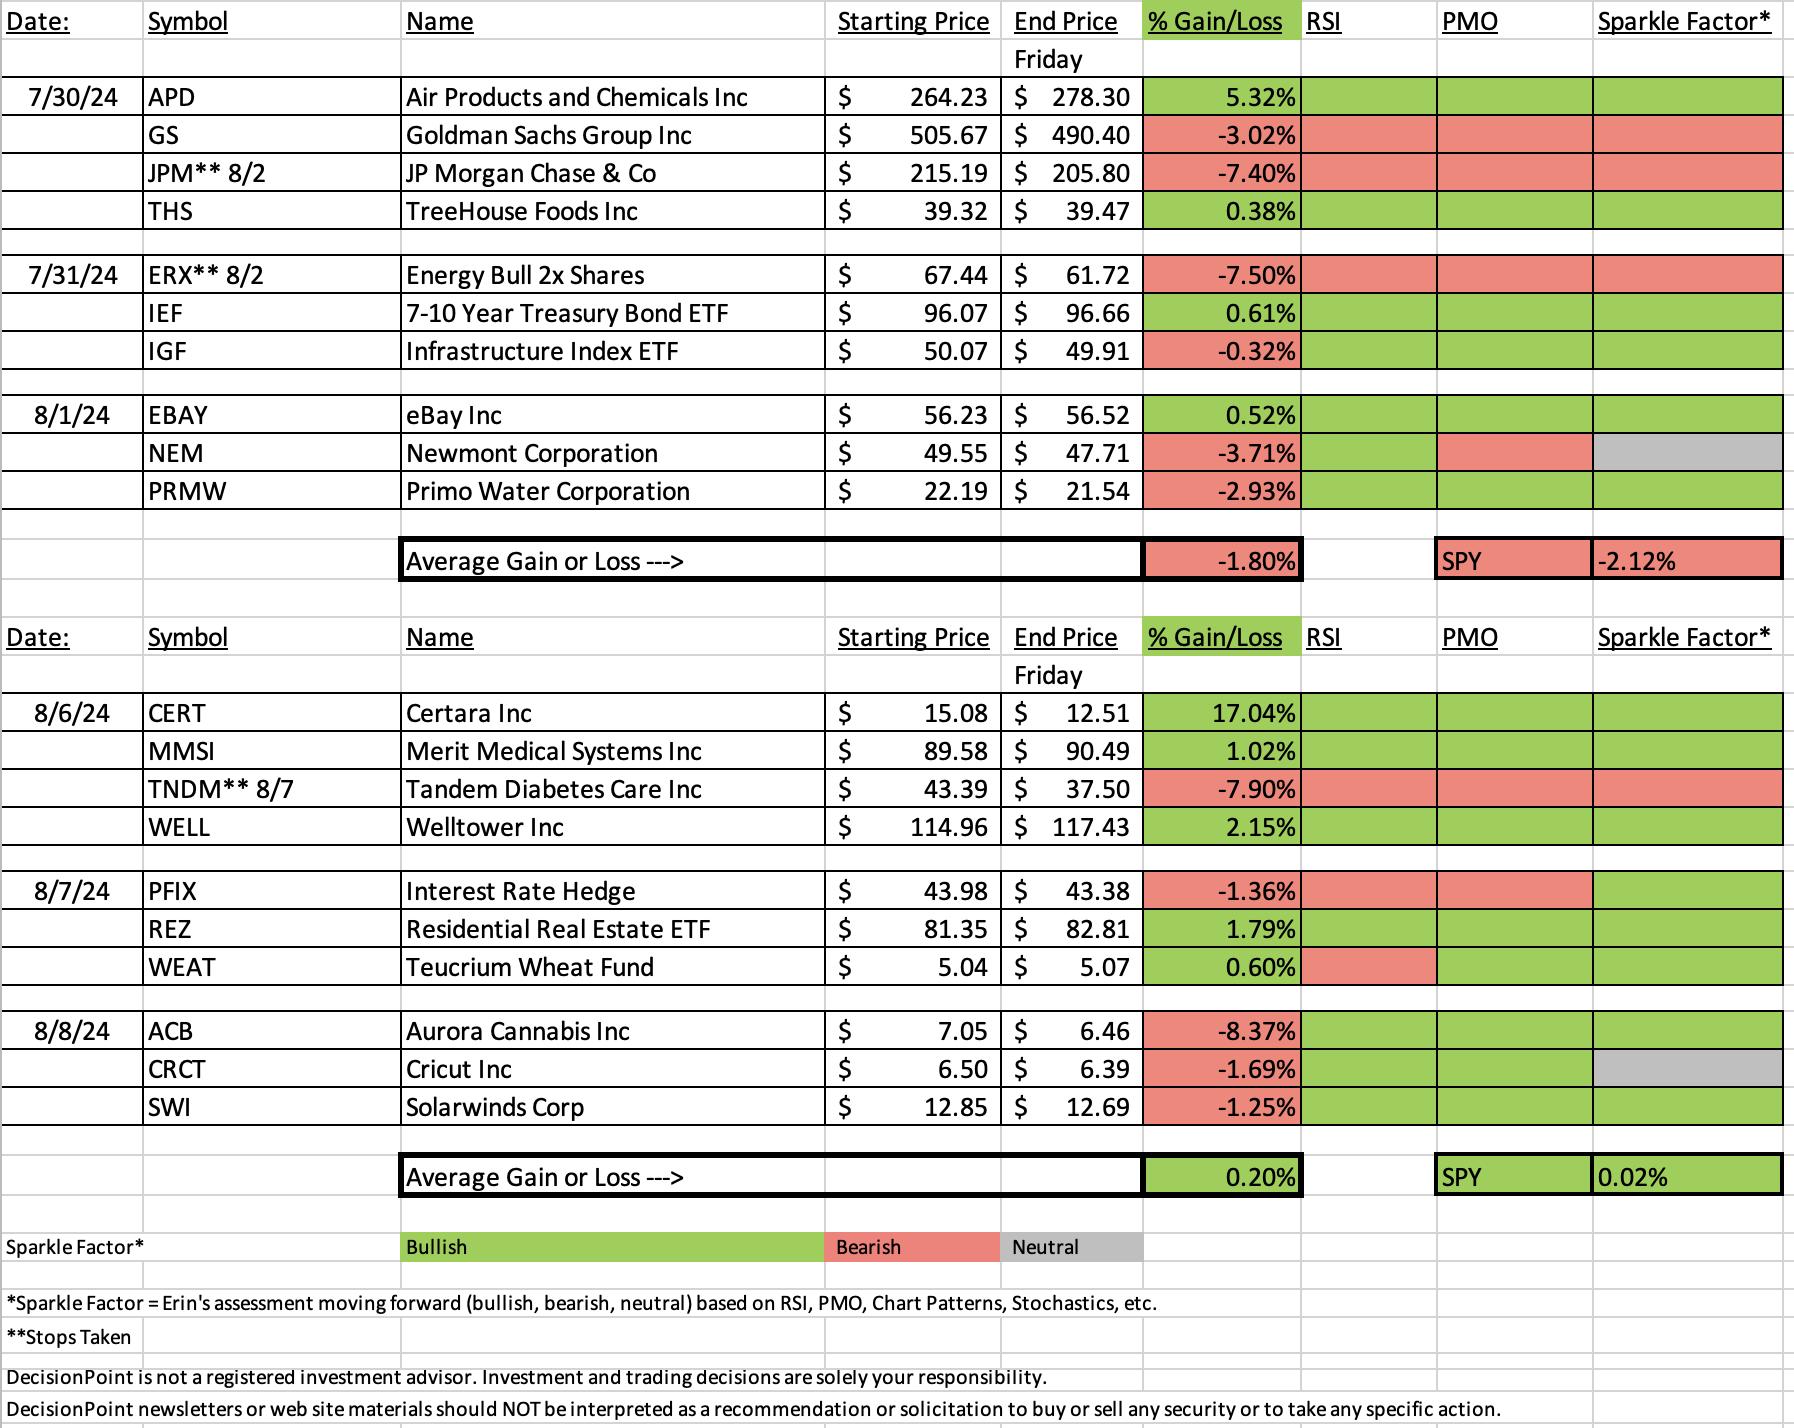
We did see a higher percentage gain than we did on the SPY, but it wasn't the best week ever. What really came through was the short position from Tuesday. Certara Inc (CERT) has been tumbling ever since and still looks very bearish. That position was our Darling for the week.
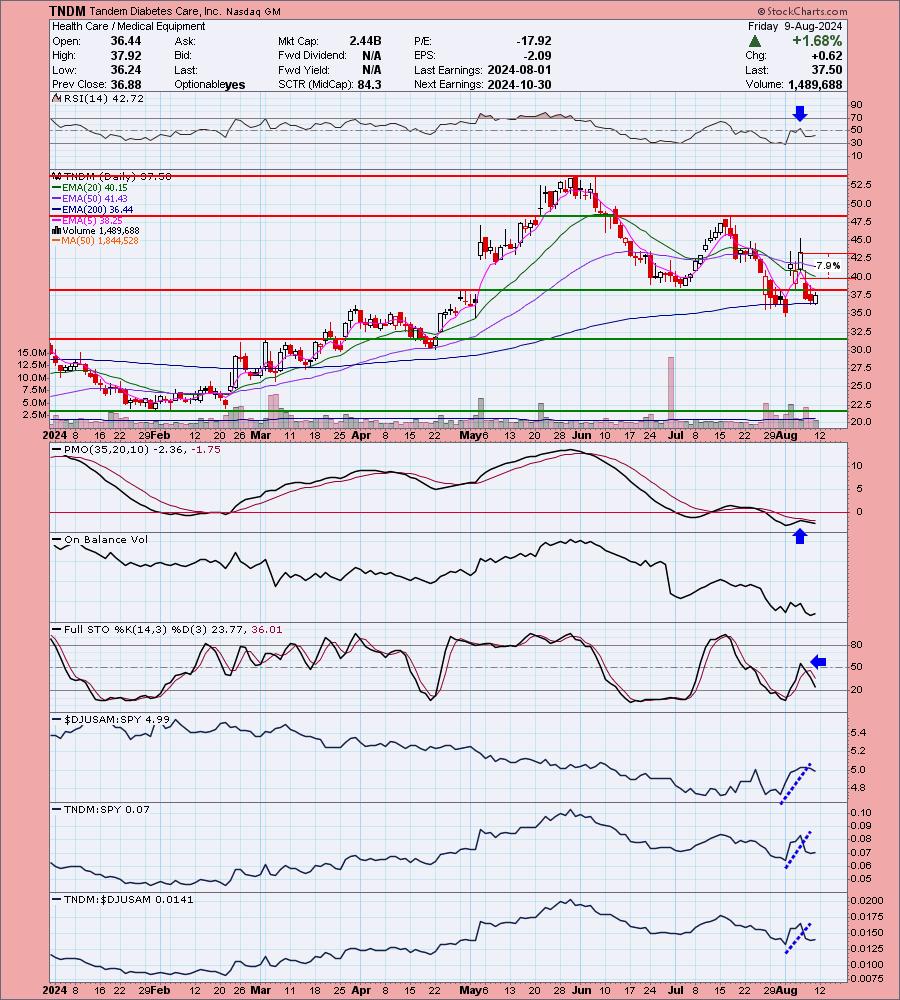
The Dud was Tandem Diabetes (TNDM) which dropped precipitously on Wednesday for no apparent reason. I'll discuss the chart but I must say I didn't see this coming at all. Aurora Cannabis (ACB) could be the Dud, but ultimately TNDM hit its stop and was down further without the stop. ACB is still viable, but you are taking risk as it is very volatile, hence its 10%+ stop level which wasn't hit.
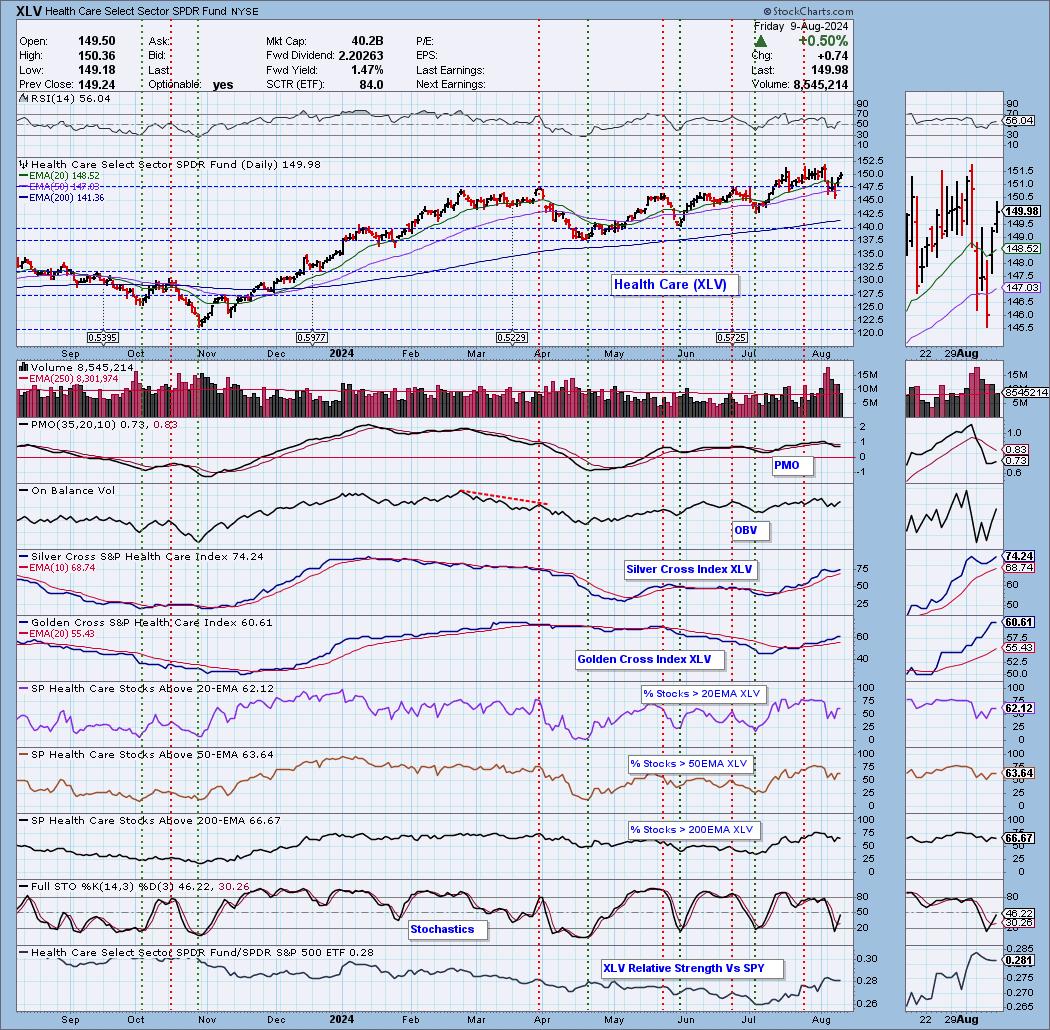
The Sector to Watch this week is Healthcare. It could've been any of the defensive sectors, but we decided we would go with new momentum and look for it to have a good week.
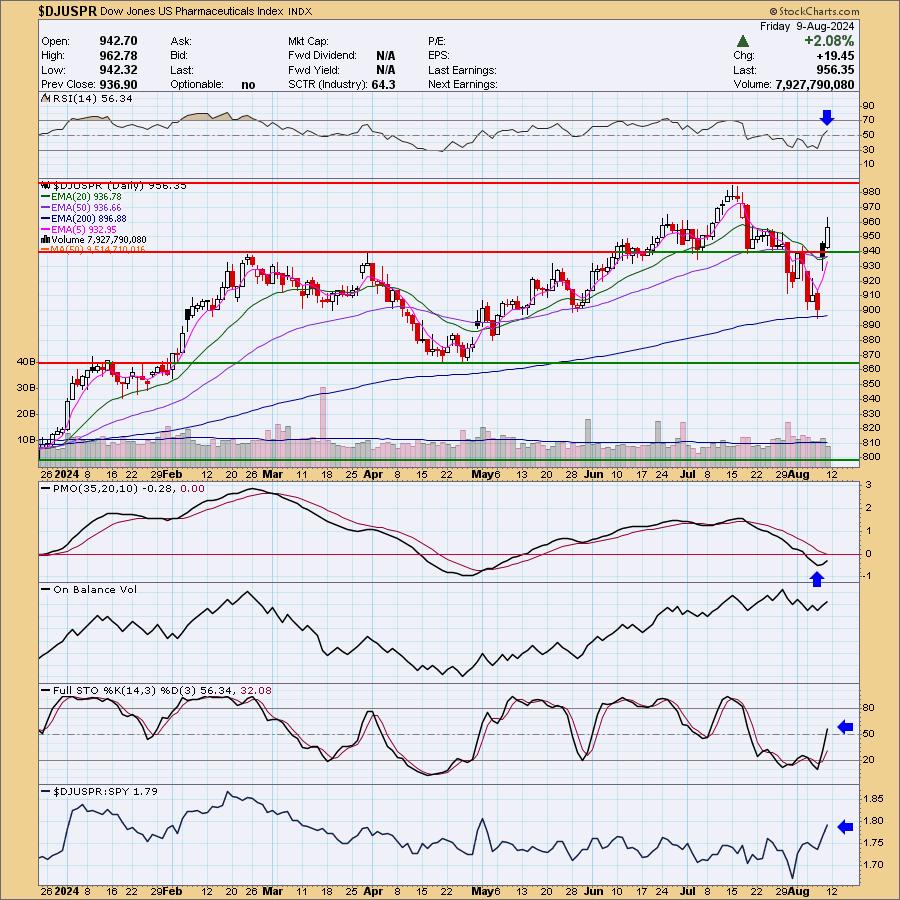
The Industry Group to Watch is Pharmaceuticals. This group has seen some excellent upside movement and should continue to do well. We found the following stocks within this area for your watch lists: AMRX, CPRX, CNTA, AZN, LLY, RDY and SUPN.
We had plenty of time at the end to run some scans to find more stocks for the watch list: PLNT, CRK, TTD, CEG, VST, EBAY, IRM and SOLV.
Have a great weekend! See you in the Monday trading room!
Good Luck & Good Trading,
Erin

Diamond Mine Trading Room:
RECORDING & DOWNLOAD LINK (8/9/2024):
Topic: DecisionPoint Diamond Mine (8/9/2024) LIVE Trading Room
Recording & Download Link
Passcode: August#9
REGISTRATION for 8/16/2024:
When: August 16, 2024 09:00 AM Pacific Time (US and Canada)
Topic: DecisionPoint Diamond Mine LIVE Trading Room
Register in advance for this webinar HERE
After registering, you will receive a confirmation email containing information about joining the webinar.

Below is the latest free DecisionPoint Trading Room recording from 8/5. You'll find these recordings posted on Mondays to our DP YouTube Channel. Be sure and subscribe HERE.
A few items about the spreadsheet: I've put on the spreadsheet whether the RSI is positive (green) or negative (red). The PMO column tells you if it is rising (green) or falling (red). Finally I've added my own "Sparkle Factor" that gives you my assessment going forward, bullish (green), bearish (red) or neutral (gray). The Sparkle Factor is basically my thoughts on whether I expect it to rise or fall. A neutral means it could really go either way so it could be added to a watch list. If you're in a stock I consider "neutral" going forward, the ball is in your court.
Darling:
Certara Inc. (CERT) ** SHORT **
EARNINGS: 2024-08-06 (AMC) ** Reported Today **
Certara, Inc. engages in the provision of software and technology-enabled services for drug developers. It offers cell and gene therapy, clinical pharmacology, complex biologics, decision analytics and modeling, drug development and regulatory strategy, and model-based analysis services. The company was founded on June 27, 2017, and is headquartered in Radnor, PA.
Predefined Scans Triggered: None.
Below are the commentary and chart from Tuesday, 8/6:
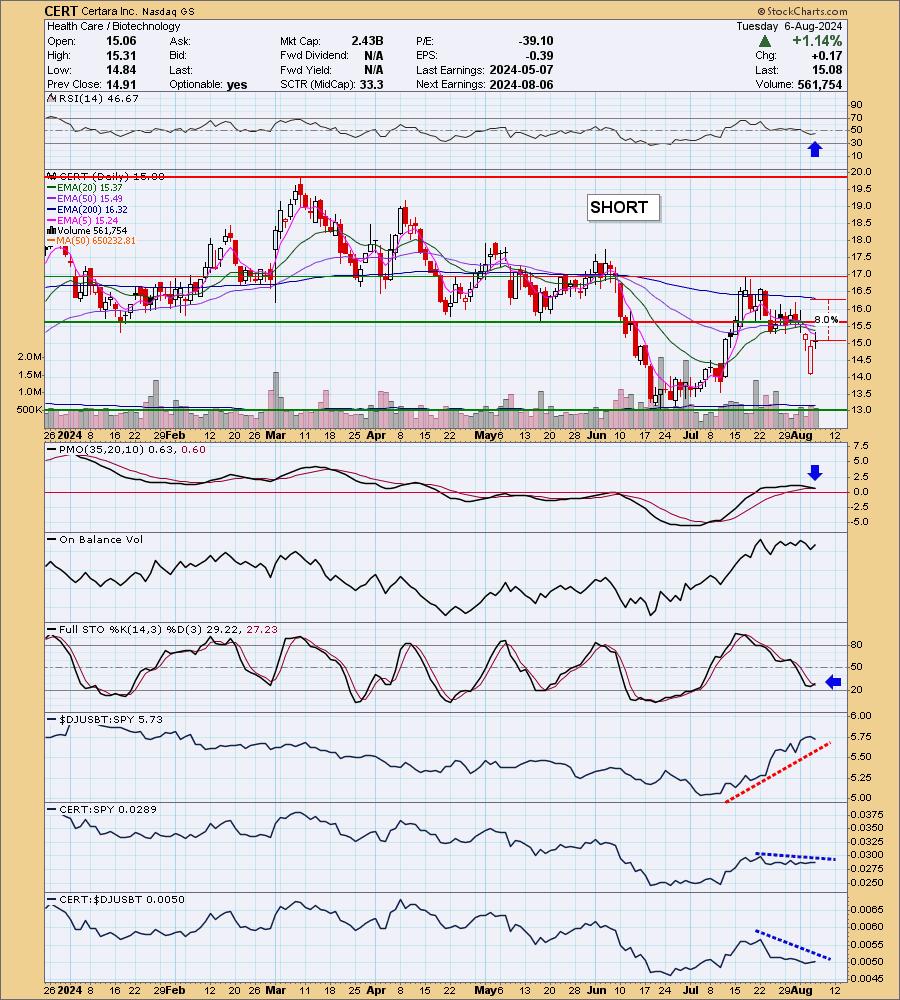
"CERT is down -4.84% in after hours trading on earnings after the bell. This was already lined up to do poorly. It has been is a sharp declining trend and lost important support at the April/May lows. The RSI is negative and the PMO is about to trigger a Crossover SELL Signal. Stochastics did turn up, but they are in negative territory. The industry group is doing well, but CERT is clearly struggling with relative strength. I have set the upside stop at the 200-day EMA at 8% or $16.28."
Here is today's chart:
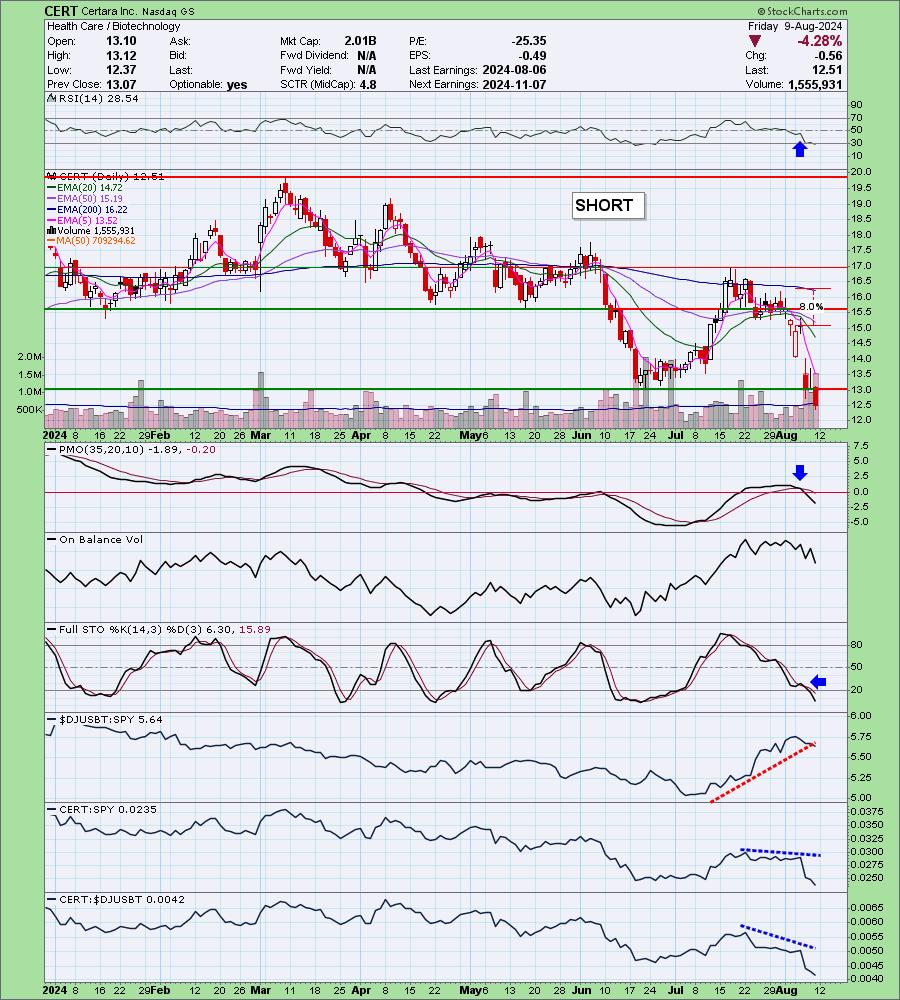
What really went right for this short was that it reported earnings that weren't well received. The stock has been tumbling ever since and it looks ready to move even lower. I don't know how much further it will go, but losing support at the June low tells me it does have more downside to absorb. I did get the benefit of counting the gap down as part of the spreadsheet so I know that those who entered this short may not have seen the same gains. I think you will see more gains.
Don't forget, on Thursdays I look at reader-requested symbols, so shoot me an email at erin@decisionpoint.com. I read every email I receive and try to answer them all!
Dud:
Tandem Diabetes Care, Inc. (TNDM)
EARNINGS: 2024-10-30 (AMC)
Tandem Diabetes Care, Inc. engages in the design, development, and commercialization of products for people with insulin-dependent diabetes. Its products include Tandem Mobi System and t:slim X2 Insulin Pump. The company was founded by Paul M. DiPerna on January 27, 2006, and is headquartered in San Diego, CA.
Predefined Scans Triggered: Bullish MACD Crossovers, Entered Ichimoku Cloud and P&F Double Top Breakout.
Below are the commentary and chart from Tuesday, 8/6:
"TNDM is unchanged in after hours trading. I love the large double bottom that is developing. The stock rallied out of a declining trend on earnings. The RSI just moved into positive territory and the PMO is nearing a Crossover BUY Signal. Stochastics are rising and just hit positive territory. Relative strength studies show strongly rising relative strength lines. I've set the stop as close to support as I could at 7.9% or $39.96."
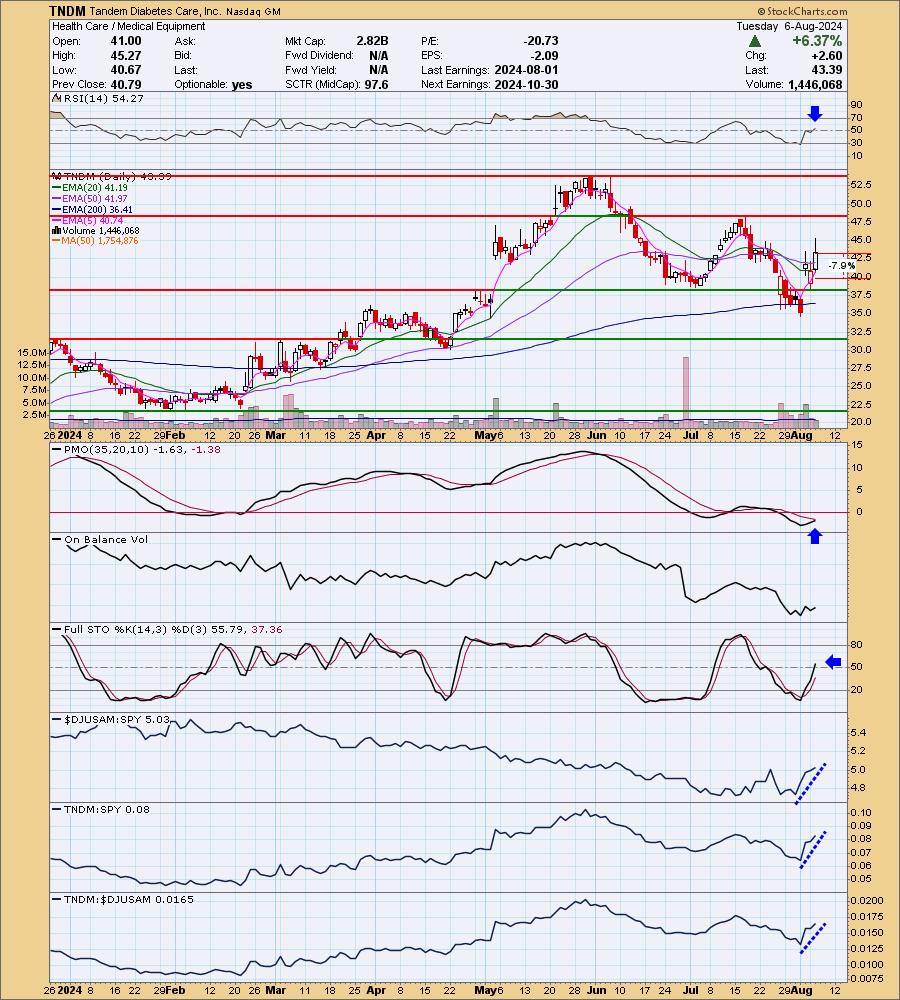
Here is today's chart:
I wish I could tell you what went wrong here, but the chart was very positive. As I did note in the Diamond Mine today, the OBV maybe was signaling weakness as volume was tame on the rally. That would be my diagnosis. It did bounce off the 200-day EMA, but it does have its work cut out. It could set up another double bottom formation, but ultimately I don't think I would want to chance this even though it is in the Sector to Watch.
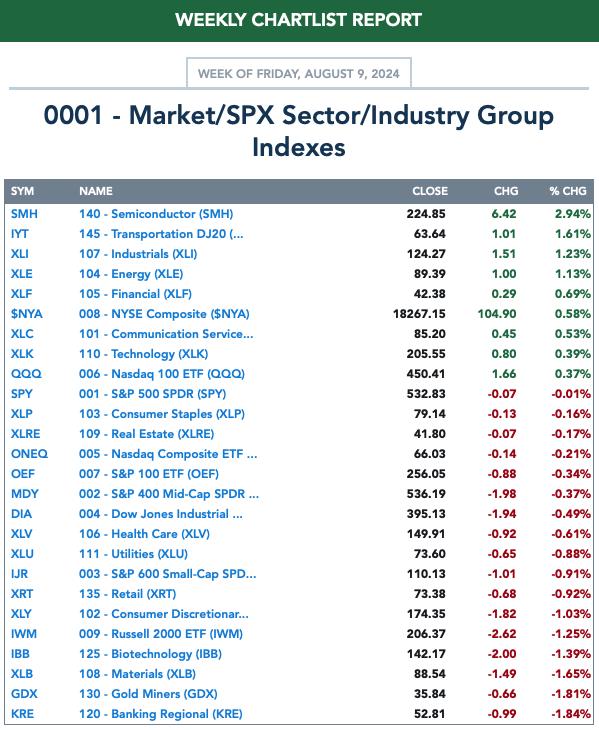
THIS WEEK's Performance:
DecisionPoint Market Scoreboard (Mechanical Trend Model Signals):
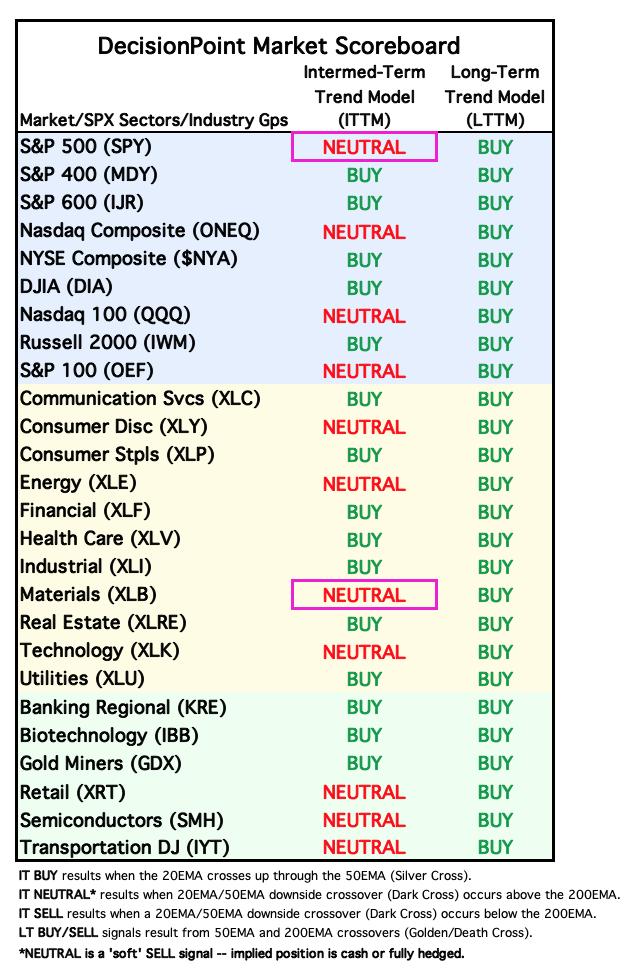
Friday signal changes are outlined in purple.
Click Here to view Carl's annotated "Under the Hood" ChartList!
Sector to Watch: Healthcare (XLV)
It isn't the most exciting chart, but I do like that price came down and tested support at rebounded from there. The other thing that sparked my interest was the rising Silver Cross Index which recently bottomed above the signal line. Participation is above average and could support more rally. The PMO has just turned back up for new momentum and the RSI is not overbought. This one will be worth a watch going into next week.
Industry Group to Watch: Pharmaceuticals ($DJUSPR)
There is an ETF for Pharma (XPH), but it doesn't look very bullish so while I did pick this one, it was based off the chart below not XPH. We are seeing a rally off a breakaway gap. The RSI is positive and the PMO has just turned back up. Stochastics are rising. You could certainly check out XPH, but it doesn't seem to be telling us the whole story as its weighting must be working against it right now.
Go to our Under the Hood ChartList on DecisionPoint.com to get an in-depth view of all the sectors. On StockCharts.com you can find the Industry Summary.
Good Luck & Good Trading!
- Erin
erin@decisionpoint.com
Full Disclosure: I'm 20% long, 0% short.
Watch the latest episode of the DecisionPoint Trading Room with Carl & Erin Swenlin on Mondays 3:00p EST!
Technical Analysis is a windsock, not a crystal ball. --Carl Swenlin
NOTE: The stocks reported herein are from mechanical trading model scans that are based upon moving average relationships, momentum and volume. DecisionPoint analysis is then applied to get selections from the scans. The selections given should prompt readers to do a chart review using their own analysis process. This letter is not a call for a specific action to buy, sell or short any of the stocks provided. There are NO sure things or guaranteed returns on the selection of "diamonds in the rough."
Helpful DecisionPoint Links:
DecisionPoint Shared ChartList and DecisionPoint Chart Gallery
Price Momentum Oscillator (PMO)
Swenlin Trading Oscillators (STO-B and STO-V)
(c) Copyright 2024 DecisionPoint.com