
It was a very good week for "Diamonds in the Rough" with only one out of 10 down on the week. The spreadsheet itself has improved a great deal as well as many of the stocks in doldrums woke up on the broader market rally that is ensuing.
This week's Darling was up 7.71%! It was closely followed by another gain of 7.19% by the runner-up.
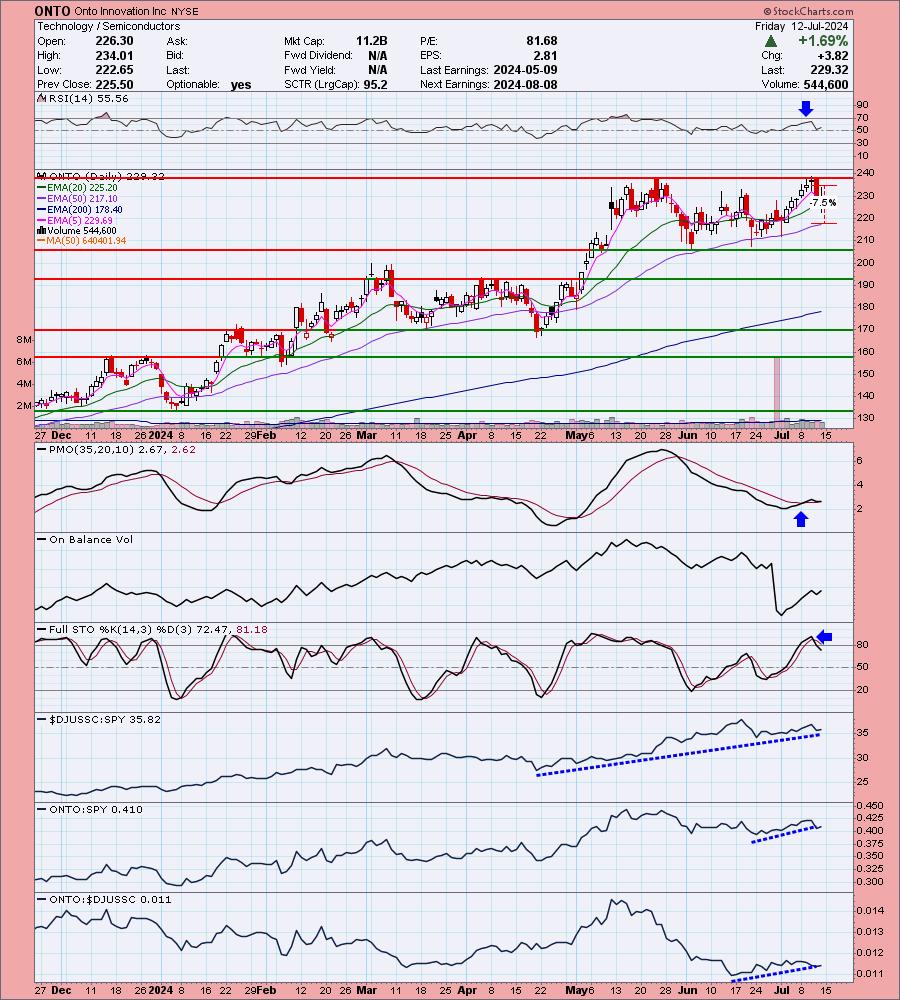
The Dud was ONTO, a Semiconductor. Those do appear to be pulling back somewhat so I would be careful with that group. Even though ONTO had been outperforming the group, it suffered losses.
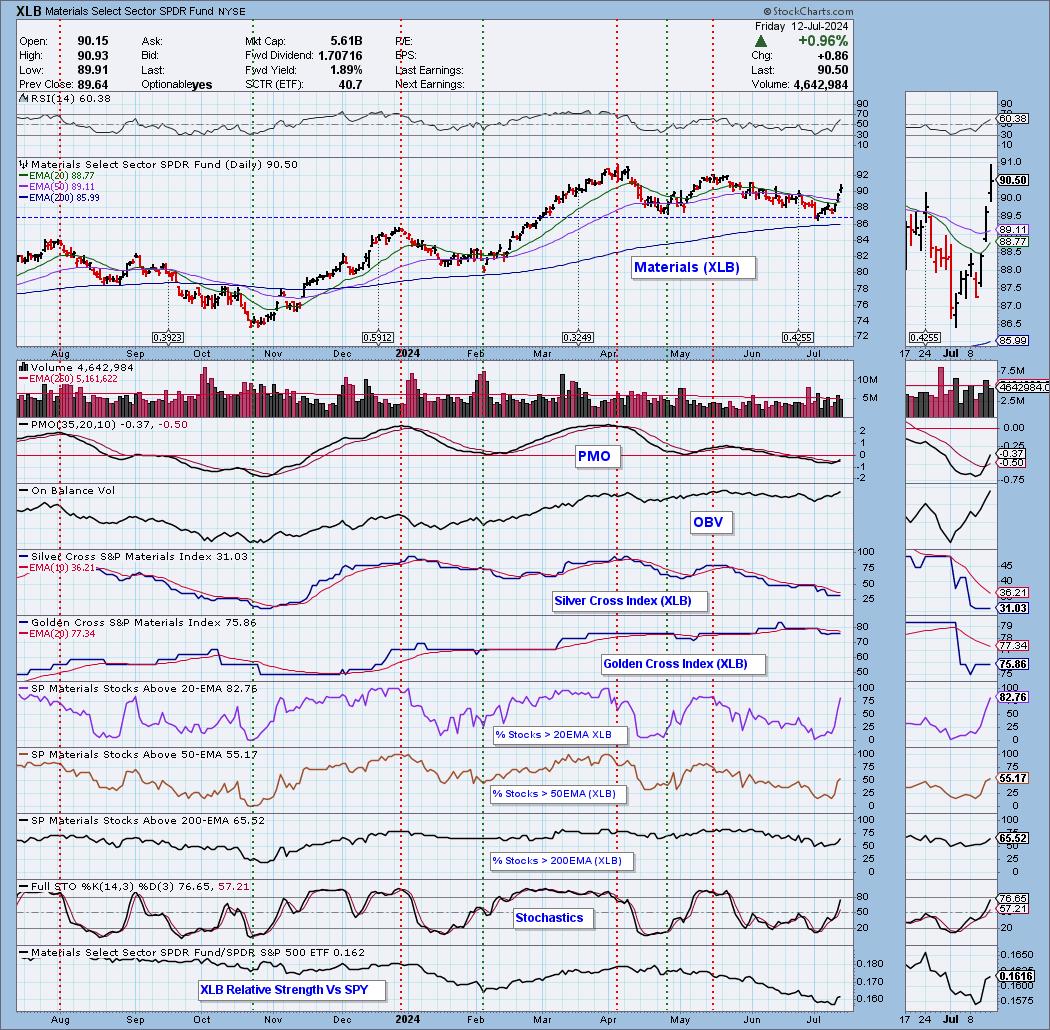
The Sector to Watch was difficult to come up with today. Real Estate (XLRE) looks good on its current rally likely spurred on by lower interest rates. How long that will last is hard to say, but I do see rates continuing lower in the future. We had about five sectors that could've won the day but ultimately I picked Materials (XLB) due to the falling Dollar.
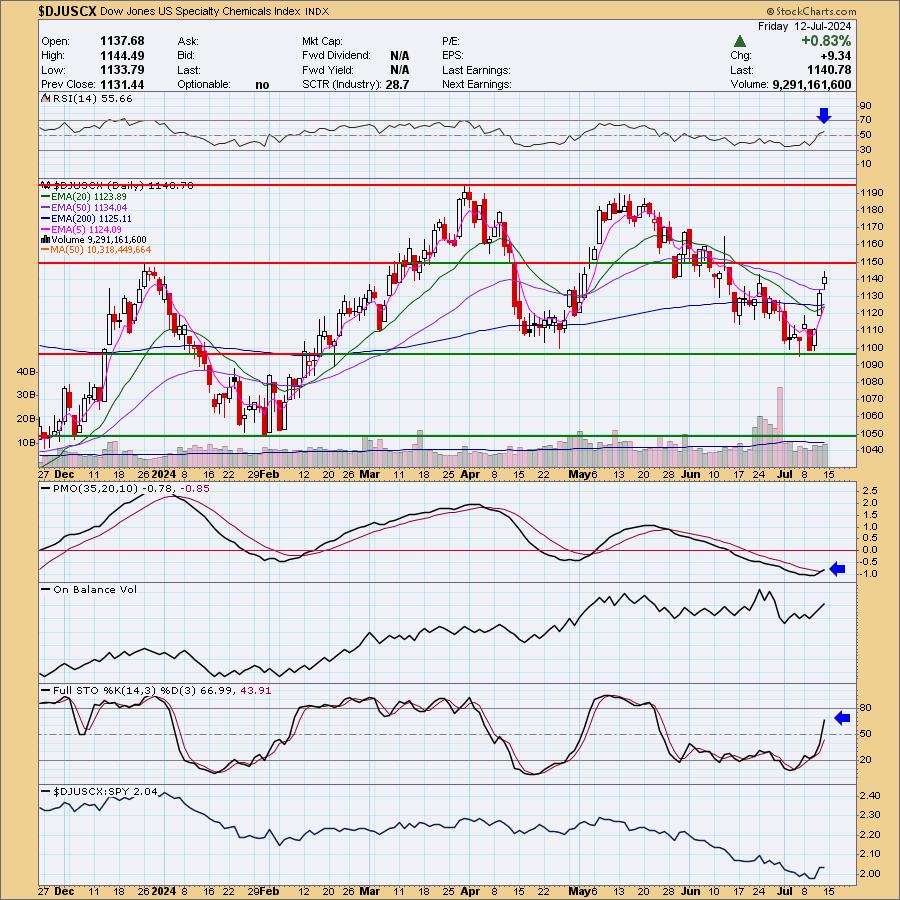
The Industry Group to Watch was Specialty Chemicals which are making a nice break from a declining trend. Some symbols we mined from this area were: KRO, VVV, ESI, FF and ECL. Some look better than others but ultimately we found quite a few possibles from this group.
I ran the Momentum Sleepers Scan at the end of the trading room and found quite a few symbols with promise going into next week: AZO, AMCR, OC, EMN, CWEN, NXT, PWR and SEE.
Have a great weekend! See you in the Monday trading room!
Good Luck & Good Trading,
Erin

RECORDING & DOWNLOAD LINK (7/12/2024):
Topic: DecisionPoint Diamond Mine (7/12/2024) LIVE Trading Room
Download & Recording LINK
Passcode: July#12th
REGISTRATION for 7/19/2024:
When: July 19, 2024 09:00 AM Pacific Time (US and Canada)
Topic: DecisionPoint Diamond Mine LIVE Trading Room
Register in advance for this webinar HERE.
After registering, you will receive a confirmation email containing information about joining the webinar.

Below is the latest free DecisionPoint Trading Room recording from 7/8. You'll find these recordings posted on Mondays to our DP YouTube Channel. Be sure and subscribe HERE.
A few items about the spreadsheet: I've put on the spreadsheet whether the RSI is positive (green) or negative (red). The PMO column tells you if it is rising (green) or falling (red). Finally I've added my own "Sparkle Factor" that gives you my assessment going forward, bullish (green), bearish (red) or neutral (gray). The Sparkle Factor is basically my thoughts on whether I expect it to rise or fall. A neutral means it could really go either way so it could be added to a watch list. If you're in a stock I consider "neutral" going forward, the ball is in your court.
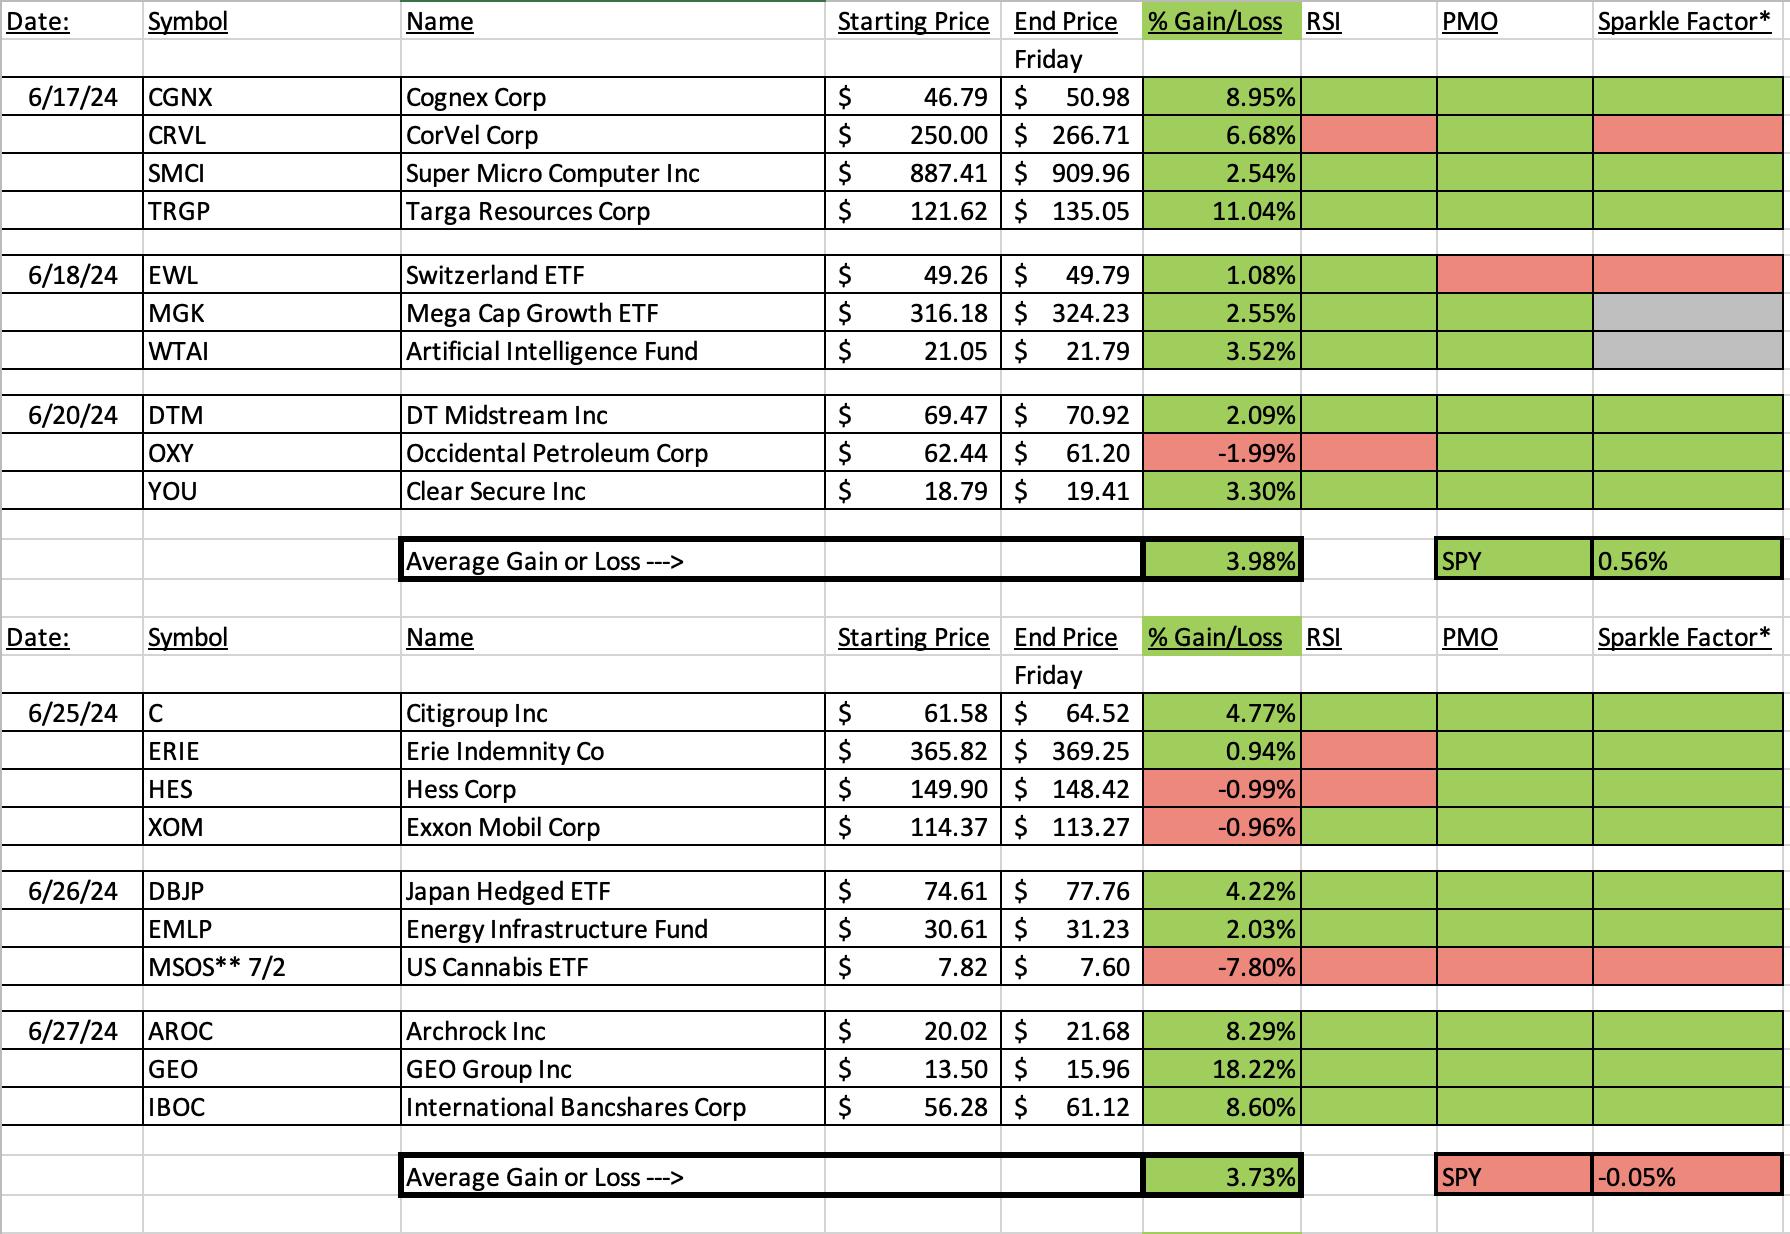
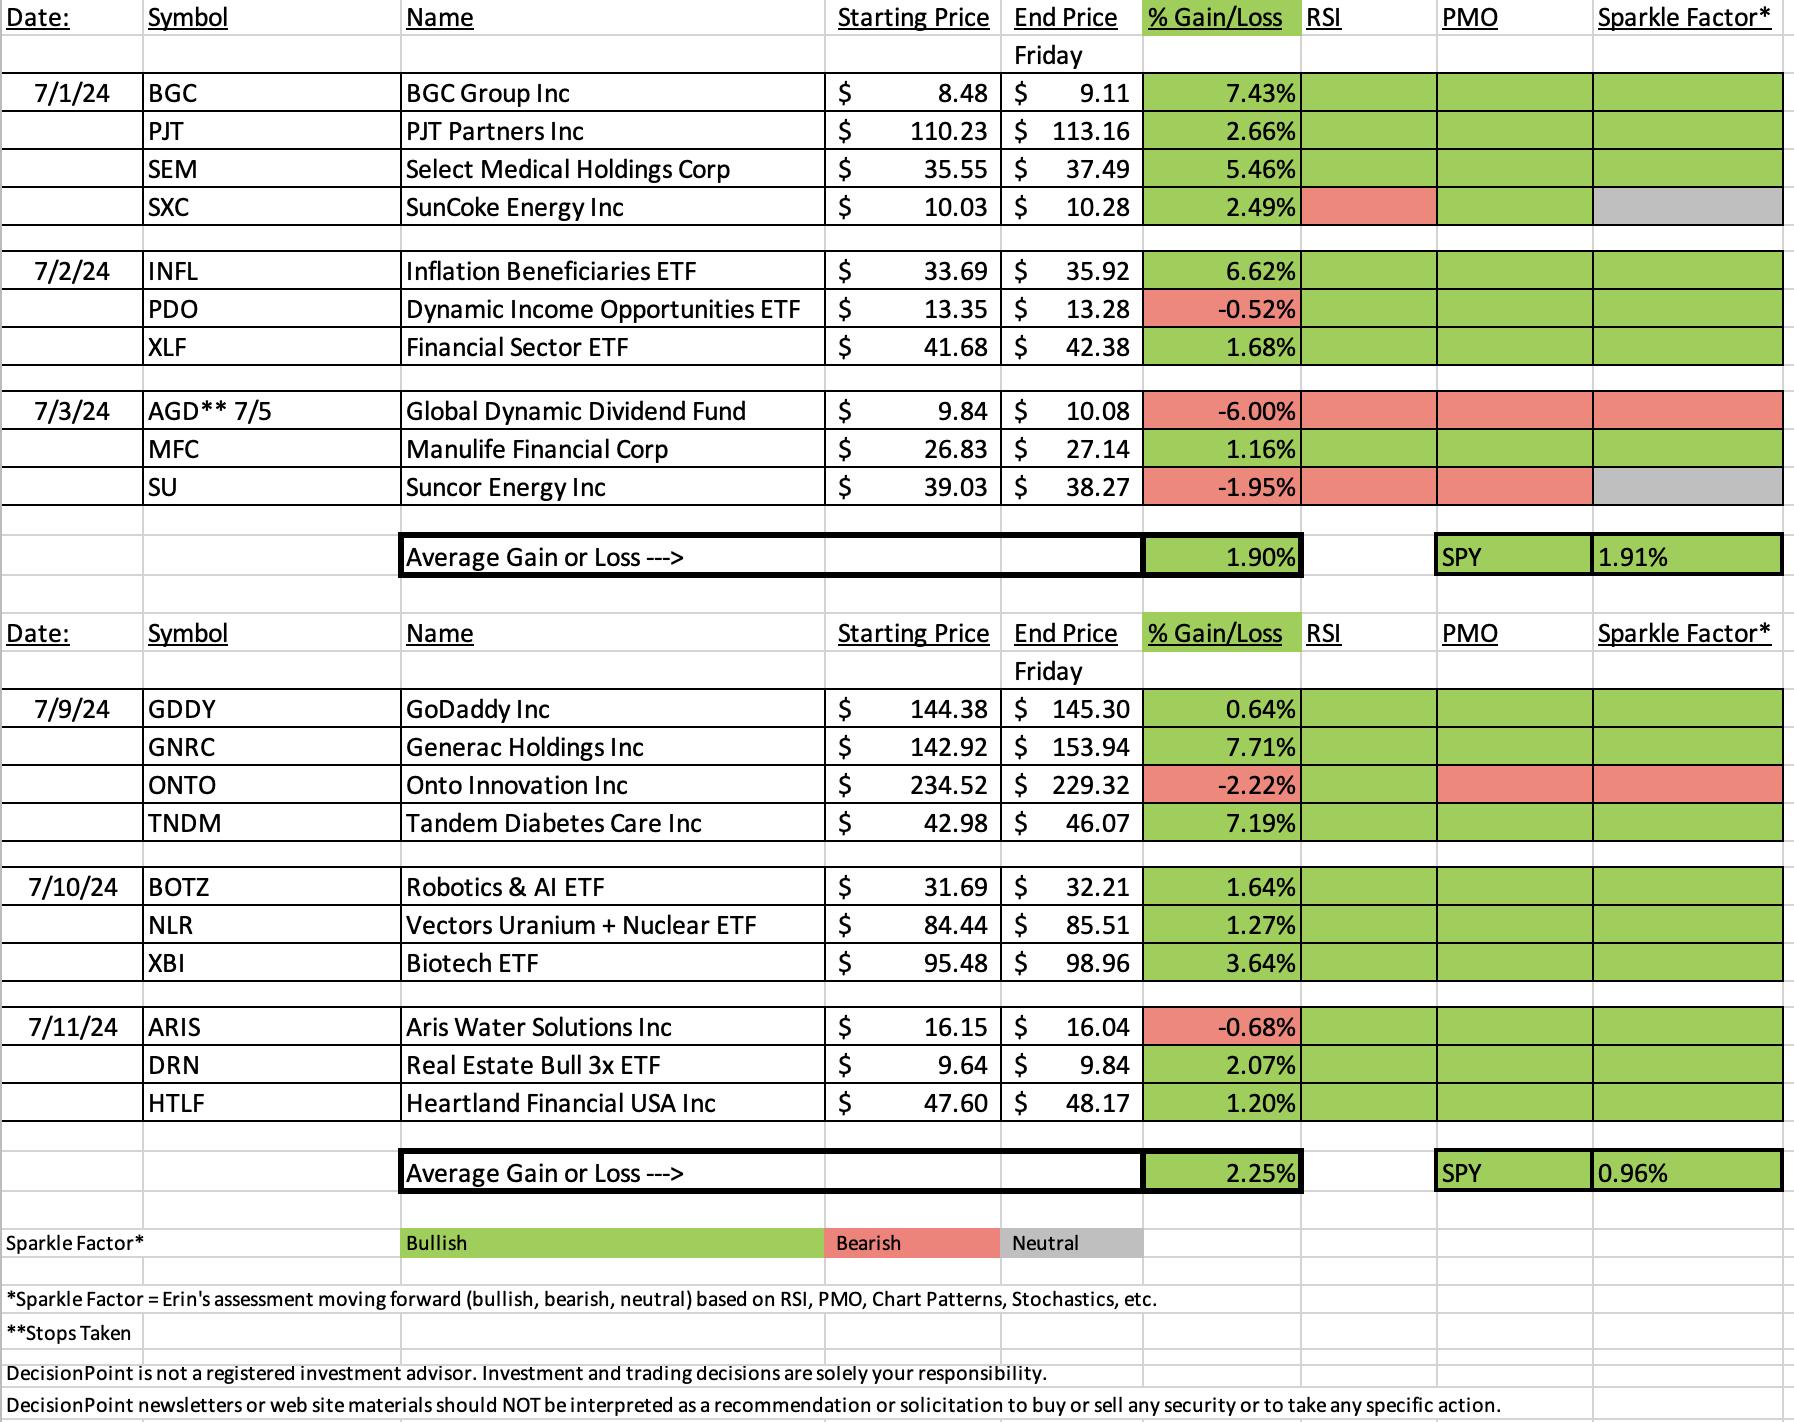
Darling:
Generac Holdings Inc. (GNRC)
EARNINGS: 2024-07-31 (BMO)
Generac Holdings, Inc. engages in the business of designing and manufacturing energy technology solutions. It operates under the Domestic and International segments. The Domestic segment includes the legacy Generac business and the acquisitions that are based in the United States and Canada. The International segment focuses on Generac business' Latin American export operations. The company was founded in 1959 and is headquartered in Waukesha, WI.
Predefined Scans Triggered: P&F Double Top Breakout.
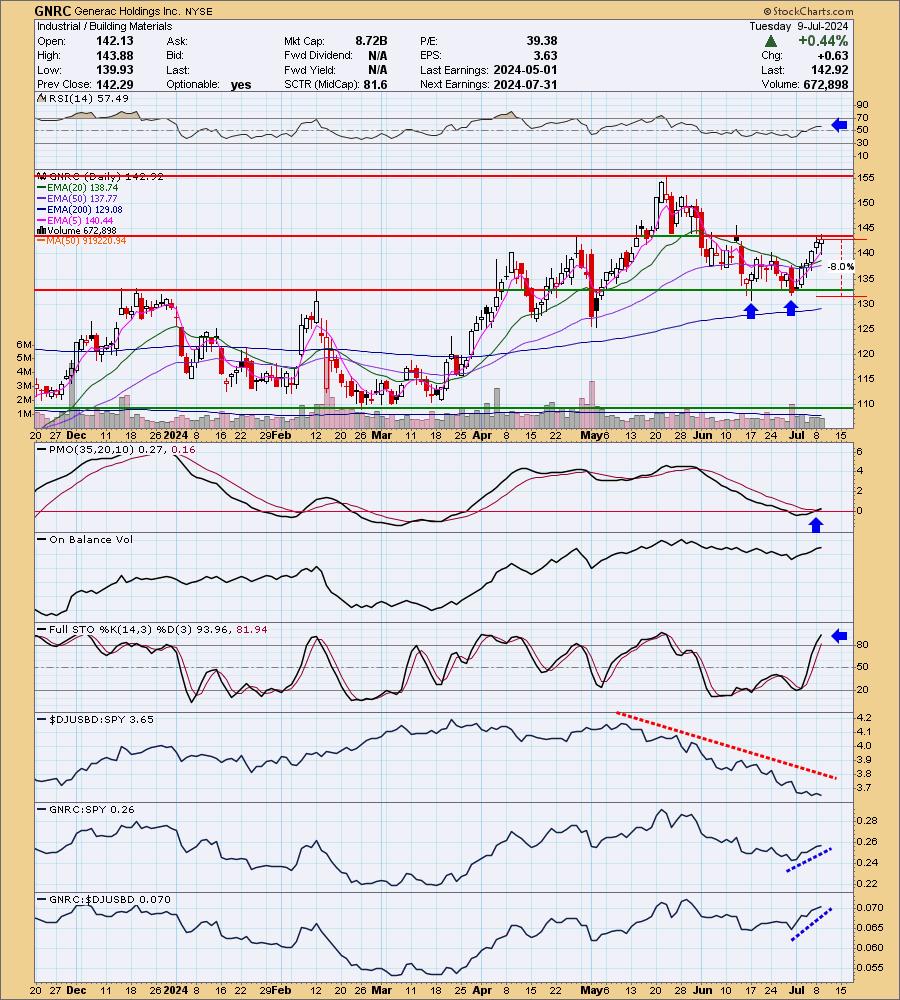
Below are the commentary and chart from Tuesday, 7/9:
"GNRC is up +0.76% in after-hours trading. I note a short-term bullish double bottom on the chart. Price got above the confirmation line at the middle of the "W". The height of the pattern would put price around $150, but I think if it gets to that level it will continue to move toward overhead resistance. The RSI is positive and not overbought. There is a new PMO Crossover BUY Signal. The OBV is confirming the rally and Stochastics are rising above 80. The industry group isn't doing well right now, no denying it. However, GNRC is holding its own against the SPY and the group. I've set the stop below the double bottom at 8% or $131.48."
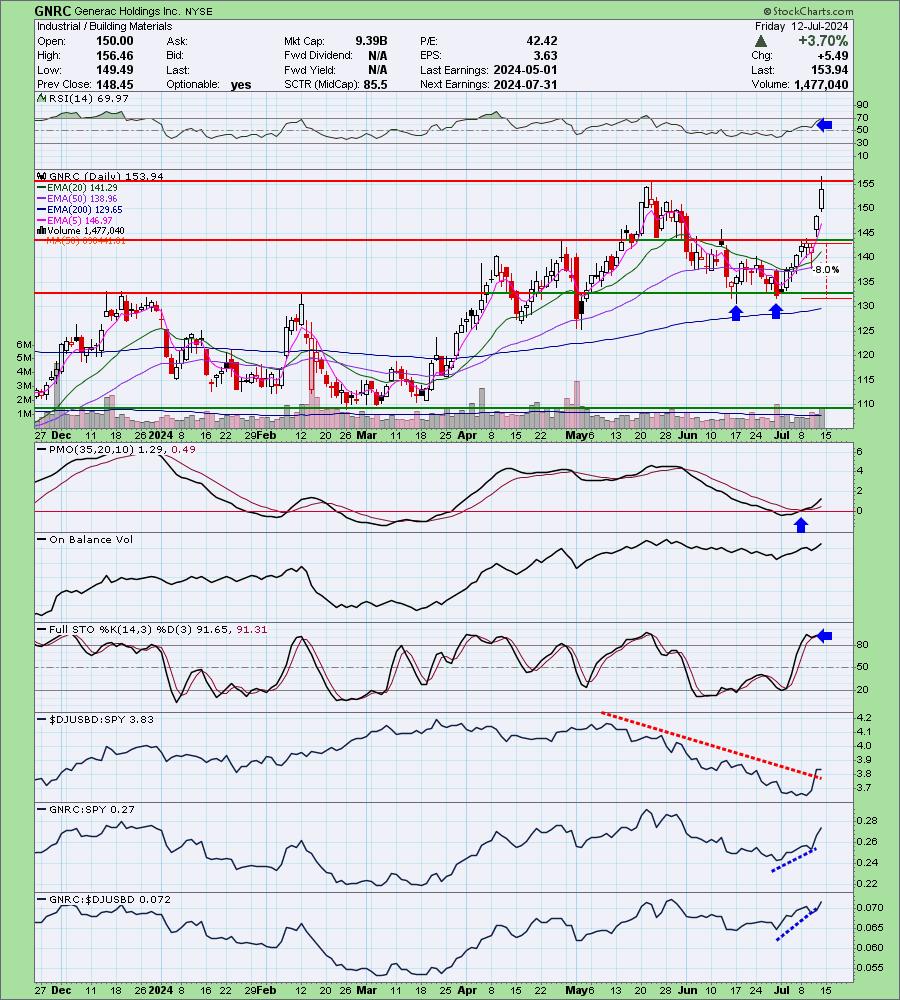
Here is today's chart:
This one took off. The chart technicals were behind it but the thrust upward was a bit of a surprise. It isn't quite overbought yet, but entry right now may be a little bit late. It did stop at overhead resistance which is a good place to see a pullback or pause. That would offer a better entry. Everything is going right on the chart, we even see that relative strength is picking up for the group itself. I like it moving forward.
Don't forget, on Thursdays I look at reader-requested symbols, so shoot me an email at erin@decisionpoint.com. I read every email I receive and try to answer them all!
Dud:
Onto Innovation Inc (ONTO)
EARNINGS: 2024-08-08 (AMC)
Onto Innovation, Inc. engages in the business of designing, developing, manufacturing, and supporting high-performance control metrology, defect inspection, lithography, and data analysis systems used by microelectronics device manufacturers. The firm is also involved in providing process and yield management solutions used in bare silicon wafer production and wafer processing facilities. The company was founded in 1940 and is headquartered in Wilmington, MA.
Predefined Scans Triggered: P&F Double Top Breakout, New 52-week Highs, Stocks in a New Uptrend (ADX) and P&F Spread Triple Top Breakout.
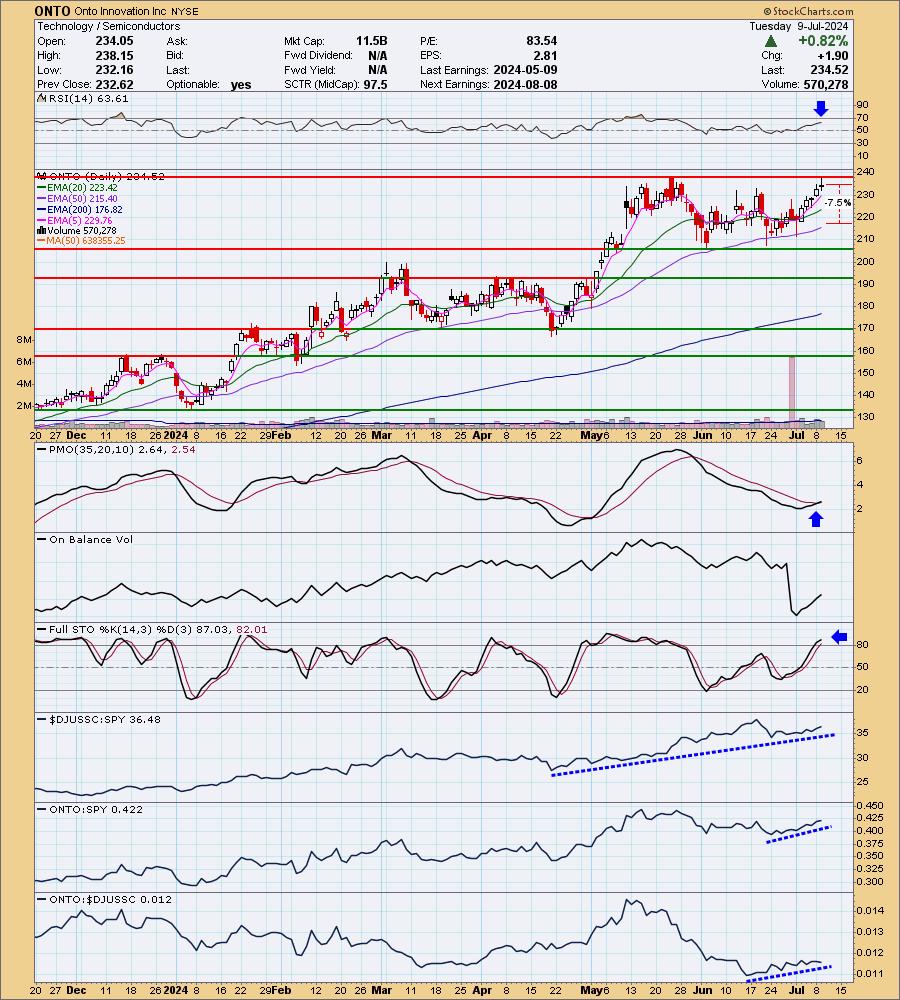
Below are the commentary and chart from Tuesday, 7/9:
"ONTO is up +0.35% in after-hours trading. It hasn't broken out yet, but given the indicators, it should. The RSI is positive and not at all overbought. There is a new PMO Crossover BUY Signal and Stochastics are above 80. Relative strength is rising for the group still and ONTO is outperforming it and the market. Semiconductors are mostly overbought, but according to the RSI this one isn't. The stop is set at the 50-day EMA at 7.5% or $216.93."
Here is today's chart:
This one is a victim of an industry group that had a bad week. It has set up bearish double tops on most of the charts so as noted in the opening, be careful with this group. I don't like the chart as much anymore with the triple top in force right now. The PMO is still falling despite today's rally. It could right itself, but given Stochastics have topped and we have a bearish chart pattern, I would likely avoid this group for now. It needs a break.
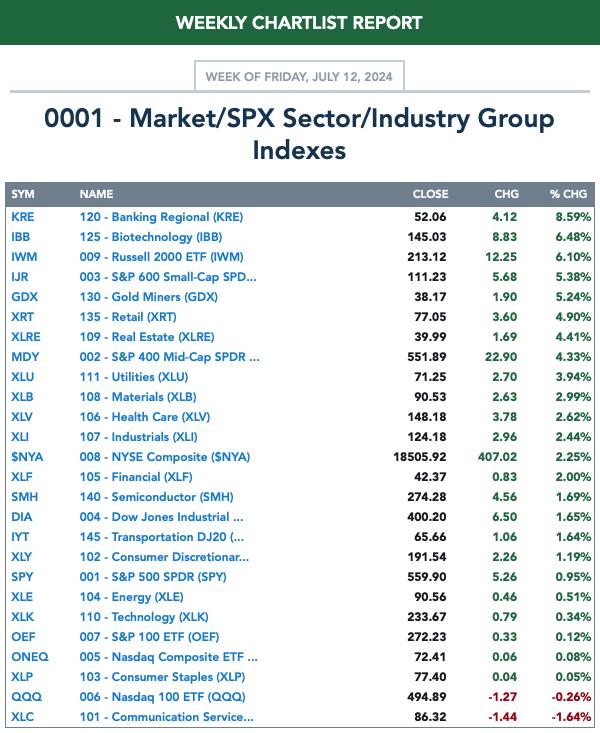
THIS WEEK's Performance:
DecisionPoint Market Scoreboard (Mechanical Trend Model Signals):
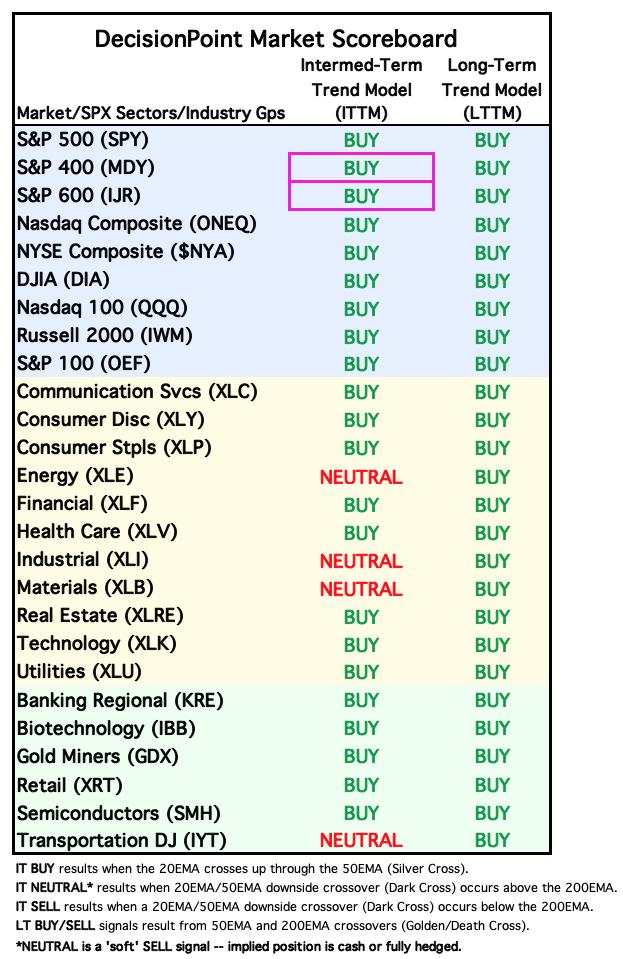
Friday signal changes are outlined in purple.
Click Here to view Carl's annotated "Under the Hood" ChartList!
Sector to Watch: Materials (XLB)
As noted in the opening, you could pick any number of sectors this week as one to watch but I really like what XLB is doing under the hood. The double top formation looks less formidable as price is breaking out of the declining trend. A falling Dollar should also help this sector out. The RSI is not overbought and the PMO is on a new Crossover BUY Signal. Participation has shot up and that should get the Silver Cross Index to rise again. We can see strong Stochastics and new outperformance by the sector against the SPY.
Industry Group to Watch: Specialty Chemicals ($DJUSCX)
There were quite a few groups that are looking good, but I picked this one mainly because it looks like XLB and I have high hopes for it. This is an excellent break from a declining trend. It appears it is ready to head back to the top of the trading range. The RSI is positive and not at all overbought. The PMO is on a Crossover BUY Signal and Stochastics are rising strongly. Even the OBV is confirming this rally as it is in its own rising trend. Some symbols for consideration: KRO, VVV, ESI, FF and ECL.
Go to our Under the Hood ChartList on DecisionPoint.com to get an in-depth view of all the sectors. On StockCharts.com you can find the Industry Summary.
Good Luck & Good Trading!
- Erin
erin@decisionpoint.com
Full Disclosure: I'm 40% long, 0% short.
Watch the latest episode of the DecisionPoint Trading Room with Carl & Erin Swenlin on Mondays 3:00p EST!
Technical Analysis is a windsock, not a crystal ball. --Carl Swenlin
NOTE: The stocks reported herein are from mechanical trading model scans that are based upon moving average relationships, momentum and volume. DecisionPoint analysis is then applied to get selections from the scans. The selections given should prompt readers to do a chart review using their own analysis process. This letter is not a call for a specific action to buy, sell or short any of the stocks provided. There are NO sure things or guaranteed returns on the selection of "diamonds in the rough."
Helpful DecisionPoint Links:
DecisionPoint Shared ChartList and DecisionPoint Chart Gallery
Price Momentum Oscillator (PMO)
Swenlin Trading Oscillators (STO-B and STO-V)
(c) Copyright 2024 DecisionPoint.com