
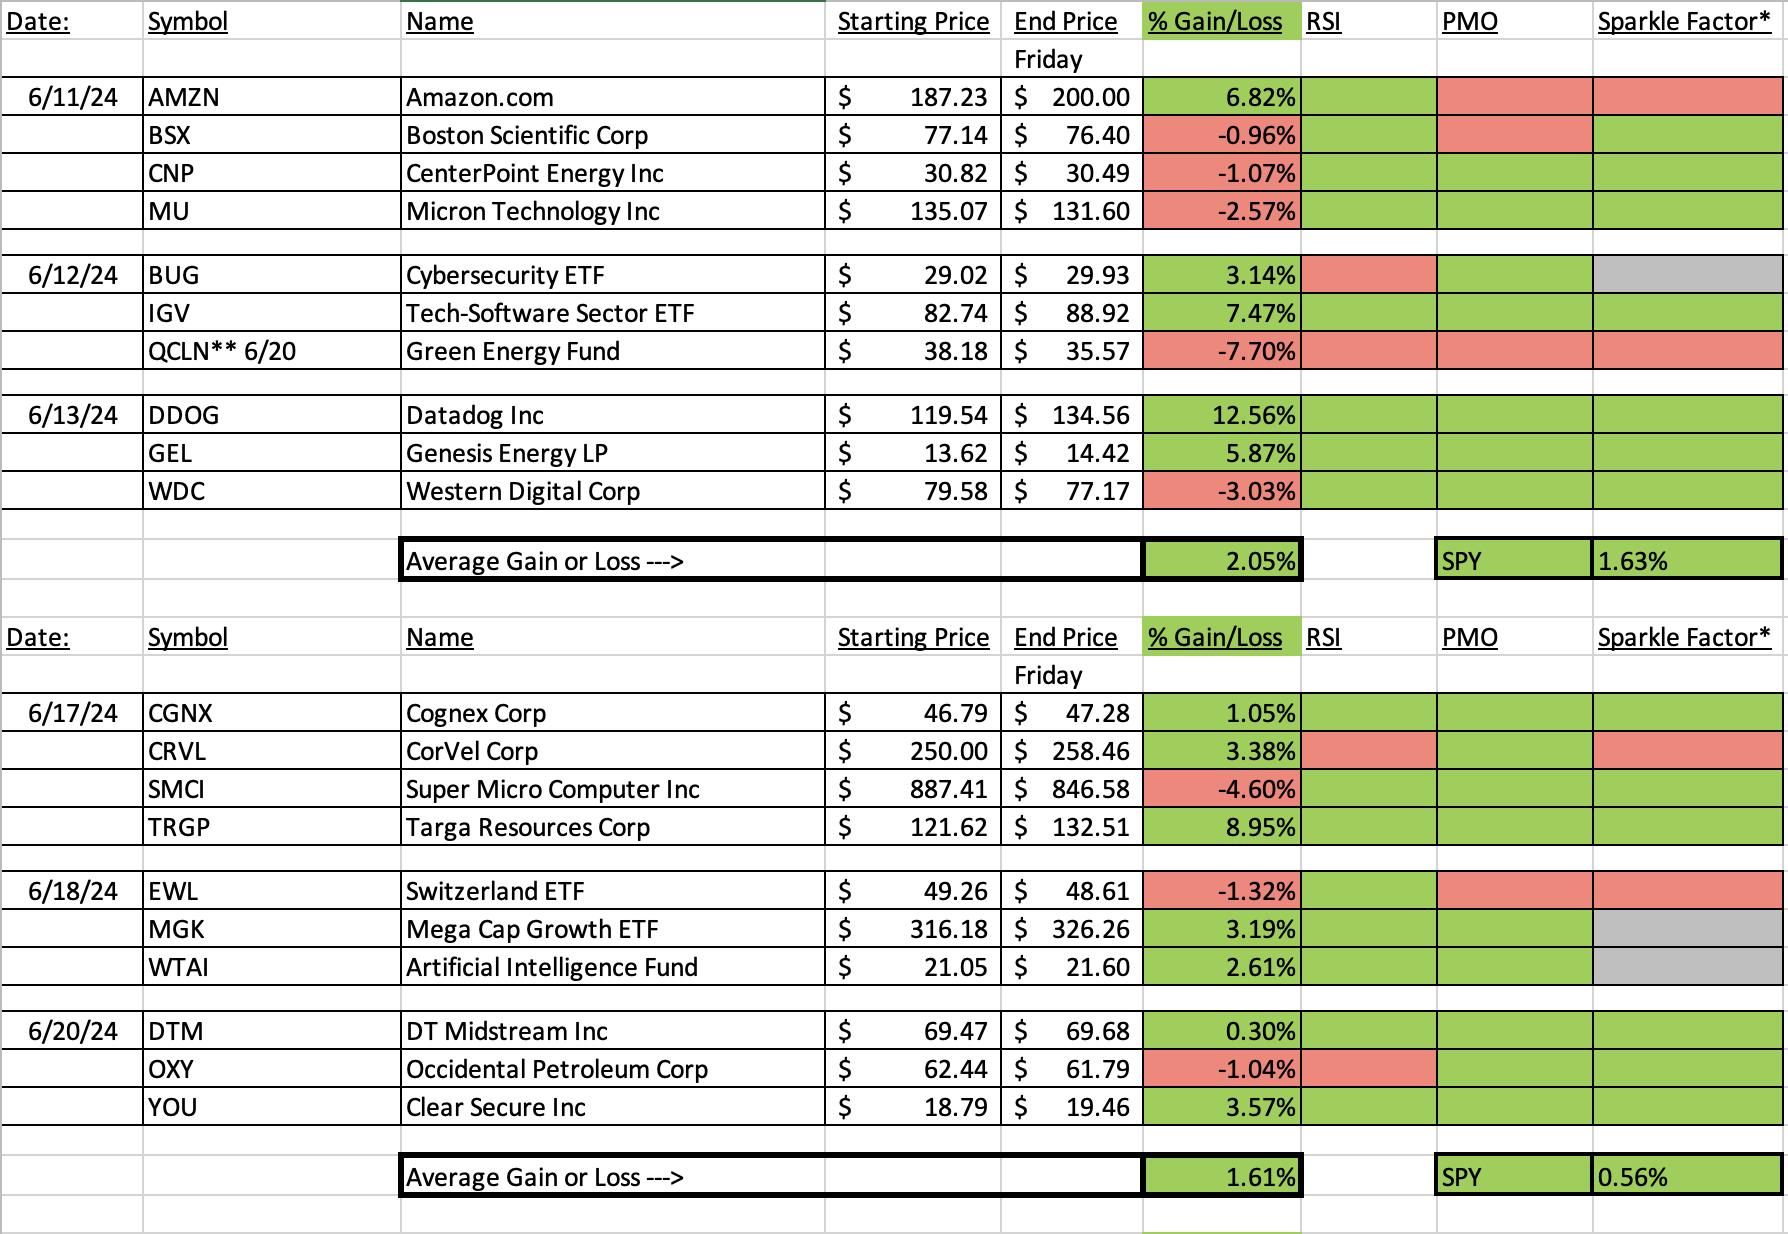
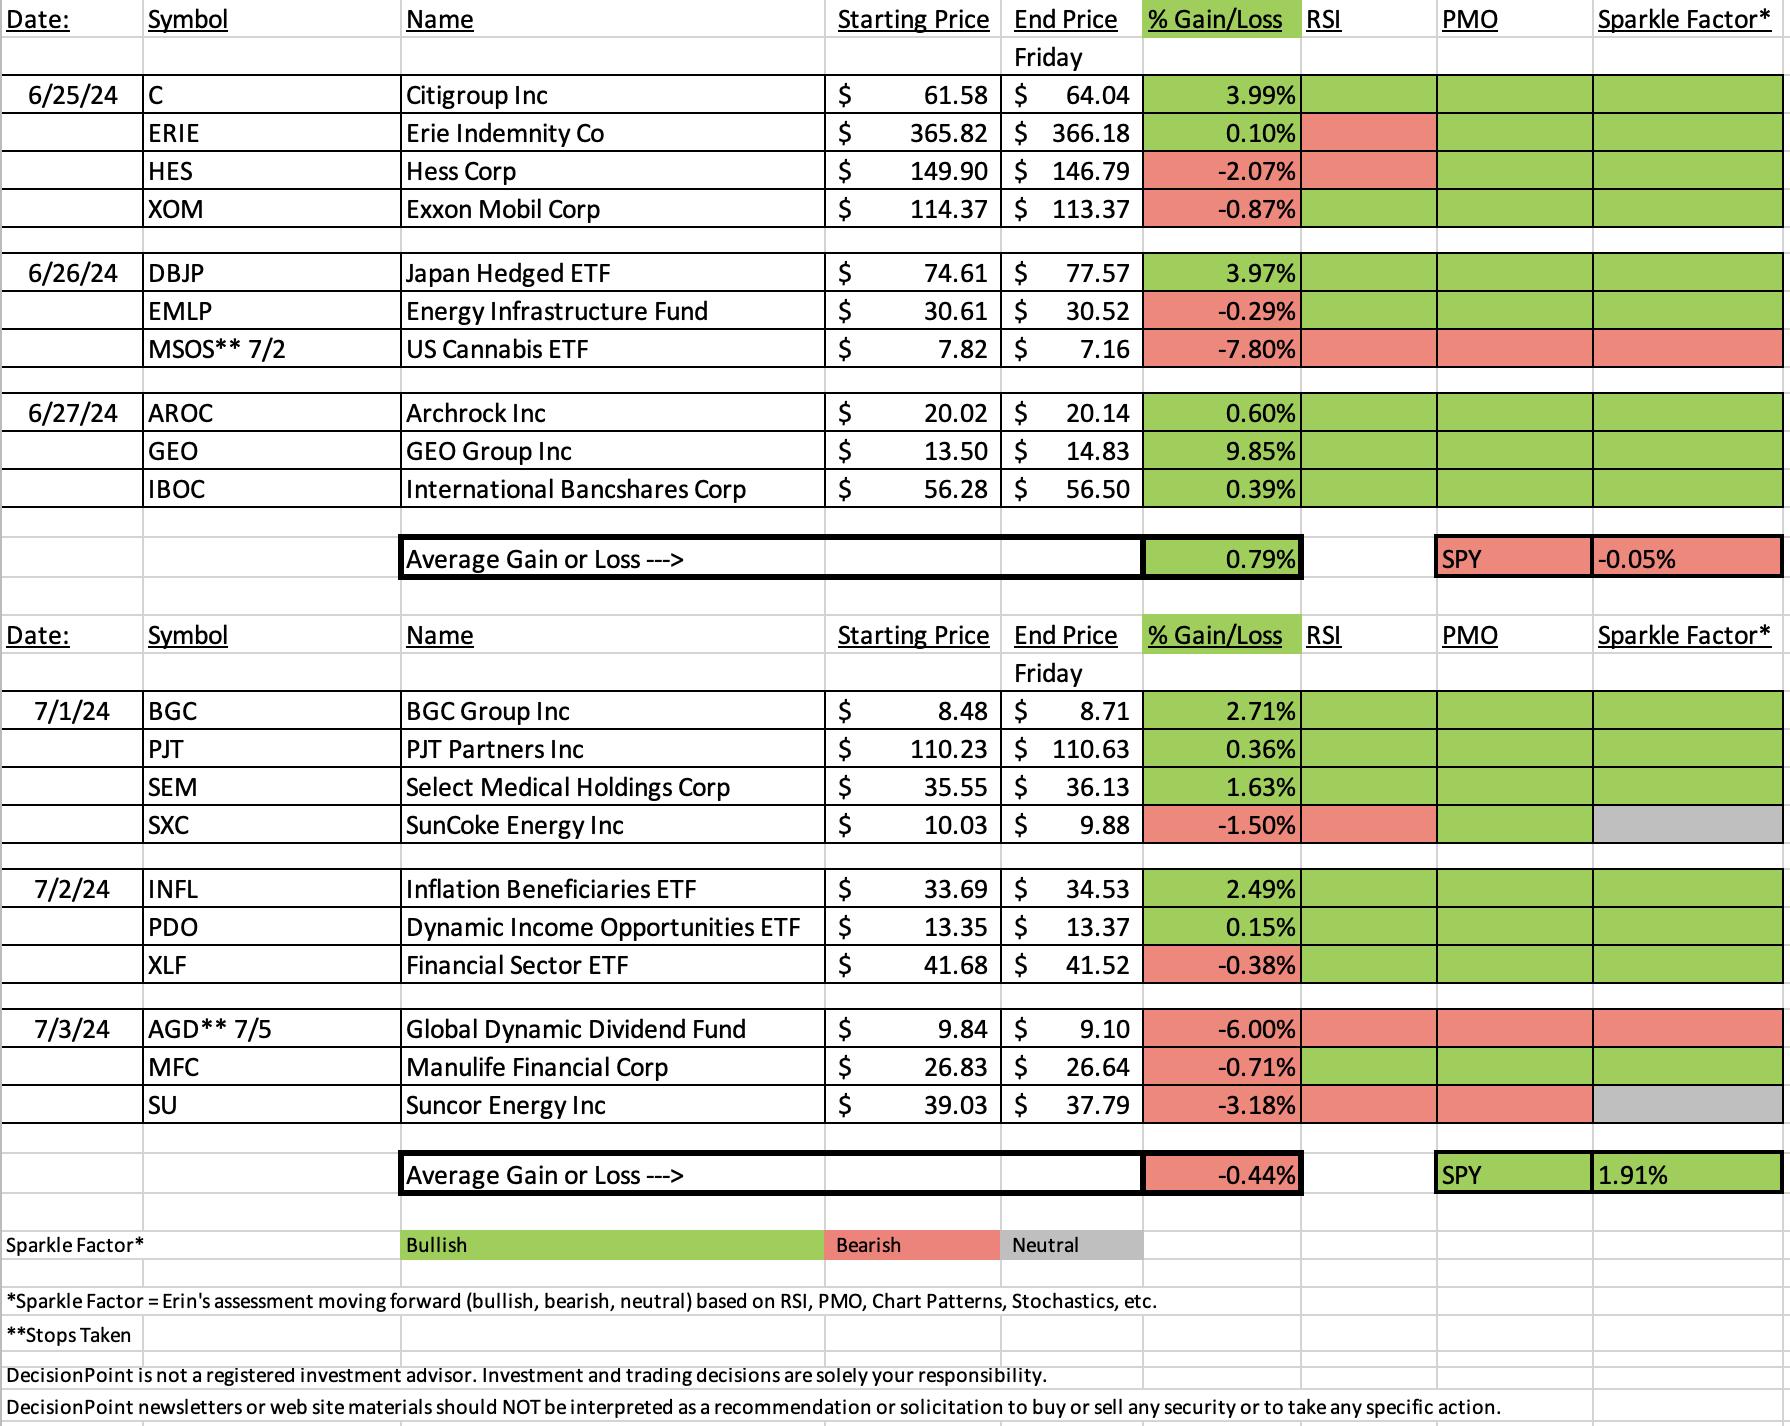
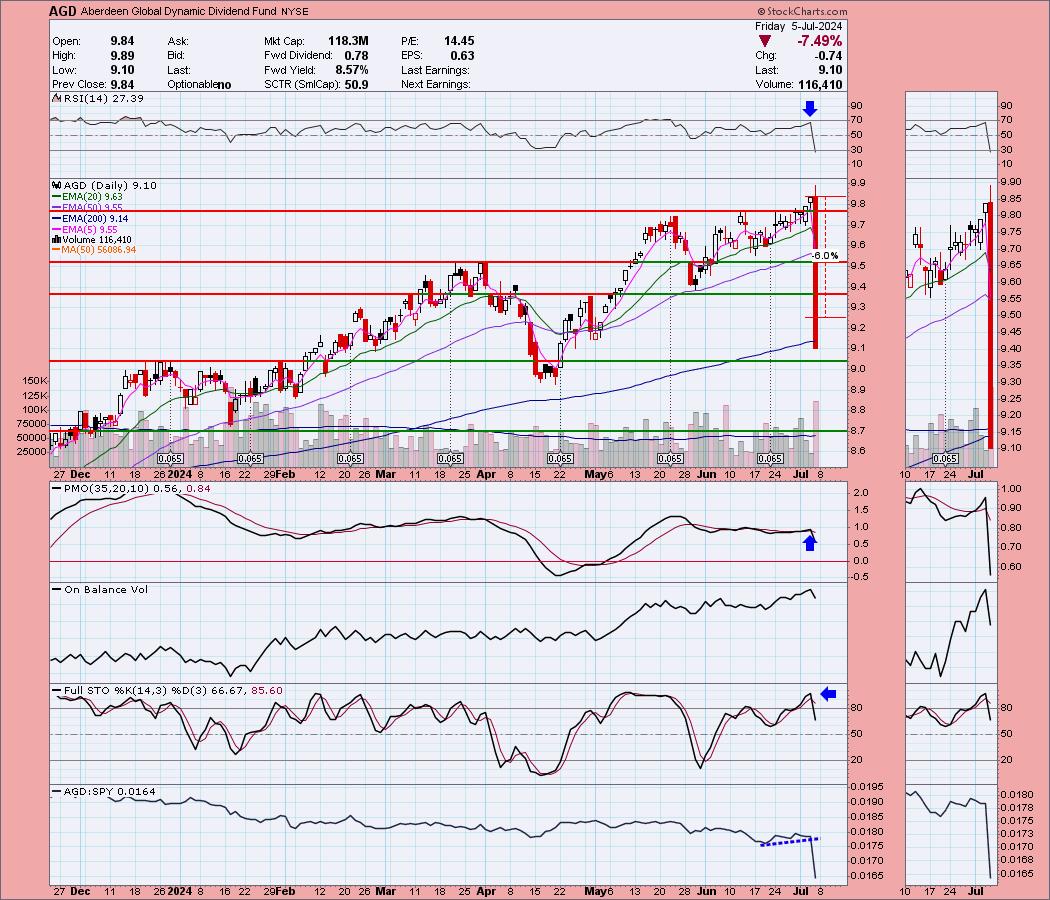
We had a fairly successful week, but we had one ETF crash today over 7%--it was picked Wednesday. I have no news to share regarding the drop, but I will say it is up over +7% in after hours trading. Given this strange volatility, I would hesitate to purchase it in the future. Its deep decline skewed our average on the week, but overall I like what I'm seeing on this week's "Diamonds in the Rough".
Not sure what is up with Energy as it fails to get going even though Crude Oil is in a strong rally. It isn't necessarily over for Energy as I do see good participation of stocks above their 20-day EMAs. I didn't make it the Sector to Watch, but it should certainly be interesting to see if it is finally swayed by the Crude Oil trade.
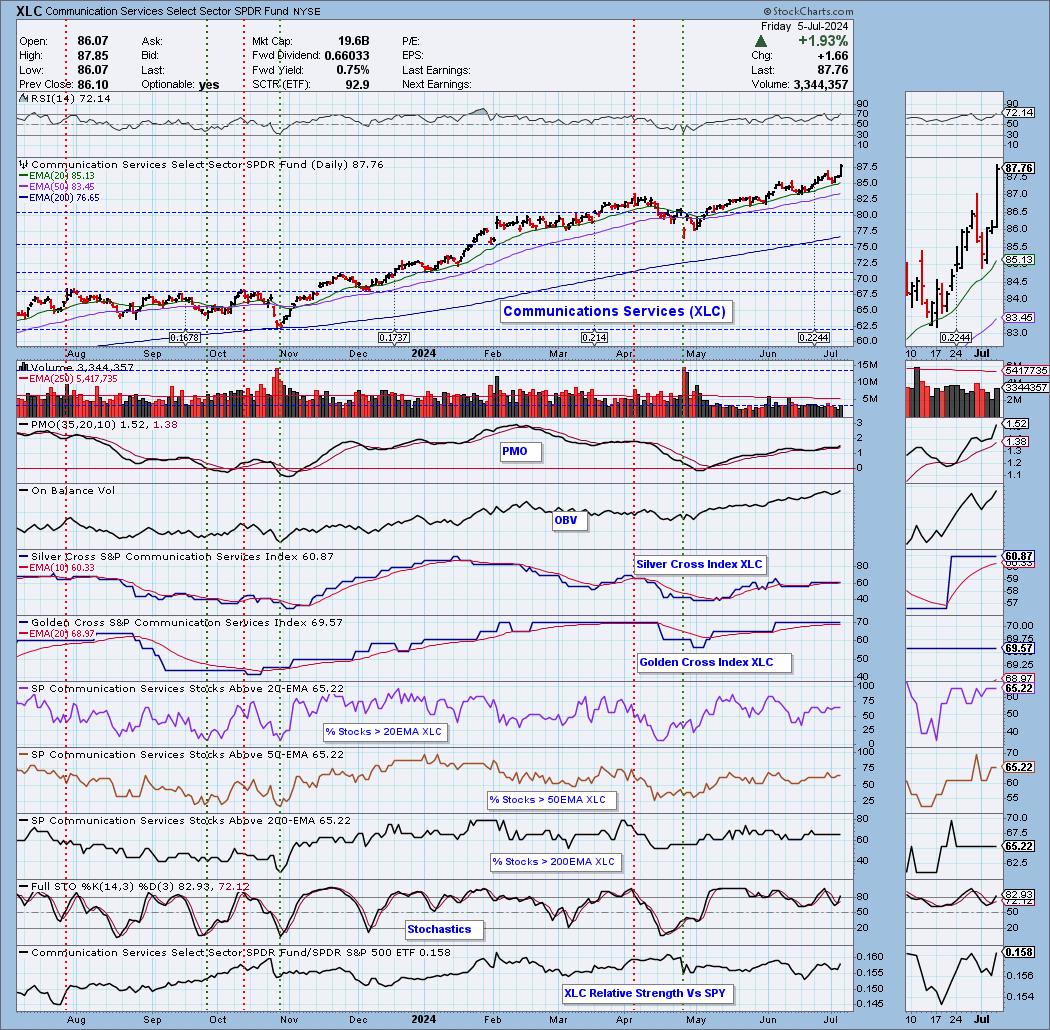
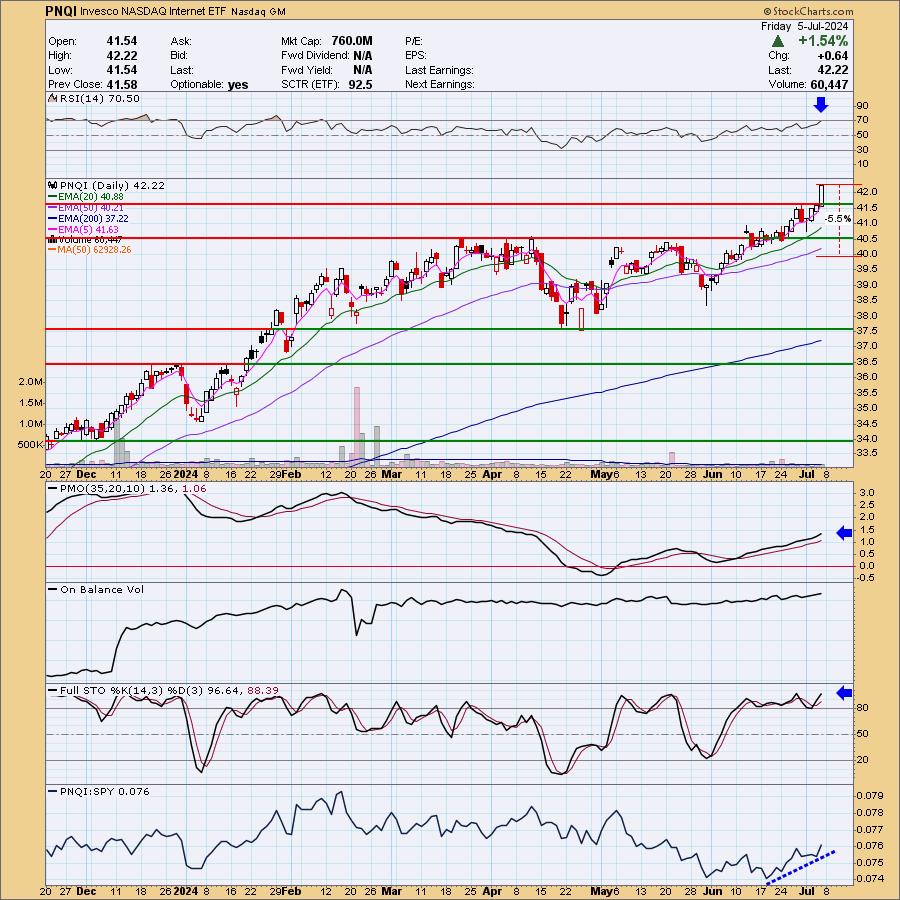
The Sector to Watch came down to Communications (XLC) and Technology (XLK). I decided to go with XLC but it really could've gone either way. I decided that the Industry Group to Watch would be Internet which holds both Google (GOOGL) and Meta (META). Those stocks are leading the market and the group and look very good moving forward. Other symbols from that area: EVER, NFLX and GDDY.
I ran my scans at the end of the trading room and we did find some interesting symbols moving forward: GNRC, WRK, AVGO, ROL, FORM, CHEF and RGLD.
Have a great weekend! See you in the Monday trading room!
Good Luck & Good Trading,
Erin

RECORDING & DOWNLOAD LINK (7/5/2024):
Topic: DecisionPoint Diamond Mine (7/5/2024) LIVE Trading Room
Download & Recording Link
Passcode: July#5th
REGISTRATION for 7/12/2024:
When: July 12, 2024 09:00 AM Pacific Time (US and Canada)
Topic: DecisionPoint Diamond Mine (7/12/2024) LIVE Trading Room
Register in advance for this webinar HERE
After registering, you will receive a confirmation email containing information about joining the webinar.

Below is the latest free DecisionPoint Trading Room recording from 7/1. You'll find these recordings posted on Mondays to our DP YouTube Channel. Be sure and subscribe HERE.
A few items about the spreadsheet: I've put on the spreadsheet whether the RSI is positive (green) or negative (red). The PMO column tells you if it is rising (green) or falling (red). Finally I've added my own "Sparkle Factor" that gives you my assessment going forward, bullish (green), bearish (red) or neutral (gray). The Sparkle Factor is basically my thoughts on whether I expect it to rise or fall. A neutral means it could really go either way so it could be added to a watch list. If you're in a stock I consider "neutral" going forward, the ball is in your court.
Darling:
BGC Group Inc (BGC)
EARNINGS: 07/31/2024 (BMO)
BGC Group, Inc. engages in the provision of brokerage and financial technology services. It offers trade execution and broker-dealer services specializing in Fixed Income (Rates and Credit), Foreign Exchange, Equities, Energy and Commodities, Shipping, and Futures. The company was founded on April 19, 2021 and is headquartered in New York, NY.
Predefined Scans Triggered: P&F Double Top Breakout.
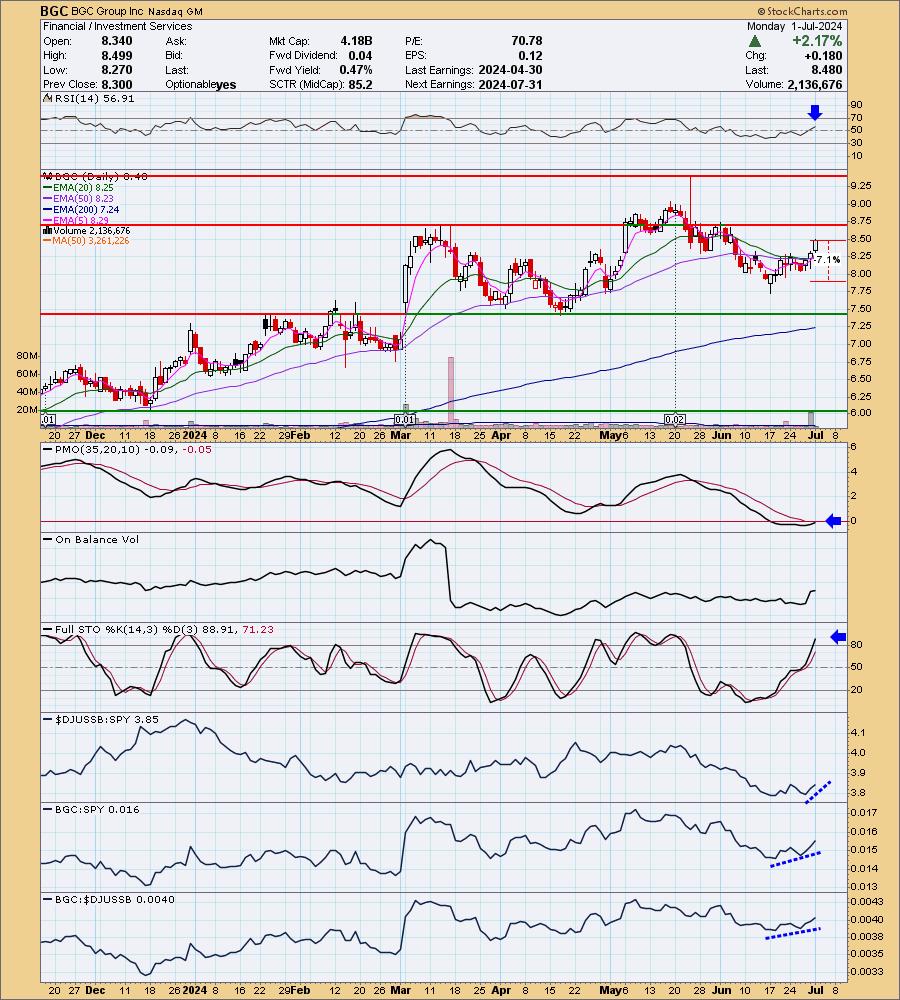
Below are the commentary and chart from Monday, 7/1:
"BGC is up +0.12% in after hours trading. I didn't annotate it, but I do see a short-term reverse head and shoulder pattern leading into the breakout. The pattern suggests we will see a breakout at the next level of overhead resistance. The RSI is positive and not at all overbought. The PMO is about to trigger a Crossover BUY Signal. We saw a small spike in volume leading into the rally. Stochastics are above 80. Relative strength is picking up for the industry group and BGC is already showing outperformance. The stop is set as close to support as I could comfortably get it at 7.1% or $7.87. This is low priced so position size wisely."
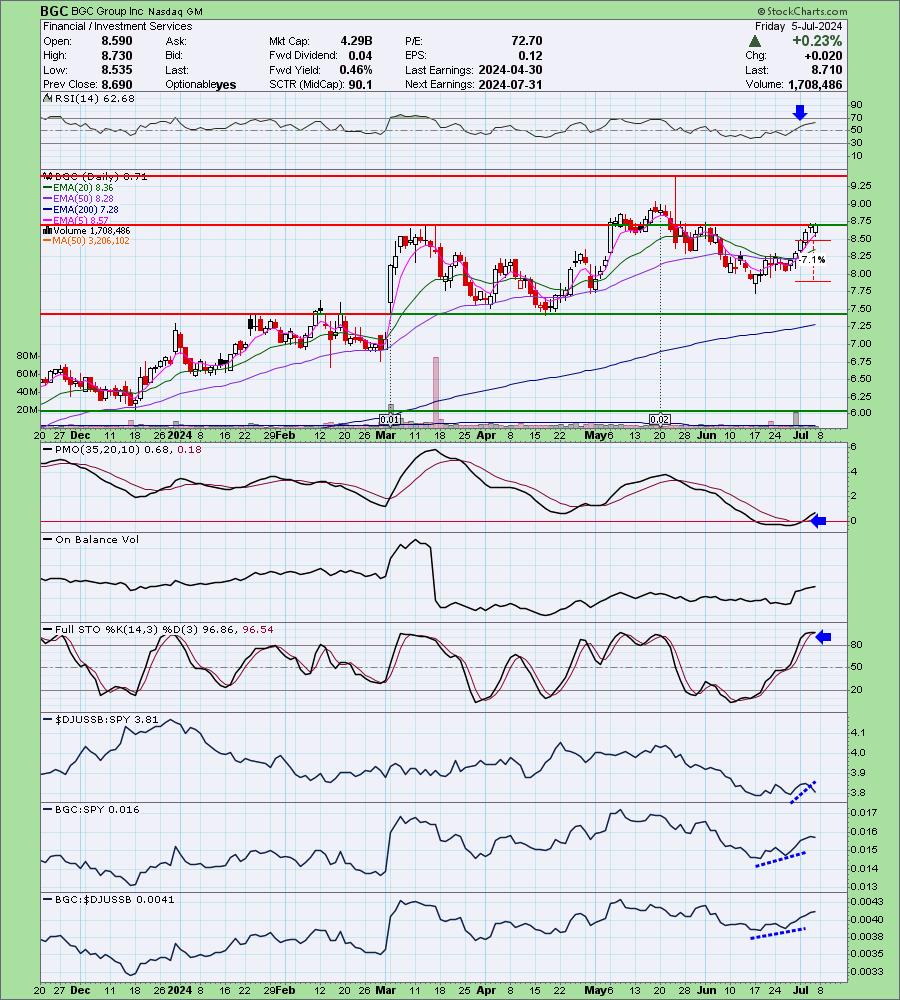
Here is today's chart:
It is finding itself unable to overcome overhead resistance, but I see this as temporary given the maturity of the indicators. I particularly like that the RSI isn't overbought. It looks like the reverse head and shoulders pattern was accurate and still implies more upside to go. The PMO is rising strongly and Stochastics are holding above 80. Look for a test of the next level of overhead resistance.
Don't forget, on Thursdays I look at reader-requested symbols, so shoot me an email at erin@decisionpoint.com. I read every email I receive and try to answer them all!
Dud:
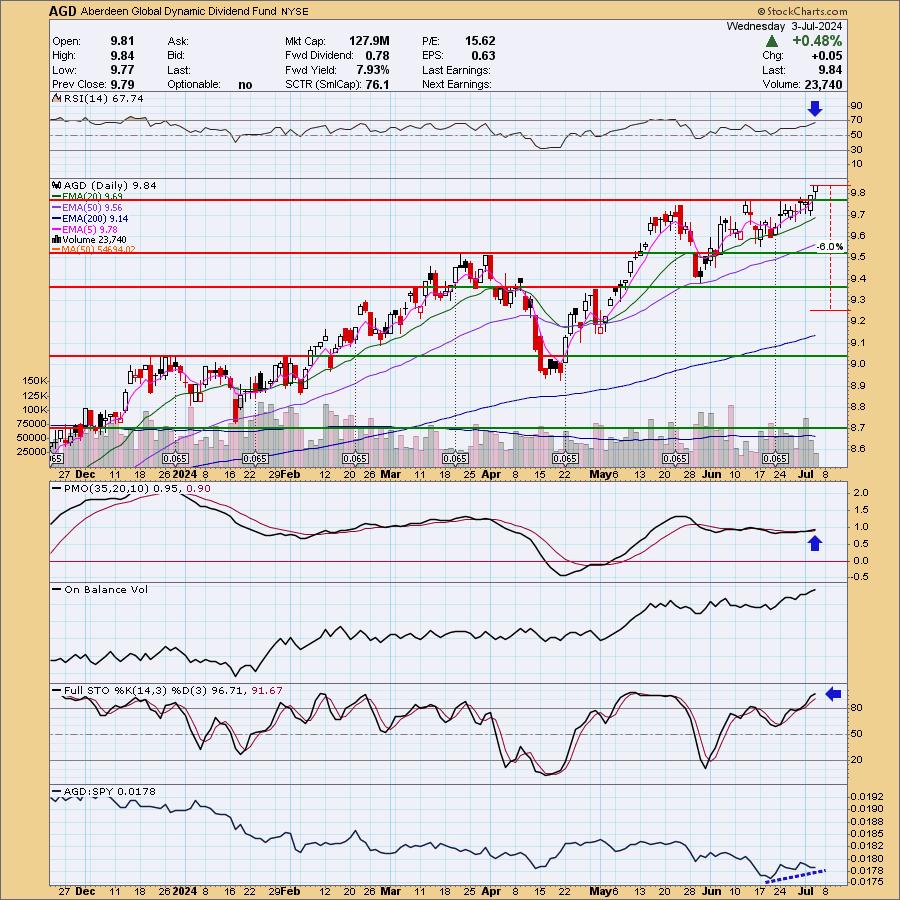
Aberdeen Global Dynamic Dividend Fund (AGD)
EARNINGS: N/A
Aberdeen Global Dynamic Dividend Fund is a mutual fund, closed-end investment trust. It focuses on long-term growth of capital and seeks high current dividend income. The company was founded on May 11, 2006 and is headquartered in Philadelphia, PA.
Predefined Scans Triggered: *****
Below are the commentary and chart from Wednesday, 7/3:
"Today saw a nice breakout from a bullish ascending triangle (flat top, rising bottoms). The RSI is positive and not yet overbought. The PMO is flat above the signal line which signifies pure strength. It is also on a new Crossover BUY Signal. Stochastics are rising above 80 and we see some improved relative strength against the SPY. I would also note that this ETF has a nice yield right now. I've put the stop well below support. You don't have to wait it out if this trade goes south. I like to affix a 6% to 8% stop level on nearly all of my investments, but I will exit if things really get out of hand to the downside. I've set this one at 6% or $9.24."
Here is today's chart:
I checked Yahoo Finance and this data does appear to be correct. I have no idea what happened with this reader request and if it trades like this with a follow-up 7.25% gain in after hours trading, I don't really want to be a part of it. I can't point to anything on the chart that was a warning. It unfortunately is just one of those things.
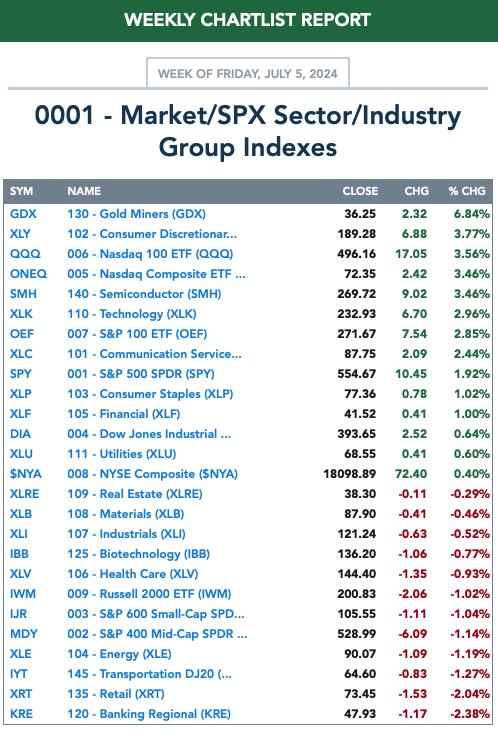
THIS WEEK's Performance:
DecisionPoint Market Scoreboard (Mechanical Trend Model Signals):
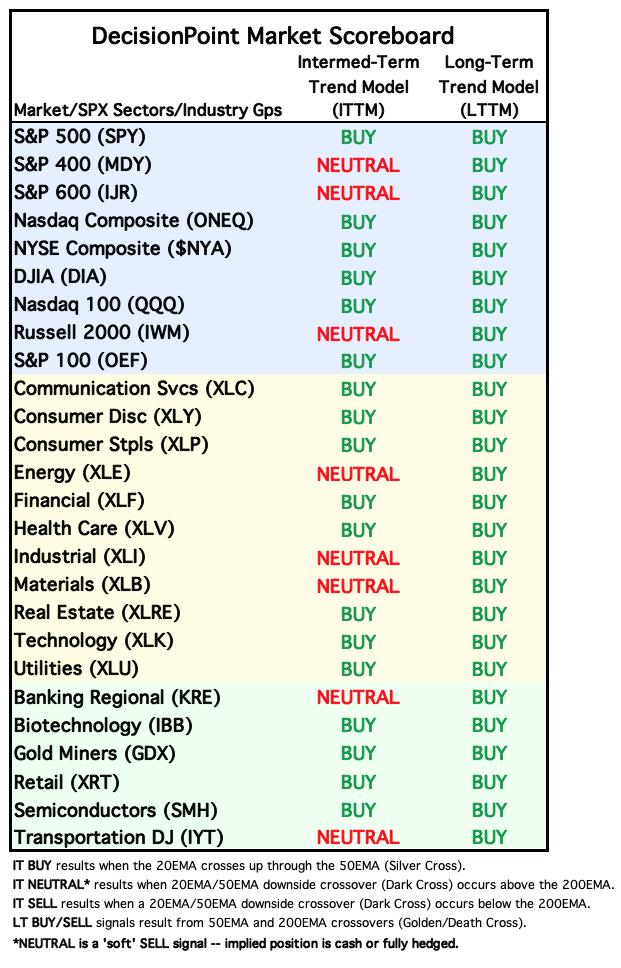
Friday signal changes are outlined in purple.
Click Here to view Carl's annotated "Under the Hood" ChartList!
Sector to Watch: Communication Services (XLC)
I will say that not every industry group looked healthy in this sector, but neither did they look bearish. This breakout is primarily due to META and GOOGL, but I do see an opportunity for growth in the other areas of XLC. I would've liked to have seen more stocks above key moving averages, but there is room for growth. Stochastics are back above 80 and the PMO has recently surged above the signal line. I see more upside potential for this sector primarily in the Internet group.
Industry Group to Watch: Internet (PNQI)
I was able to locate an Internet ETF (PNQI) for your review. It is low-ish volume, but I would be okay with it. It is overbought and that will be the problem for this group, but it saw an excellent thrust higher that suggests we will see follow through next week. The PMO is accelerating higher and Stochastics are camped out above 80. It is outperforming the SPY in a big way. Look for more upside in the Internet group.
Go to our Under the Hood ChartList on DecisionPoint.com to get an in-depth view of all the sectors. On StockCharts.com you can find the Industry Summary.
Good Luck & Good Trading!
- Erin
erin@decisionpoint.com
Full Disclosure: I'm 40% long, 0% short.
Watch the latest episode of the DecisionPoint Trading Room with Carl & Erin Swenlin on Mondays 3:00p EST!
Technical Analysis is a windsock, not a crystal ball. --Carl Swenlin
NOTE: The stocks reported herein are from mechanical trading model scans that are based upon moving average relationships, momentum and volume. DecisionPoint analysis is then applied to get selections from the scans. The selections given should prompt readers to do a chart review using their own analysis process. This letter is not a call for a specific action to buy, sell or short any of the stocks provided. There are NO sure things or guaranteed returns on the selection of "diamonds in the rough."
Helpful DecisionPoint Links:
DecisionPoint Shared ChartList and DecisionPoint Chart Gallery
Price Momentum Oscillator (PMO)
Swenlin Trading Oscillators (STO-B and STO-V)
(c) Copyright 2024 DecisionPoint.com