
The scans were unanimous in one main theme today and that was Bonds. I had numerous Bond ETFs come up from mortgage backed securities to corporate bonds to treasuries. These funds are slow movers and can be a calming influence to your portfolio. You're not going to experience deep declines, but conversely you aren't going to see rallies that are significant. I opted to present a Treasury Bond ETF for the 7 to 10-year horizon. You could consider the leveraged version of the ETF, UST.
Energy was also a theme with many different Energy ETFs finding their way into the results. I opted to present a leveraged 2x Energy ETF (ERX) that can take advantage of near-term strength coming into the sector. I'm not thrilled with the Crude Oil trade, but Energy seems to be finding its way higher despite the drop in Crude. Who knows, it may be time for Crude to reverse higher.
Good Luck & Good Trading,
Erin
Today's "Diamonds in the Rough": IEF, IGF and ERX.
Runner-ups: EWU, EWL and VMBS.

Diamond Mine Trading Room:
RECORDING & DOWNLOAD LINK (7/26/2024):
Topic: DecisionPoint Diamond Mine (7/26/2024) LIVE Trading Room
Download & Recording Link HERE
Passcode: July#26th
REGISTRATION for 8/2/2024:
When: August 2, 2024 09:00 AM Pacific Time (US and Canada)
Topic: DecisionPoint Diamond Mine LIVE Trading Room
Register in advance for this webinar HERE
After registering, you will receive a confirmation email containing information about joining the webinar.

Below is the latest free DecisionPoint Trading Room recording from 7/29. You'll find these recordings posted on Mondays to our DP YouTube Channel. Be sure and subscribe HERE.
Welcome to DecisionPoint Diamonds, wherein I highlight ten "Diamonds in the Rough" per week. These are selected from the results of my DecisionPoint Scans which search for stocks that could benefit from the trend and condition of the market. Remember, these are not recommendations to buy or sell, but are the most interesting of the stocks that surfaced in my scans. My objective is to save you the work of the initial, tedious culling process, but you need to apply your own analysis to see if these stocks pique your interest as well. There are no guaranteed winners here!
"Predefined Scans Triggered" are taken from StockCharts.com using the "Symbol Summary" option instead of a "SharpChart" on the workbench.
Stop levels are all rounded down.
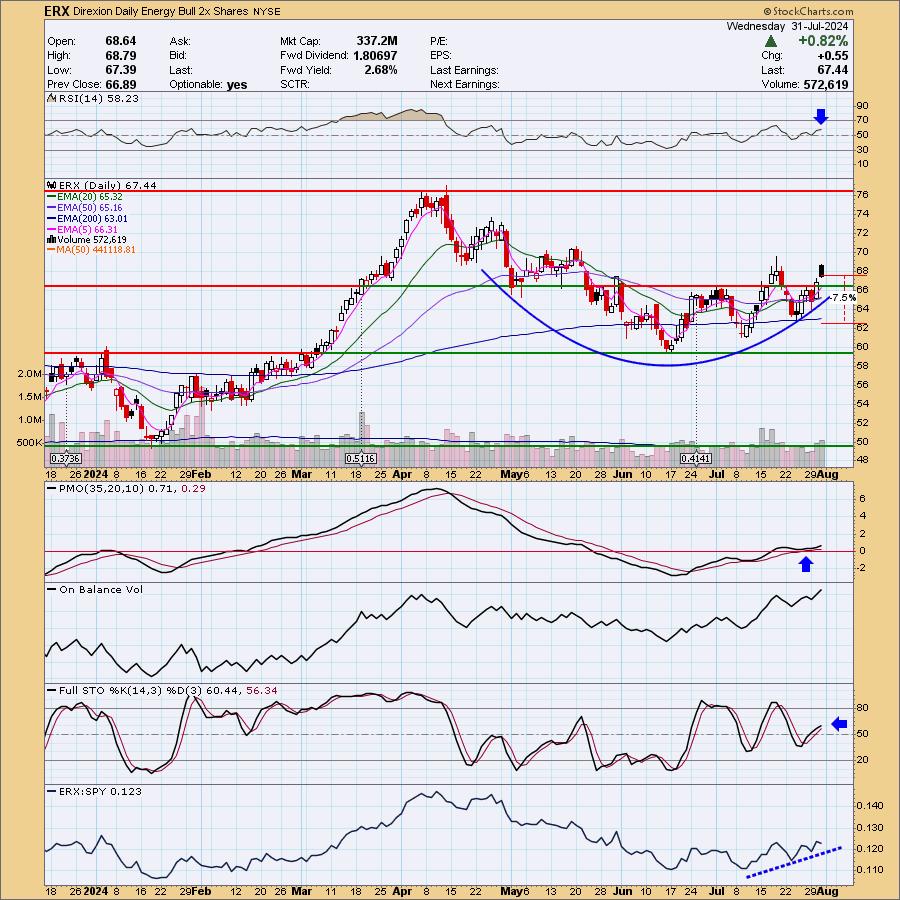
Direxion Daily Energy Bull 2x Shares (ERX)
EARNINGS: N/A
ERX provides 2x leveraged exposure to a market-cap-weighted index of US large-cap companies in the energy industry. Click HERE for more information.
Predefined Scans Triggered: Filled Black Candles and New CCI Buy Signals.
ERX is up +0.49% in after hours trading. Here we have a nice basing pattern in a rounded bottom. Price popped above overhead resistance. It is a filled black candlestick so this one could see a decline tomorrow, but if after hours trading is any indication, maybe it will rally after all. The RSI is positive and not overbought. The PMO bottomed above the signal line and Stochastics are rising in positive territory. Relative strength is gaining. This is leveraged so position size wisely. The stop is set beneath the 200-day EMA at 7.5% or $62.38.
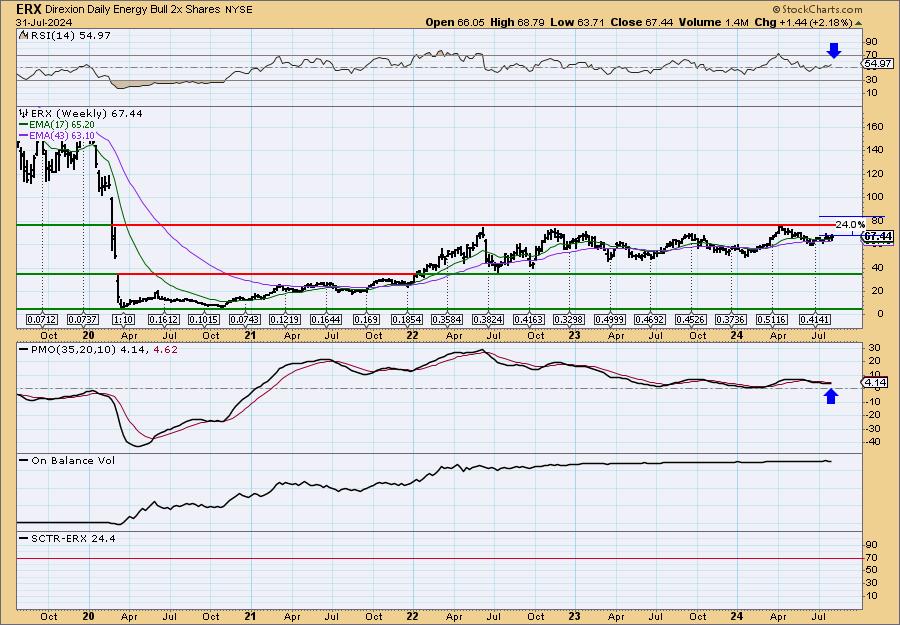
I'm looking for a breakout on the weekly chart. We do have a flat top and rising bottoms to form a bullish ascending triangle so an upside breakout is called for here. The weekly RSI is not overbought and the weekly PMO is nearing a Crossover BUY Signal. I've marked upside potential to 24% which would mean a 12% gain on XLE.
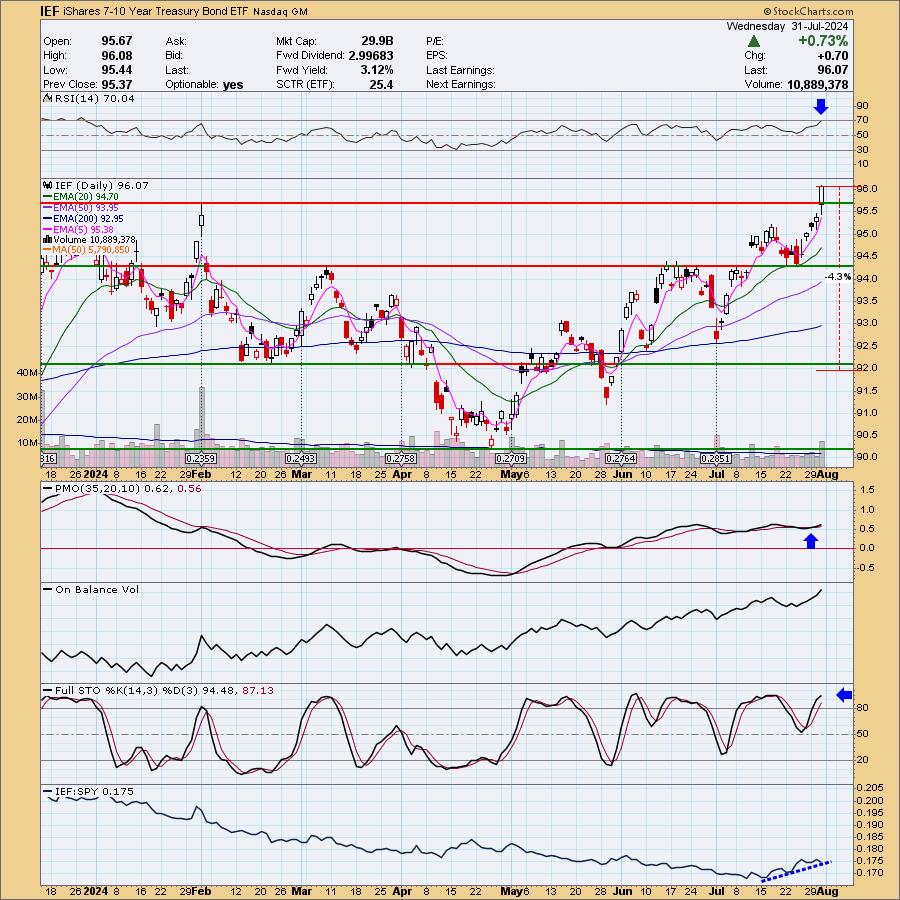
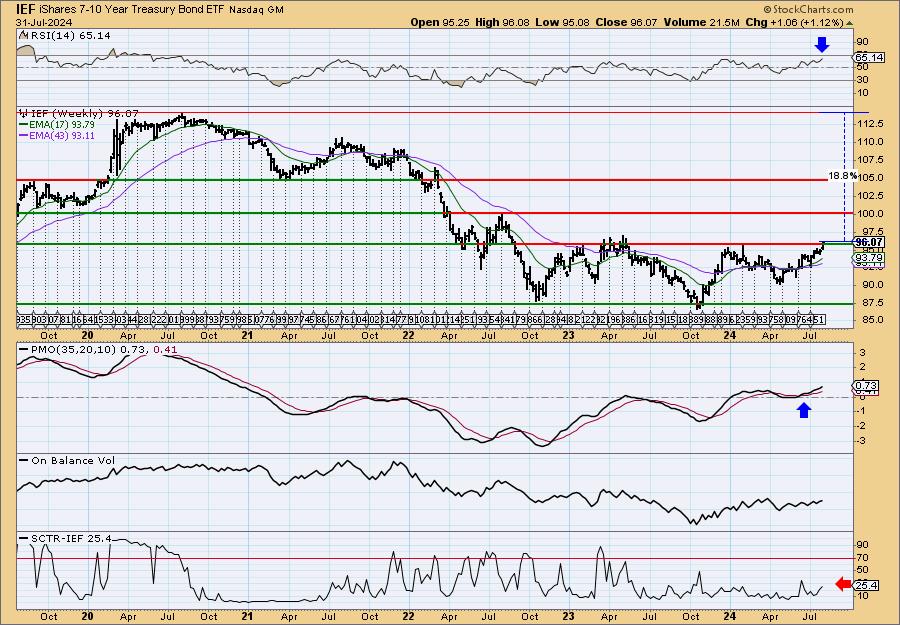
iShares 7-10 Year Treasury Bond ETF (IEF)
EARNINGS: N/A
IEF tracks a market-value-weighted index of debt issued by the US Treasury with 7-10 years to maturity remaining. Treasury STRIPS are excluded. Click HERE for more information.
Predefined Scans Triggered: Moved Above Upper Bollinger Band, P&F Double Top Breakout, Moved Above Upper Keltner Channel and New 52-week Highs.
IEF is up +0.12% in after hours trading. As noted in the opening this will be a slow mover, but because of this you can have a very thin stop. You could consider a leveraged Bond fund like (UST). Today saw a breakout to new 52-week highs as it vaulted above the February high. The RSI is overbought, but given the state of falling interest rates, I believe IEF and other Bond funds have higher to go. The PMO is rising on a Crossover BUY Signal and has bullishly been running flat above the zero line implying pure strength in the move out of the April low. Stochastics are rising above 80 also implying strength. We see outperformance against the SPY right now. The stop can be set below the February low at 4.3% or $91.93.
This is a good breakout above the 2024 high that tells me we should see more upside from here. The weekly RSI is not overbought and the weekly PMO is rising on a Crossover BUY Signal above the zero line. One complaint is that the StockCharts Technical Rank is not in the hot zone* above 70. It will take a big time move to reach the 2020 highs and I'm unsure if it will be able to do so. If rate cuts kick in with the Fed, that could raise this ETF to great heights.
*If a stock is in the "hot zone" above 70, it implies that it is stronger than 70% of its universe (large-, mid-, small-caps and ETFs) primarily in the intermediate to long terms.
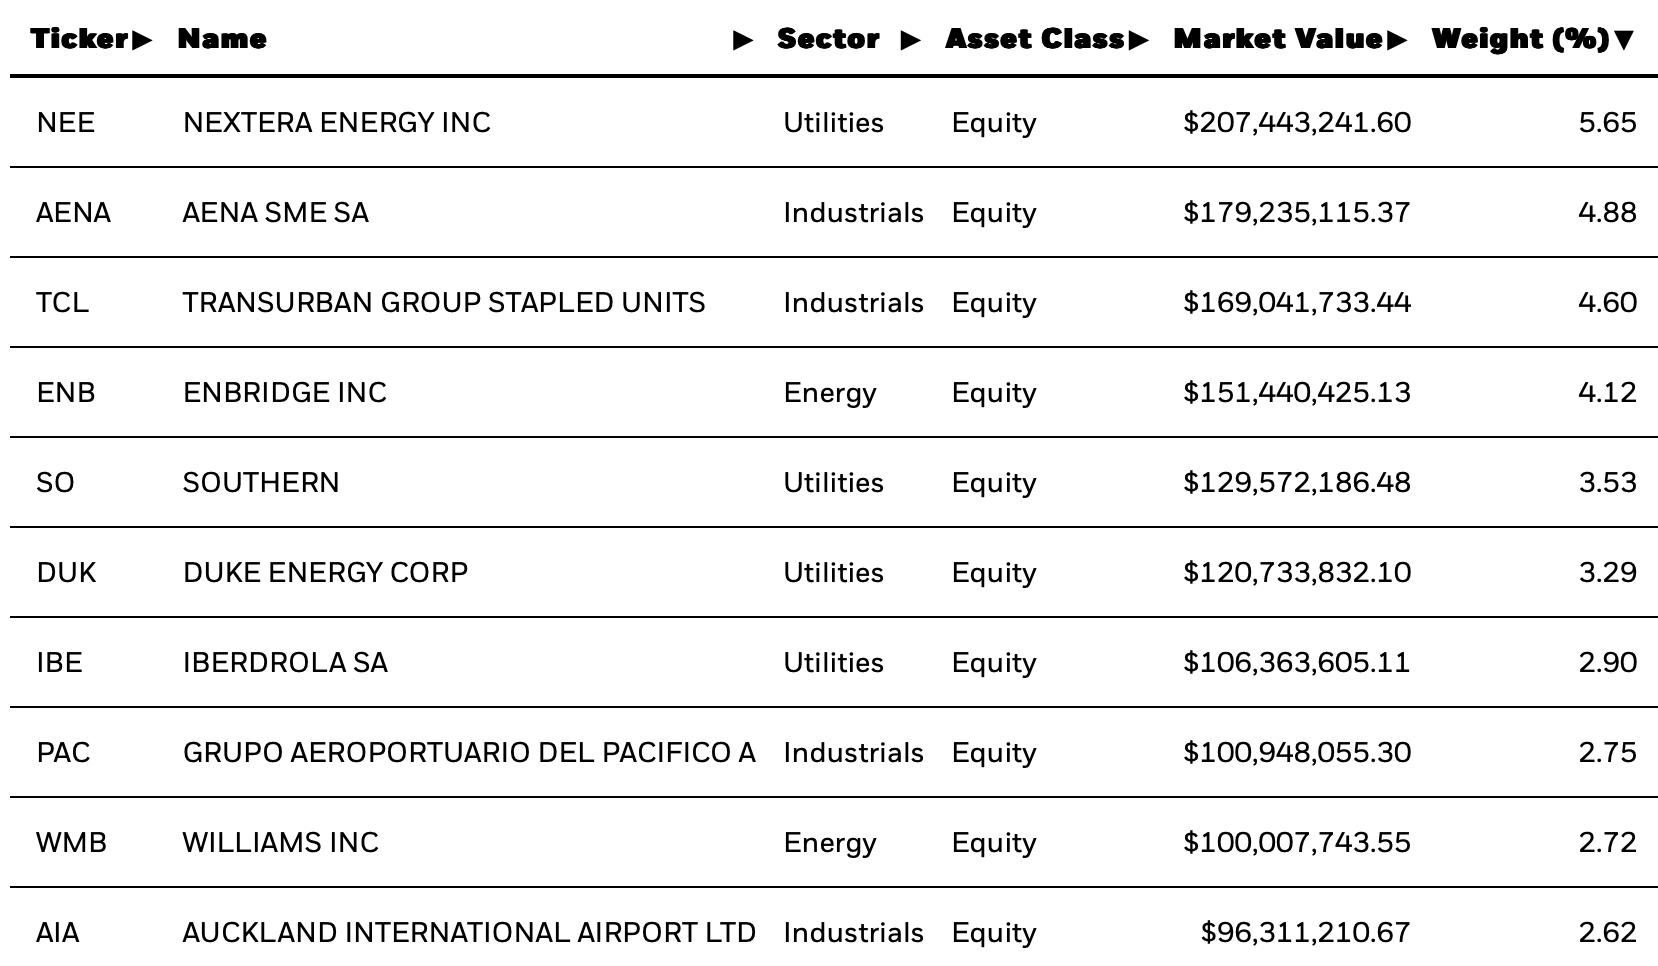
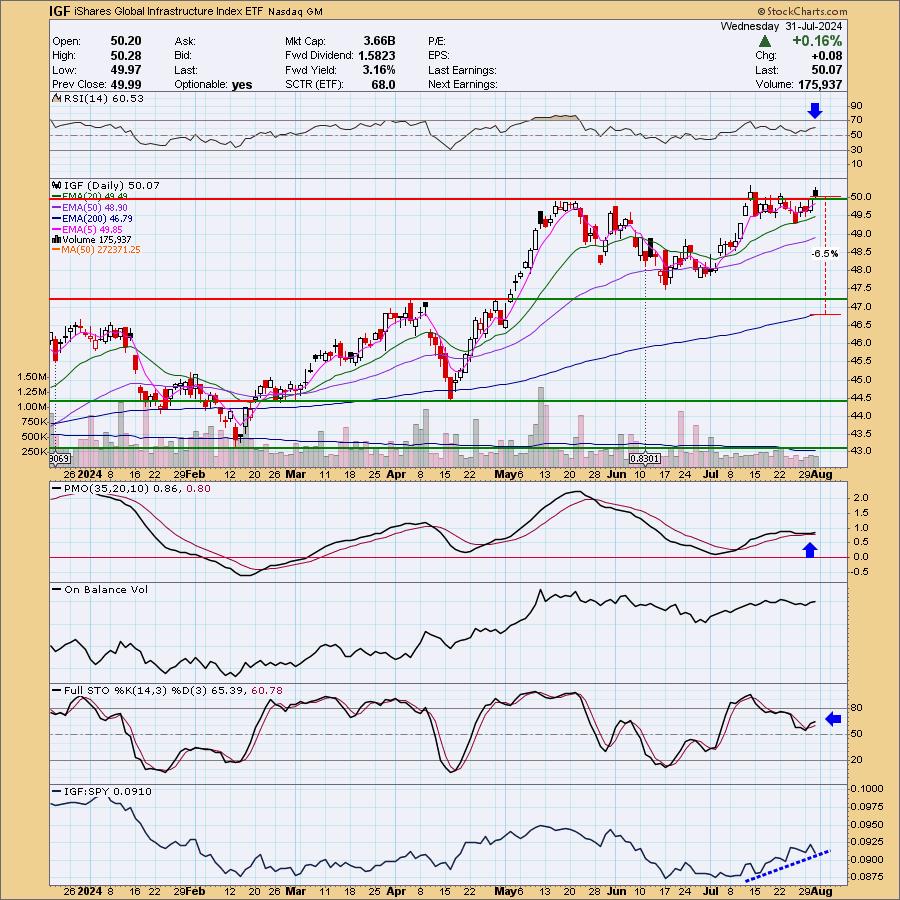
iShares Global Infrastructure Index ETF (IGF)
EARNINGS: N/A
IGF tracks a market-cap-weighted index of global infrastructure companies. Click HERE for more information.
Predefined Scans Triggered: New CCI Buy Signals, Filled Black Candles, Parabolic SAR Buy Signals, P&F Double Top Breakout and P&F Triple Top Breakout.
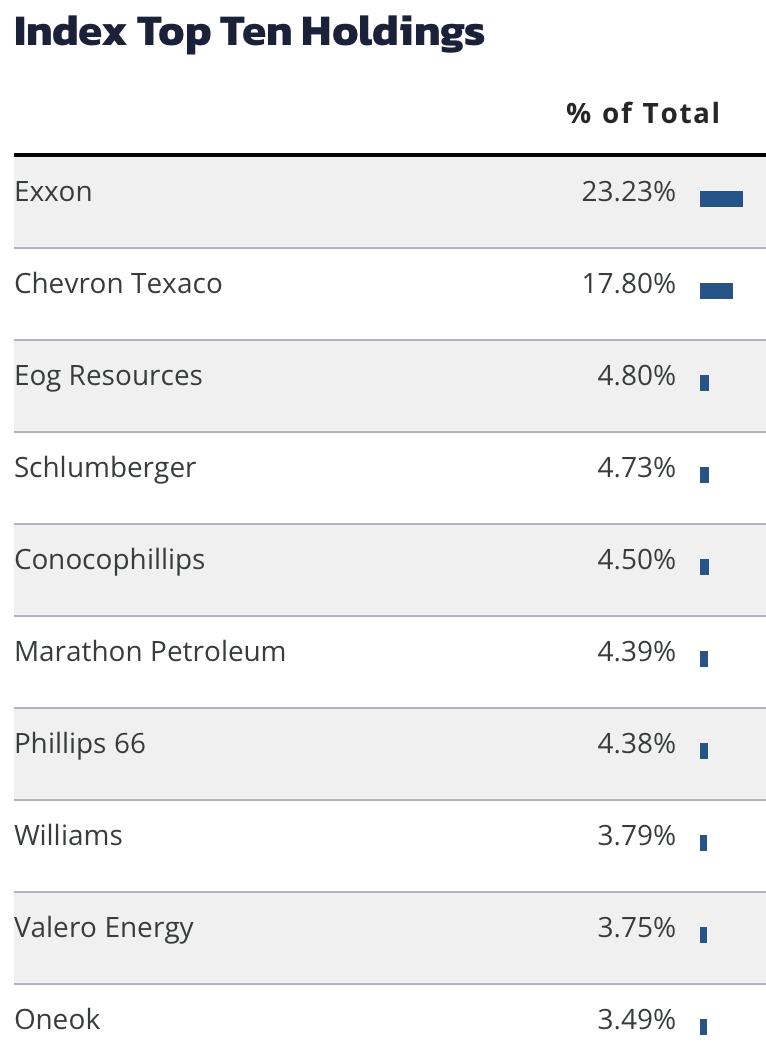
IGF is up +0.17% in after hours trading. We had a bit of a breakout today, but it ultimately closed below the July top. It is a bearish candlestick, but so far after hours trading has it higher. This is a breakout from a flag formation that implies more upside to go. Utilities are looking bullish and this ETF has plenty in the top ten holdings. I'm bullish Energy and we see some of these in the holdings as well. The RSI is not overbought and the PMO has recently surged above the signal line (bottomed above the signal line). Stochastics are rising in positive territory and we are seeing outperformance based on the relative strength line's rise. I've set the stop below the 200-day EMA at 6.5% or $46.81.
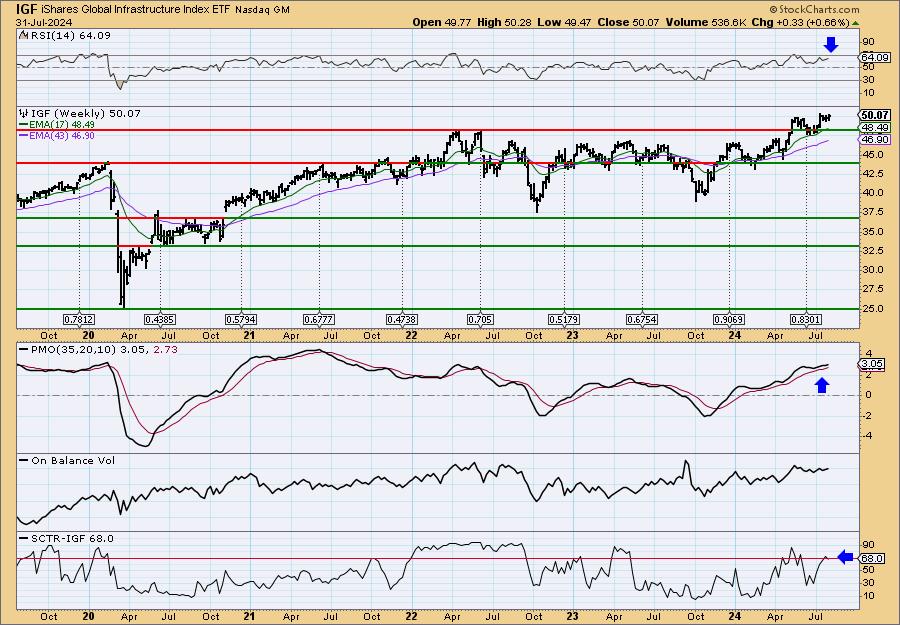
IGF has broken away from a long-term trading range and looks ready to start a new one. The rising trend is strong. The weekly RSI is positive and not overbought and the weekly PMO is rising after surging above the signal line. The SCTR is not in the hot zone, but it is really close so I'll accept it. Consider a 17% upside target to about $58.58.
Don't forget, on Thursdays I look at reader-requested symbols, click HERE to send me an email. I read every email I receive and try to answer them all!
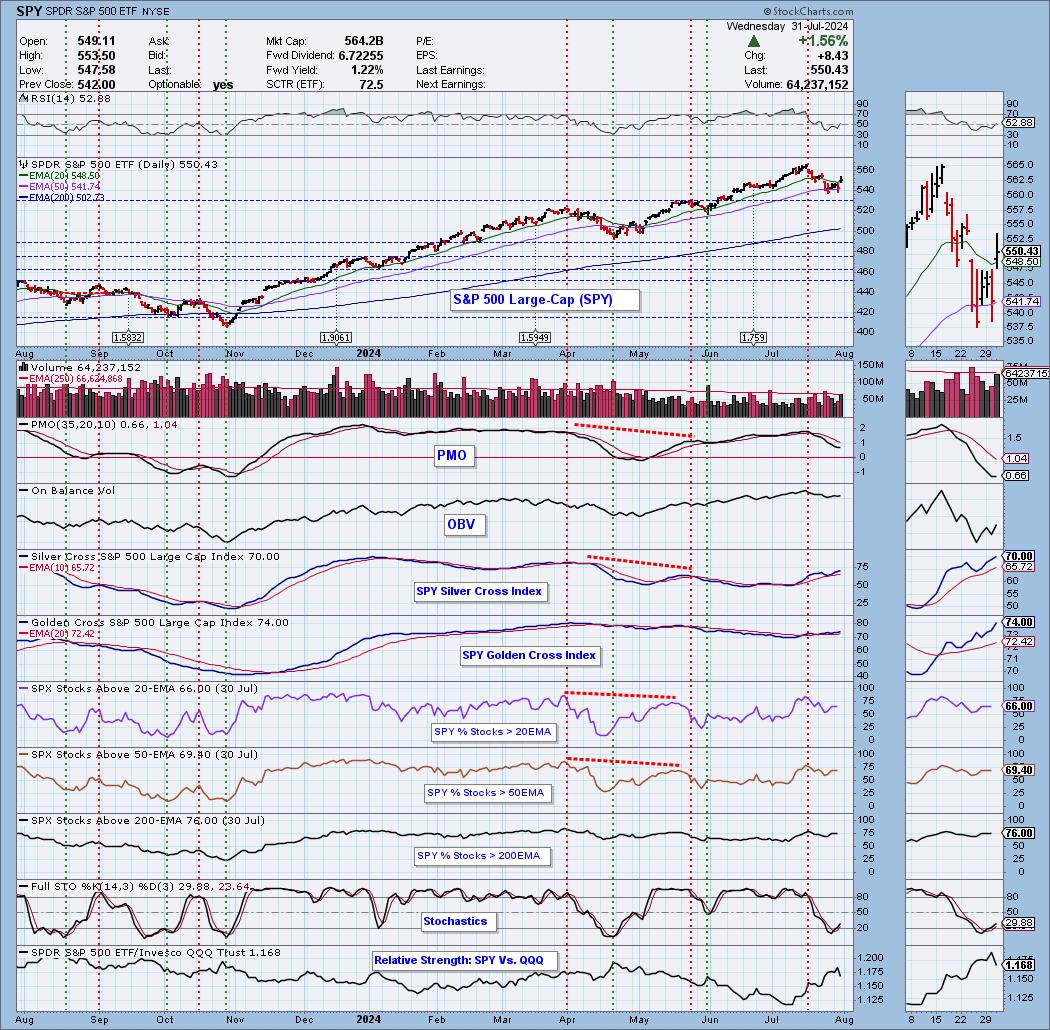
Current Market Outlook:
Market Environment: It is important to consider the odds for success by assessing the market tides. The following chart uses different methodologies for objectively showing the depth and trend of participation for intermediate- and long-term time frames.
- The Silver Cross Index (SCI) shows the percentage of SPX stocks on IT Trend Model BUY signals (20-EMA > 50-EMA)
- The Golden Cross Index (GCI) shows the percentage of SPX stocks on LT Trend Model BUY signals (50-EMA > 200-EMA)
Don't forget that as a "Diamonds" member, you have access to our "Under the Hood" curated ChartList on DecisionPoint.com. You'll find it under "Members Only" links on the left side on the Blogs and Links Page.
Here is the current chart:
Full Disclosure: I am 45% long, 0% short.
I'm required to disclose if I currently own a stock I mention and/or may buy/short it within the next 72 hours.
"Technical Analysis is a windsock, not a crystal ball." - Carl Swenlin
(c) Copyright 2024 DecisionPoint.com
Watch the latest episode of DecisionPoint Trading Room with Carl & Erin Swenlin Mondays on the DecisionPoint YouTube channel here!
NOTE: The stocks reported herein are from mechanical trading model scans that are based upon moving average relationships, momentum and volume. DecisionPoint analysis is then applied to get five selections from the scans. The selections given should prompt readers to do a chart review using their own analysis process. This letter is not a call for a specific action to buy, sell or short any of the stocks provided. There are NO sure things or guaranteed returns on the daily selection of "Diamonds in the Rough."
Regarding BUY/SELL Signals: The signal status reported herein is based upon mechanical trading model signals and crossovers. They define the implied bias of the price index/stock based upon moving average relationships and momentum, but they do not necessarily call for a specific action. They are information flags that should prompt chart review. Further, they do not call for continuous buying or selling during the life of the signal. For example, a BUY signal will probably (but not necessarily) return the best results if action is taken soon after the signal is generated. Additional opportunities for buying may be found as price zigzags higher, but the trader must look for optimum entry points. Conversely, exit points to preserve gains (or minimize losses) may be evident before the model mechanically closes the signal.
Helpful DecisionPoint Links:
Price Momentum Oscillator (PMO)
Swenlin Trading Oscillators (STO-B and STO-V)
For more links, go to DecisionPoint.com