
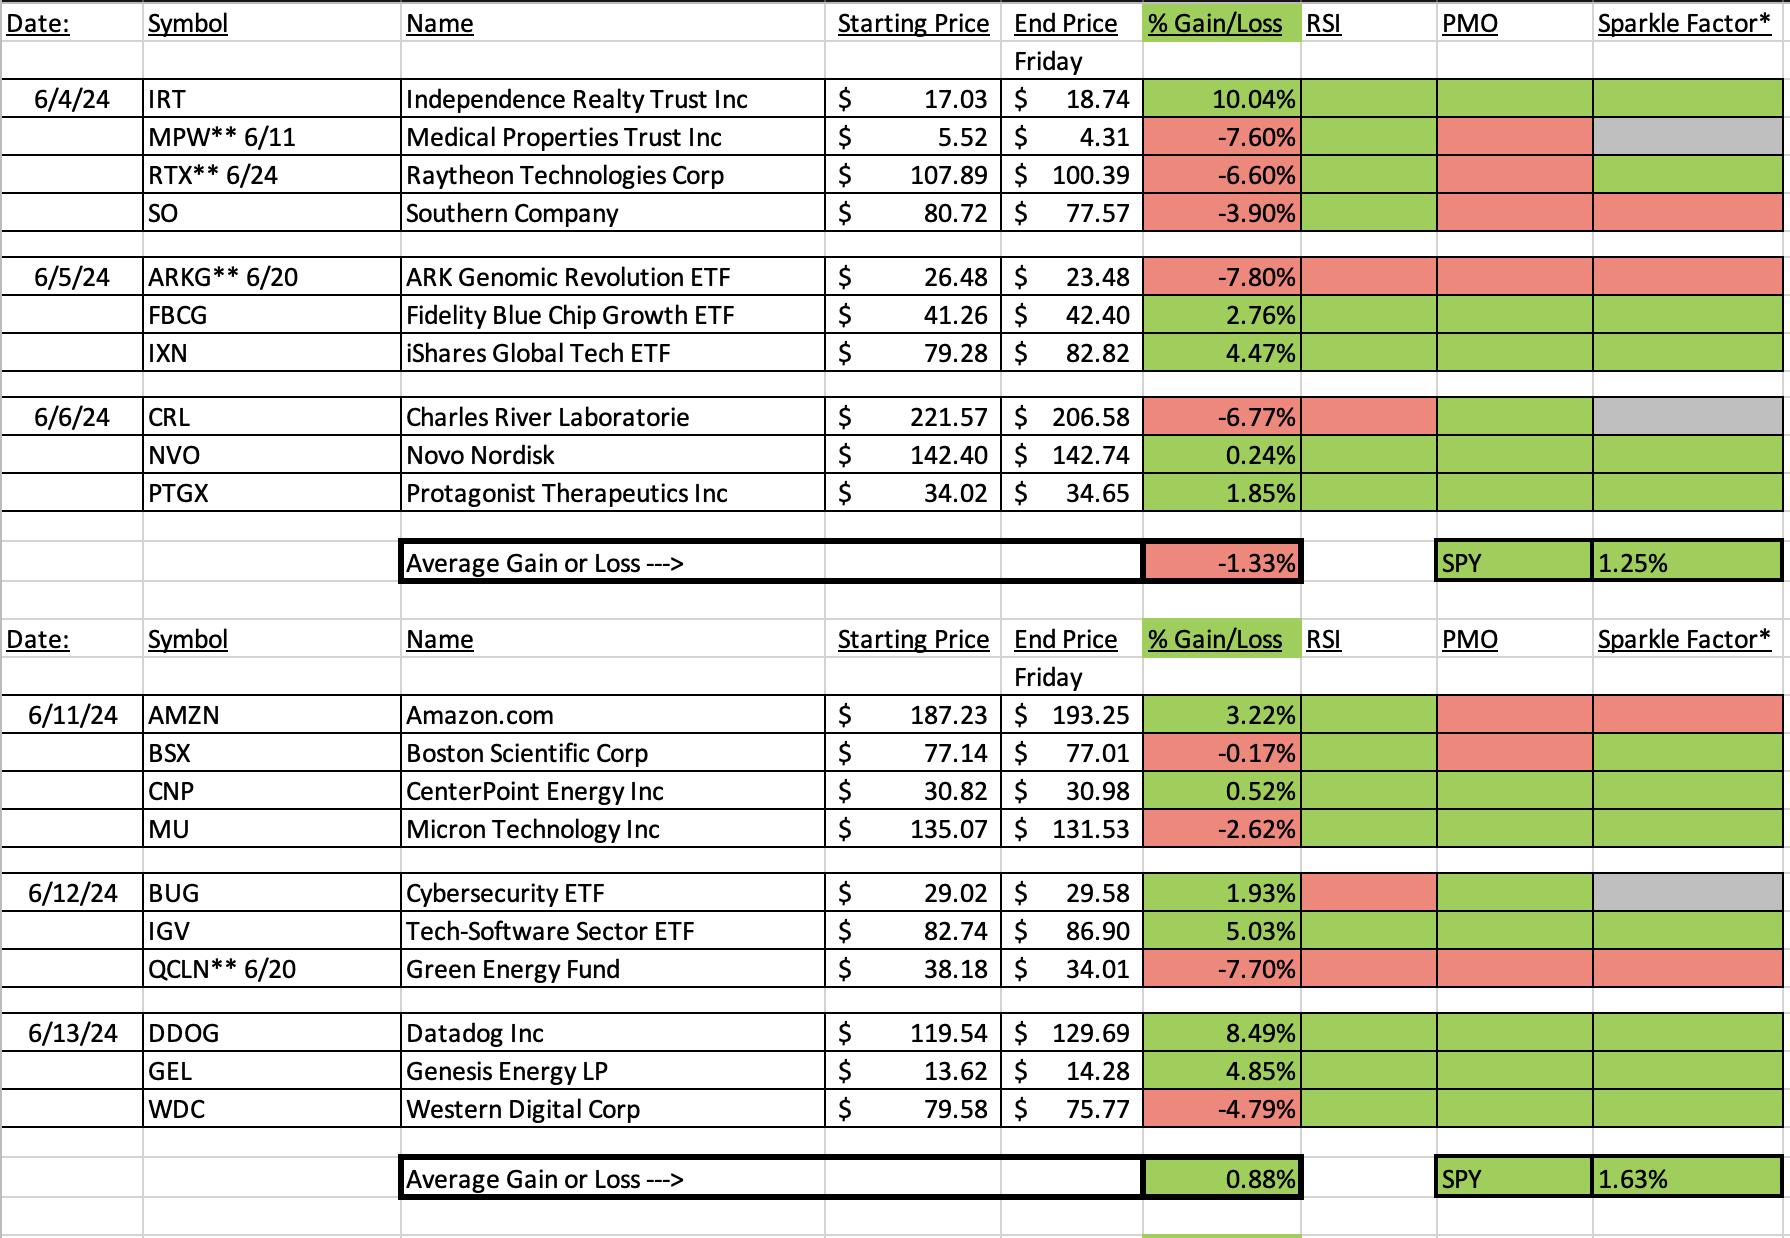
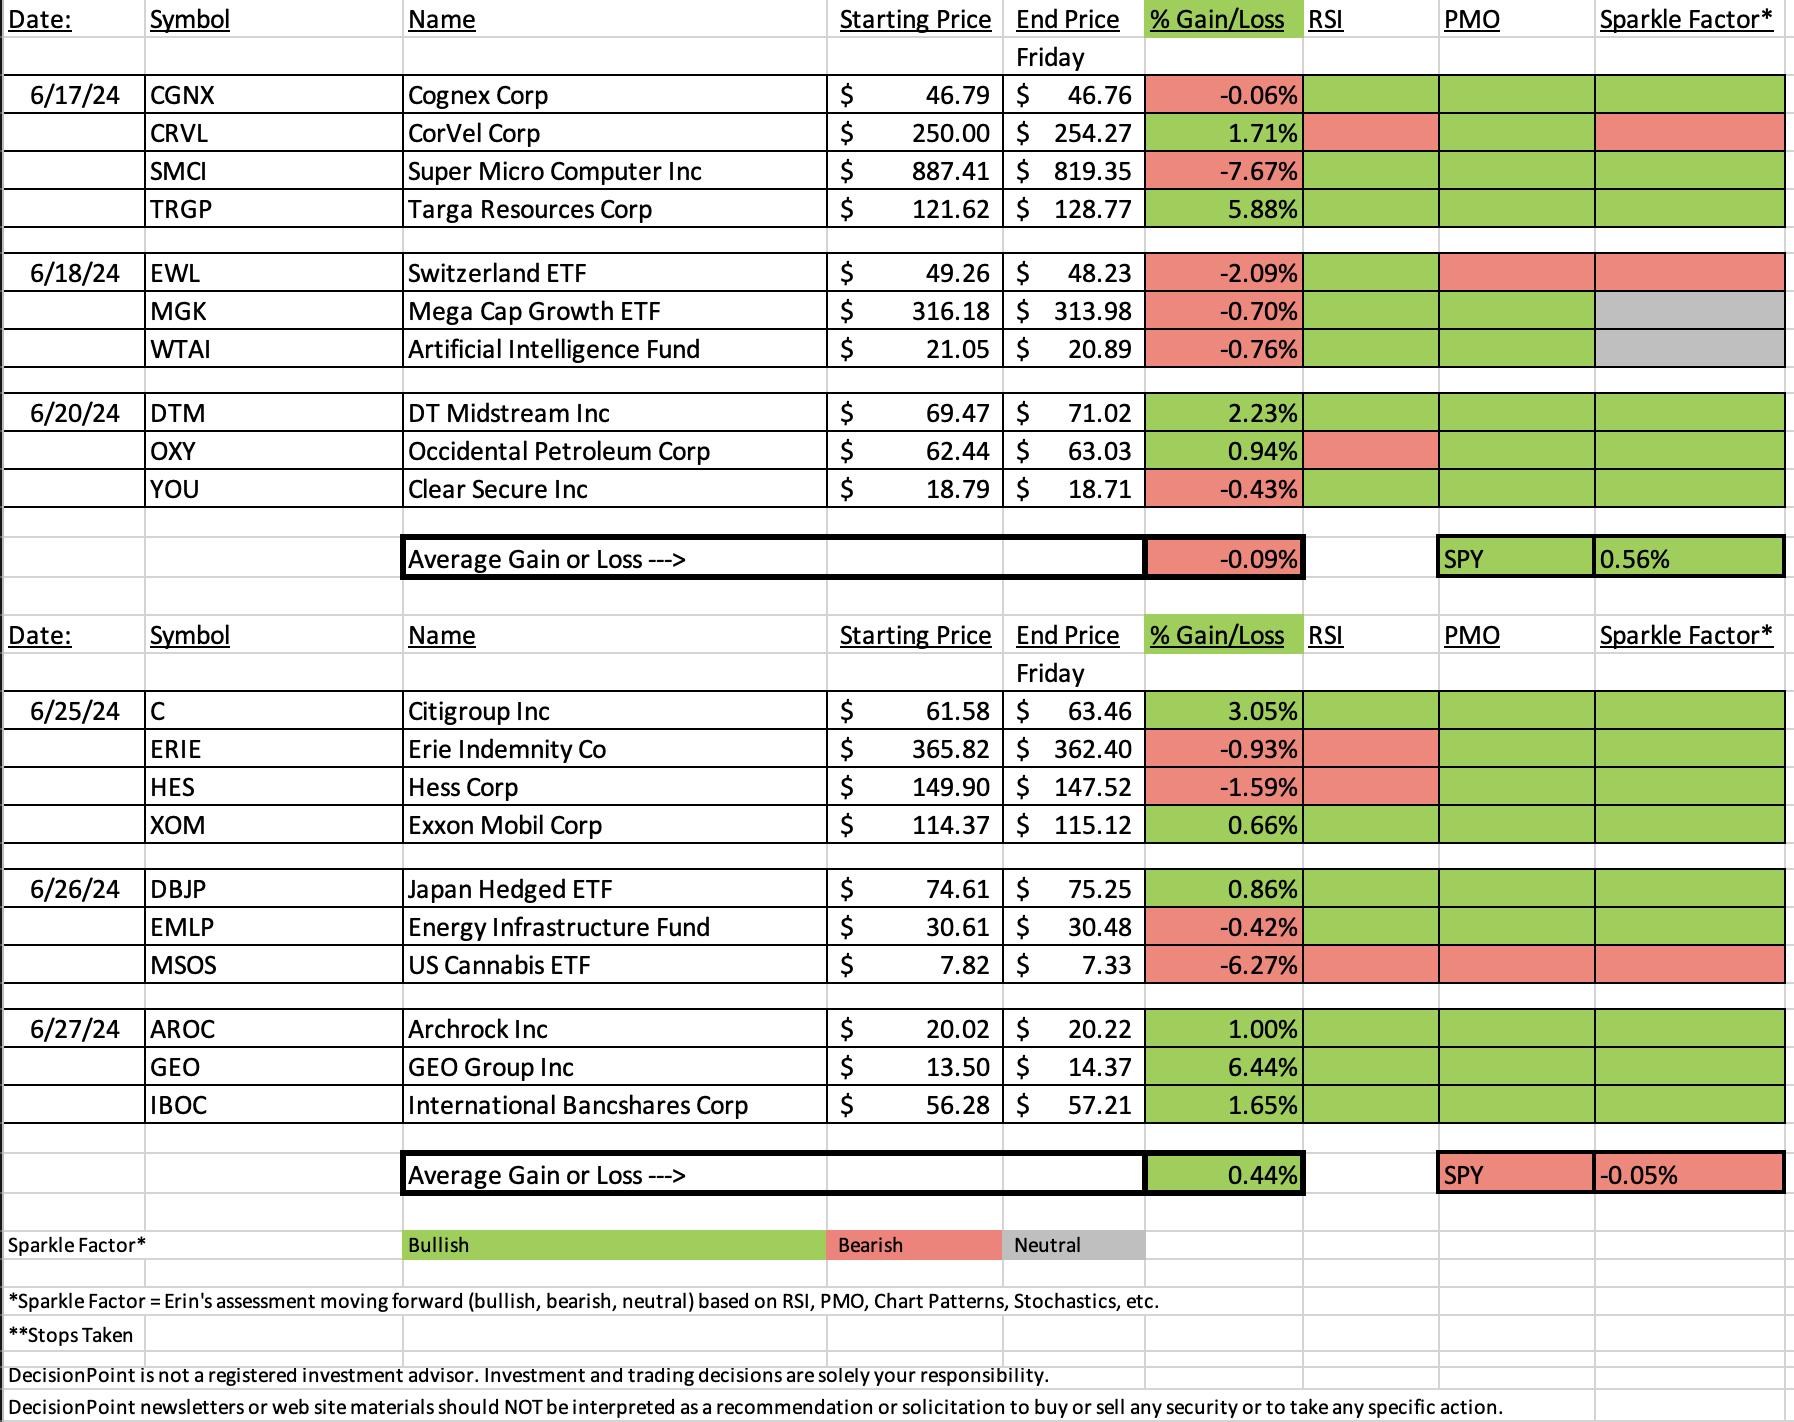
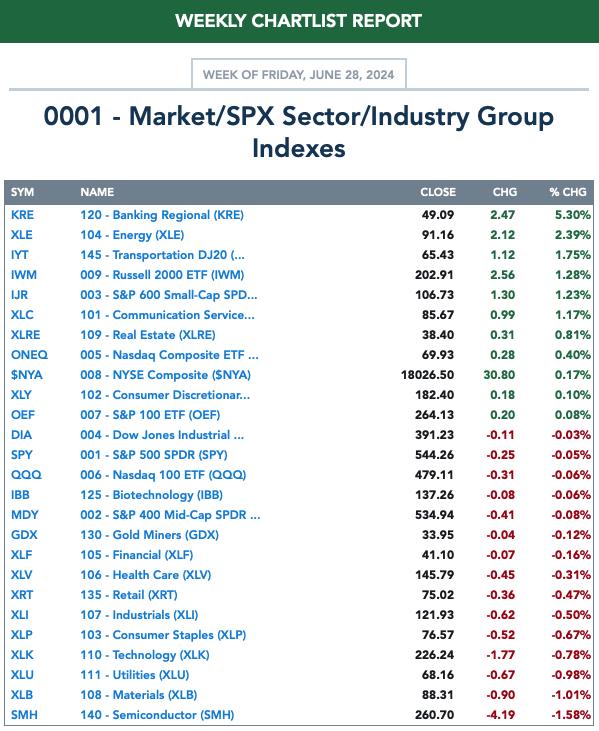
It's been awhile since we beat the SPY so it is cause for celebration this week. The SPY was down on the week -0.05%, but "Diamonds in the Rough" finished higher +0.44%. It would've been even better, but the Cannabis ETF (MSOS) tanked this afternoon causing it to be this week's "DUD".
The "Darling" was GEO Group (GEO) which was up over 6% on the day. It cancels out MSOS. MSOS was listed as a "Boom or Bust" ETF which means it could do very well or it could collapse. Unfortunately, it collapsed.
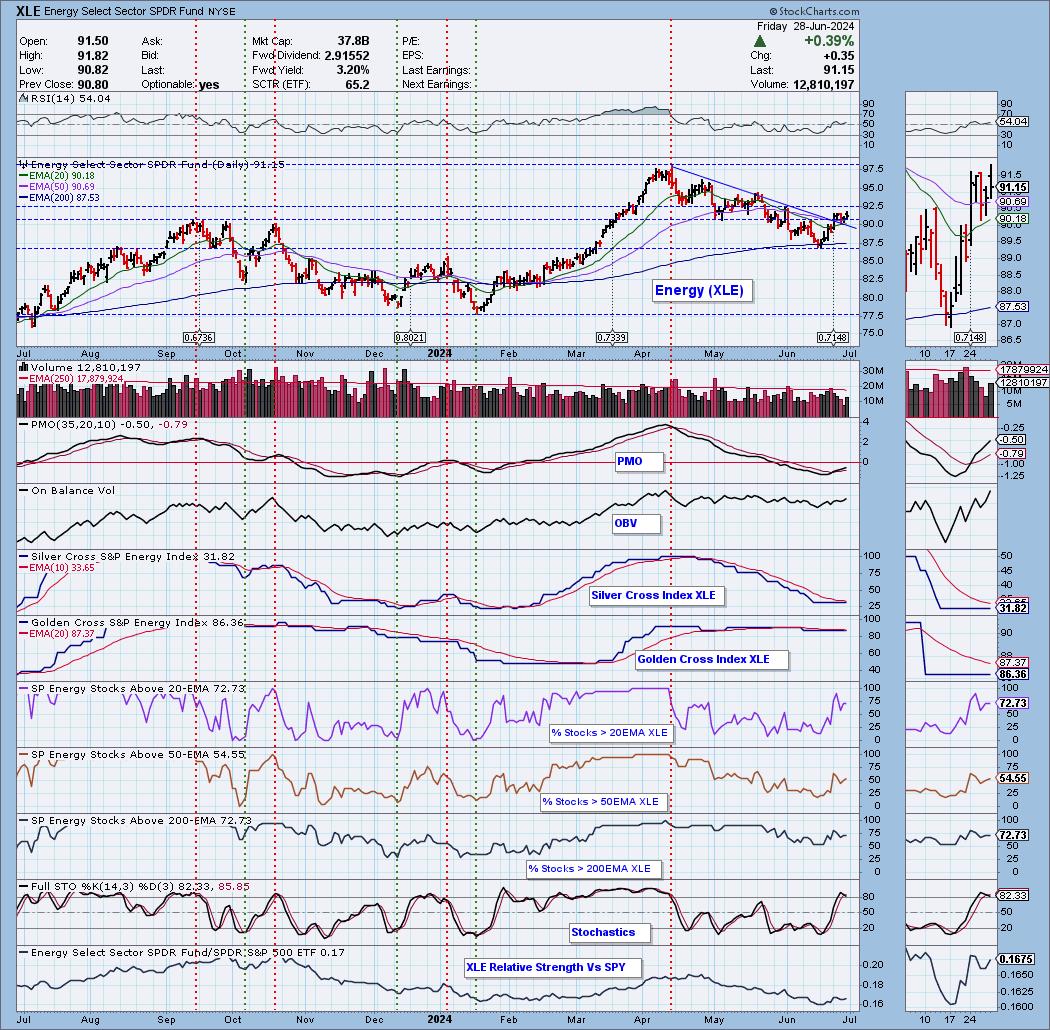
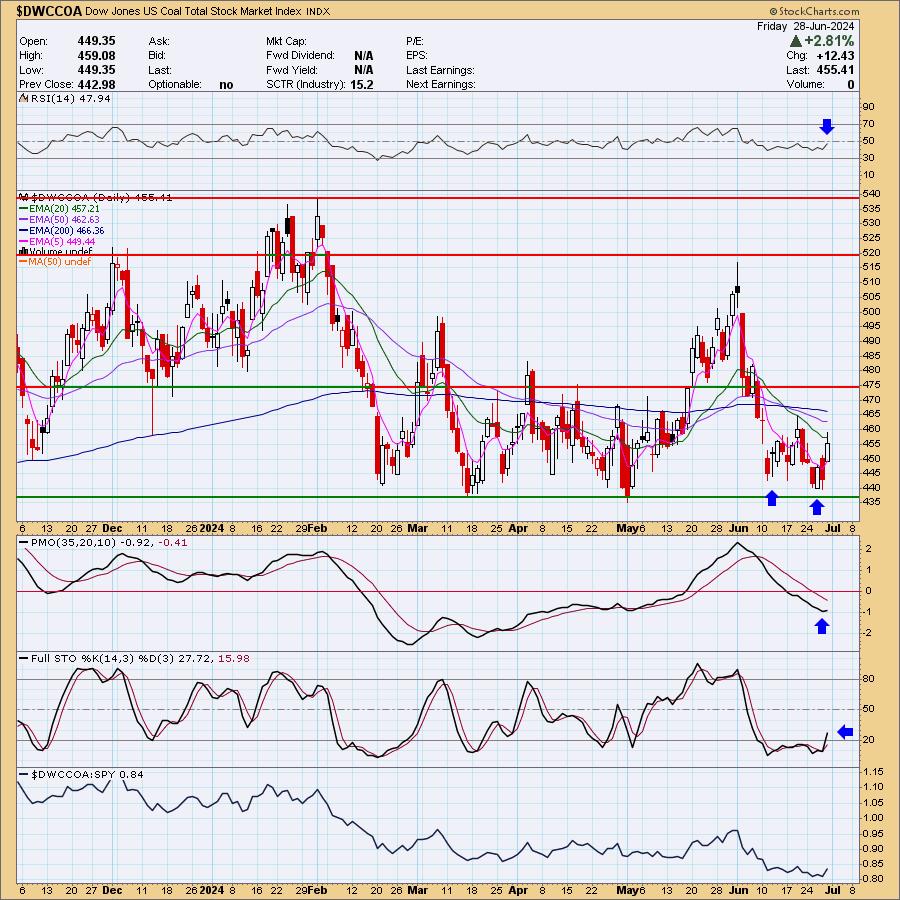
The Sector to Watch was difficult to come up with this morning so I decided to take a poll. It was decided after analysis that Energy (XLE) would be our Sector to Watch. It is overdue for a good rally given the rally in Crude Oil. The Industry Group to Watch was interestingly, Coal. It's PMO hasn't turned up yet, but we found some excellent candidates within the group that suggests to me we will see a new rally in Coal. The symbols from this area were: ARLP, CEIX, HNRG and SXC.
I had time to run two scans at the end of the trading room. The Diamond PMO Scan and Momentum Sleepers Scan gave us the following symbols to watch next week: BOX, OTTR, STRA, CORT, CRS and GKOS.
See you in the Monday trading room!
Good Luck & Good Trading,
Erin

RECORDING & DOWNLOAD LINK (6/28/2024):
Topic: DecisionPoint Diamond Mine (6/28/2024) LIVE Trading Room
Download & Recording Link HERE
Passcode: June#28th
REGISTRATION for 7/5/2024:
When: July 5, 2024 09:00 AM Pacific Time (US and Canada)
Topic: DecisionPoint Diamond Mine (7/5/2024) LIVE Trading Room
Register in advance for this webinar HERE.
After registering, you will receive a confirmation email containing information about joining the webinar.

Below is the latest free DecisionPoint Trading Room recording from 6/24. You'll find these recordings posted on Mondays to our DP YouTube Channel. Be sure and subscribe HERE.
A few items about the spreadsheet: I've put on the spreadsheet whether the RSI is positive (green) or negative (red). The PMO column tells you if it is rising (green) or falling (red). Finally I've added my own "Sparkle Factor" that gives you my assessment going forward, bullish (green), bearish (red) or neutral (gray). The Sparkle Factor is basically my thoughts on whether I expect it to rise or fall. A neutral means it could really go either way so it could be added to a watch list. If you're in a stock I consider "neutral" going forward, the ball is in your court.
Darling:
GEO Group, Inc. (GEO)
EARNINGS: 08/07/2024 (BMO)
The GEO Group, Inc. engages in the design, financing, development, and support services for secure facilities, processing centers, and community re-entry facilities. It operates through the following segments: U.S. Secure, Electronic Monitoring and Supervision, Reentry, and International Services. The U.S. Secure Services segment encompasses the United States-based public-private partnership corrections and detention business. The Electronic Monitoring and Supervision Services segment conducts its services in the U.S. The Reentry Services Segment consists of various community-based and reentry services. The International Services segment consists of public-private partnership secure services operations in Australia and South Africa. The company was founded by George C. Zoley in 1984 and is headquartered in Boca Raton, FL.
Predefined Scans Triggered: Bullish MACD Crossovers.
Below are the commentary and chart from Thursday, 6/27:
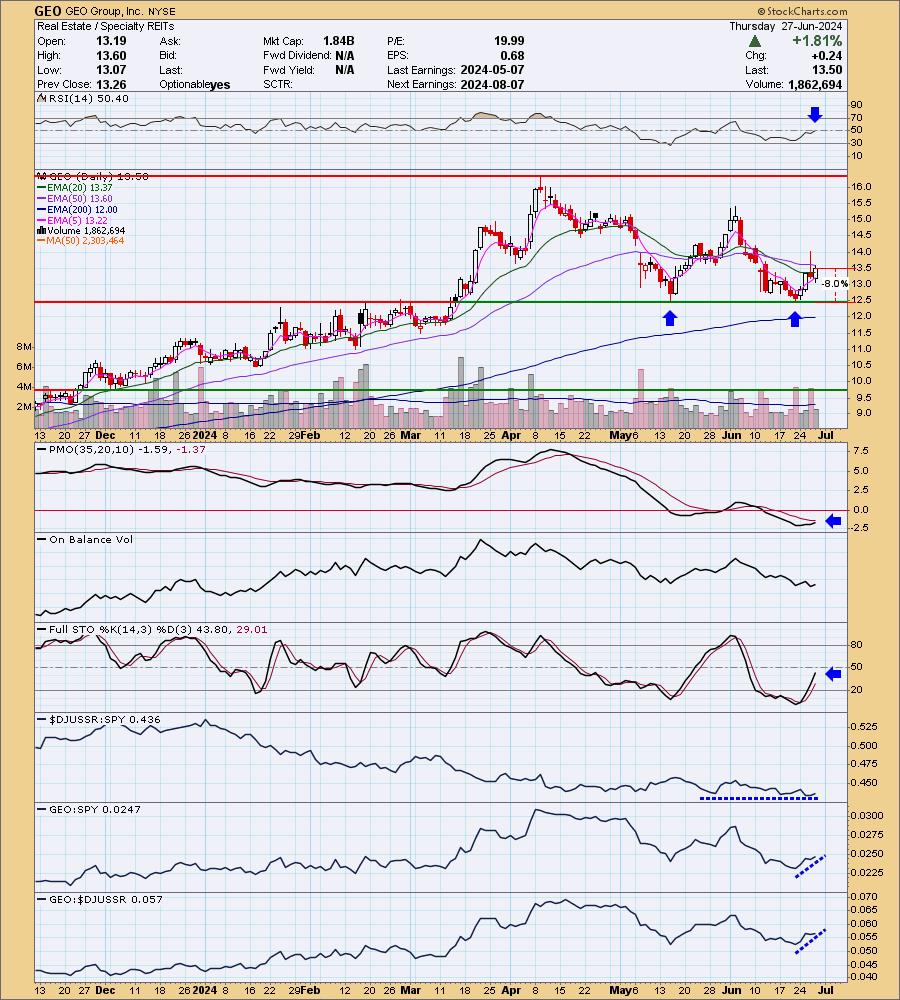
"GEO is down -1.93% in after hours trading so a better entry could be available tomorrow. I really like the big double bottom pattern that suggests a minimum upside target all the way to $18.50. The RSI just entered positive territory and the PMO is rising toward a Crossover BUY Signal. Stochastics are rising strongly. The group is holding its own, but GEO is showing outperformance against both the group and the SPY. The stop is a little deep and could be slightly deeper to put it below support. It's set at 8% or $12.42."
Here is today's chart:
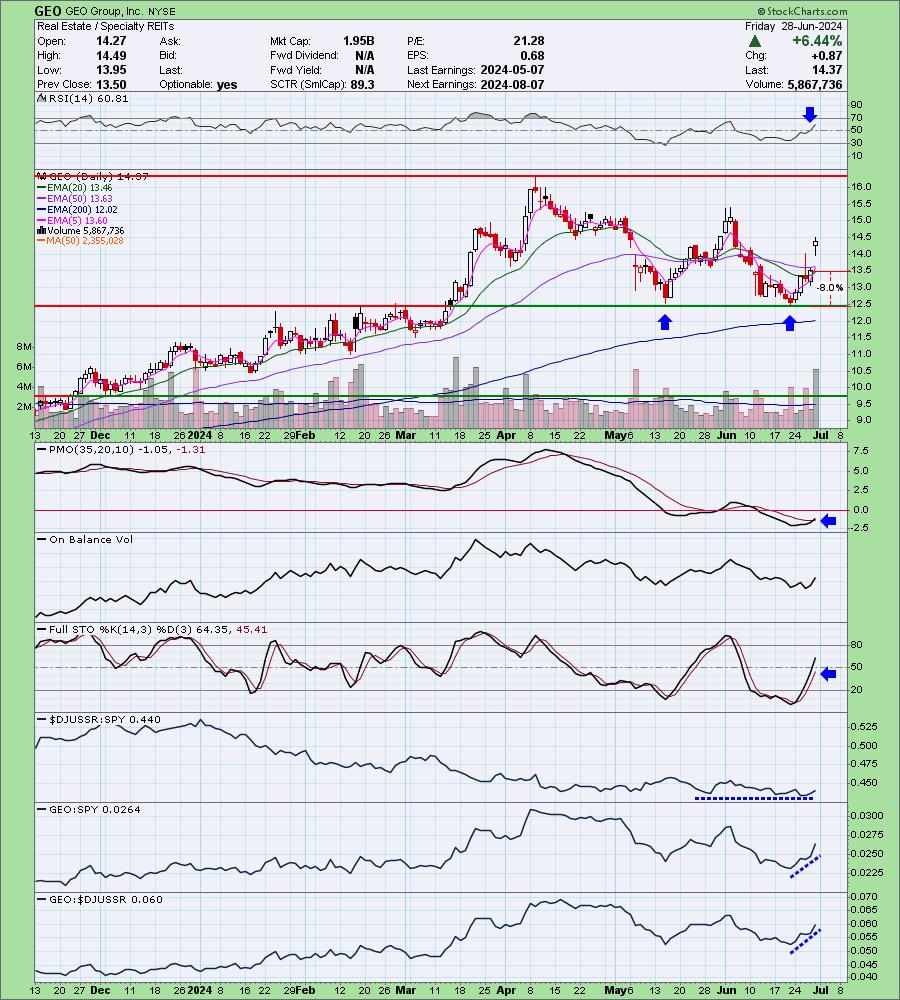
This chart looks fantastic with this breakout. Price is headed to the confirmation line of the large double bottom formation that suggests much more upside ahead. The chart was set up well yesterday and nothing has changed. It still isn't overbought so I'm considering picking up this 'winner that keeps on winning'...at least that is the idea, we'll see how it holds up.
Don't forget, on Thursdays I look at reader-requested symbols, so shoot me an email at erin@decisionpoint.com. I read every email I receive and try to answer them all!
Dud:
AdvisorShares Pure US Cannabis ETF (MSOS)
EARNINGS: N/A
MSOS is an actively managed narrow portfolio of US stocks or swap contracts related to the domestic cannabis and hemp industry. Click HERE for more information.
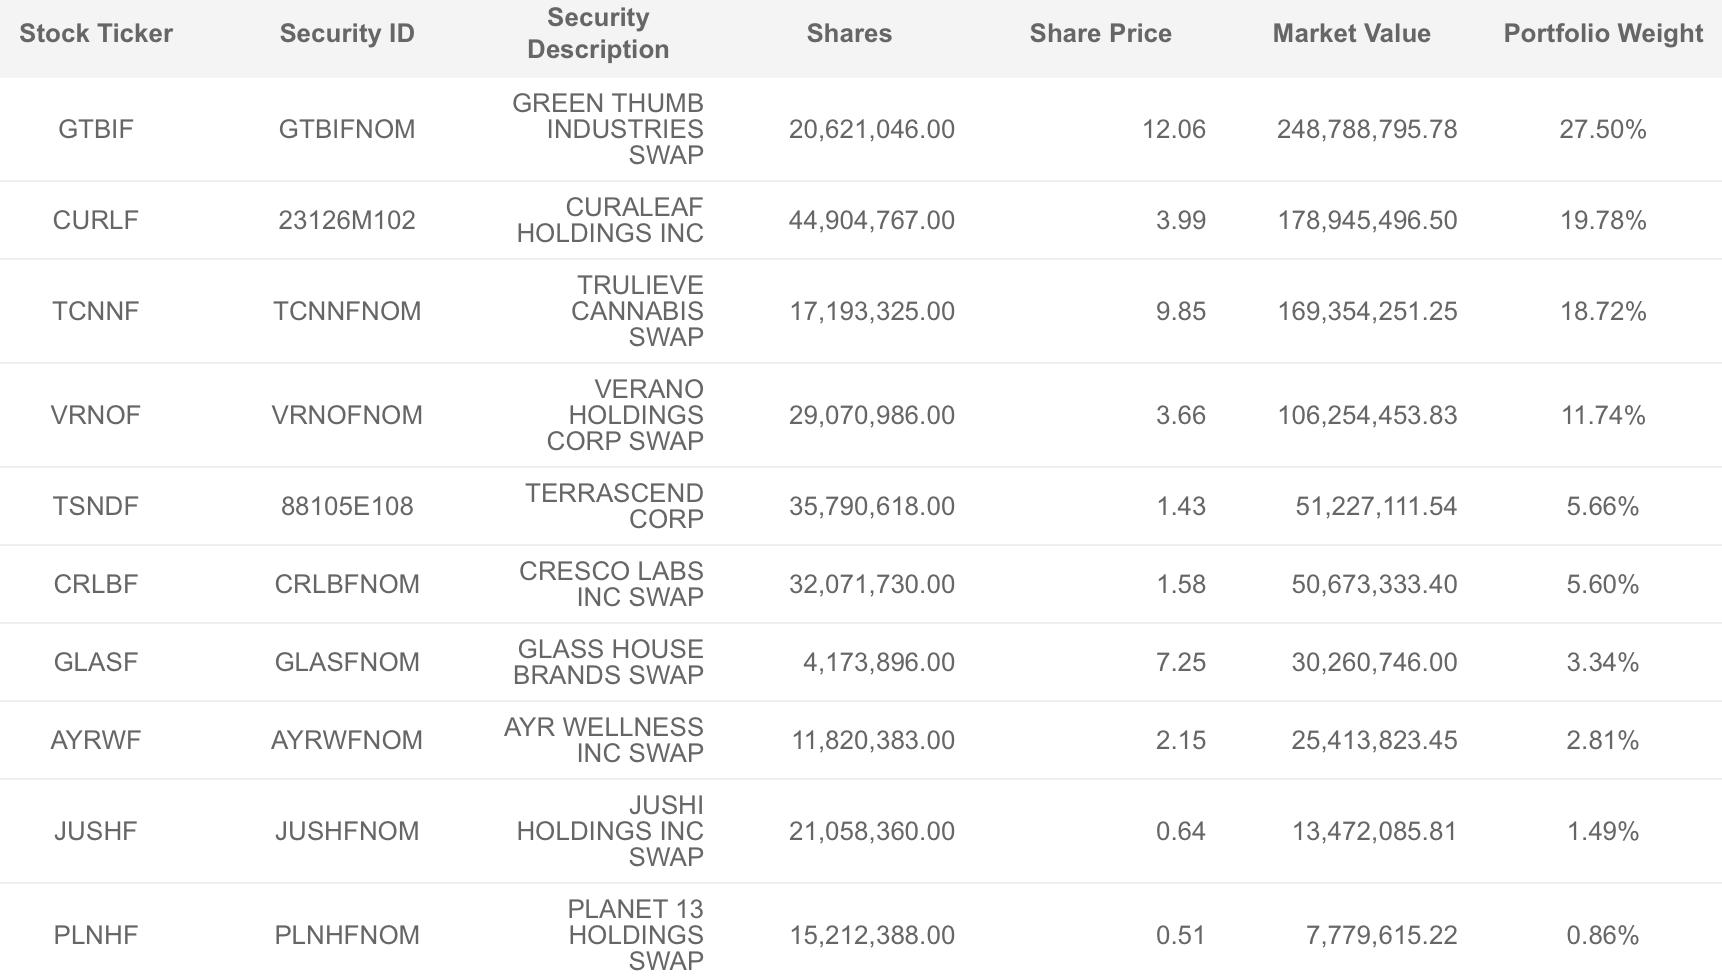
Predefined Scans Triggered: P&F Double Bottom Breakdown.
Below are the commentary and chart from Wednesday, 6/26:
"MSOS is down -0.12% in after hours trading. I like this reversal coming just below support. It is a trading range, but it is a long way to the top of that range and that could be very lucrative. It has a nice "V" bottom shape as well. The RSI is not yet positive, but it is therefore not overbought. I like the new PMO Crossover BUY Signal. We see that the OBV is rising to confirm the rally. Stochastics are almost above 80. The ETF is also outperforming the market right now. This is a low-priced ETF so position size wisely. The stop is set beneath the March low at 7.8% or $7.21."
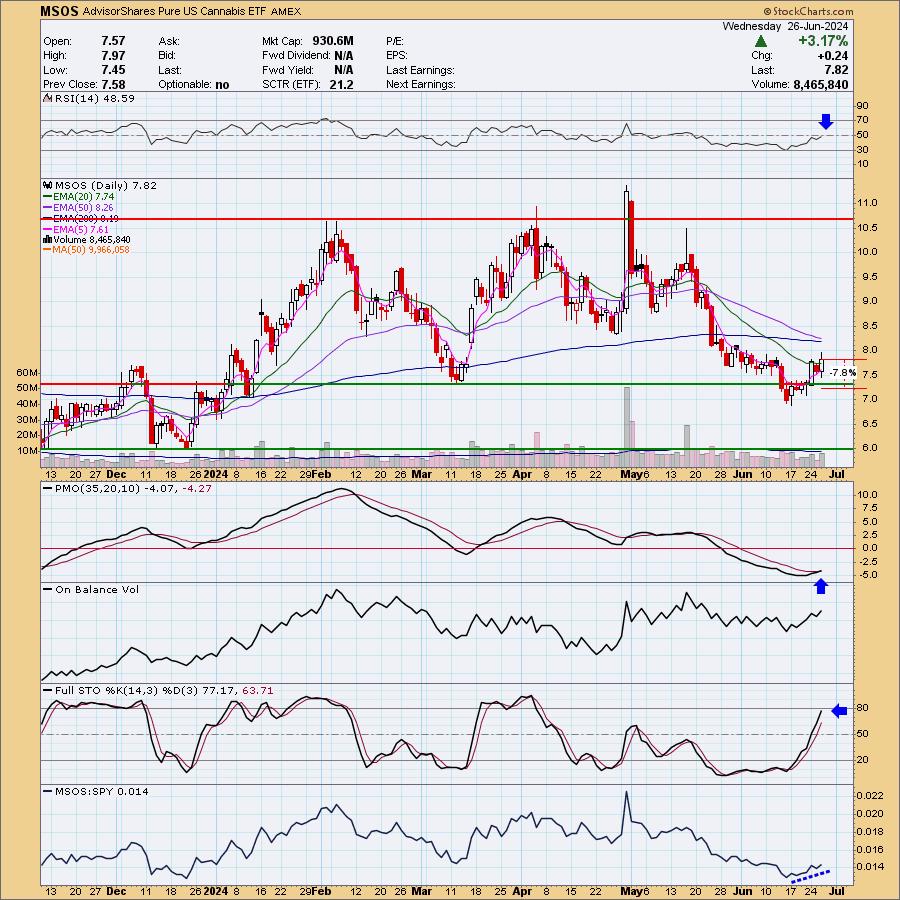
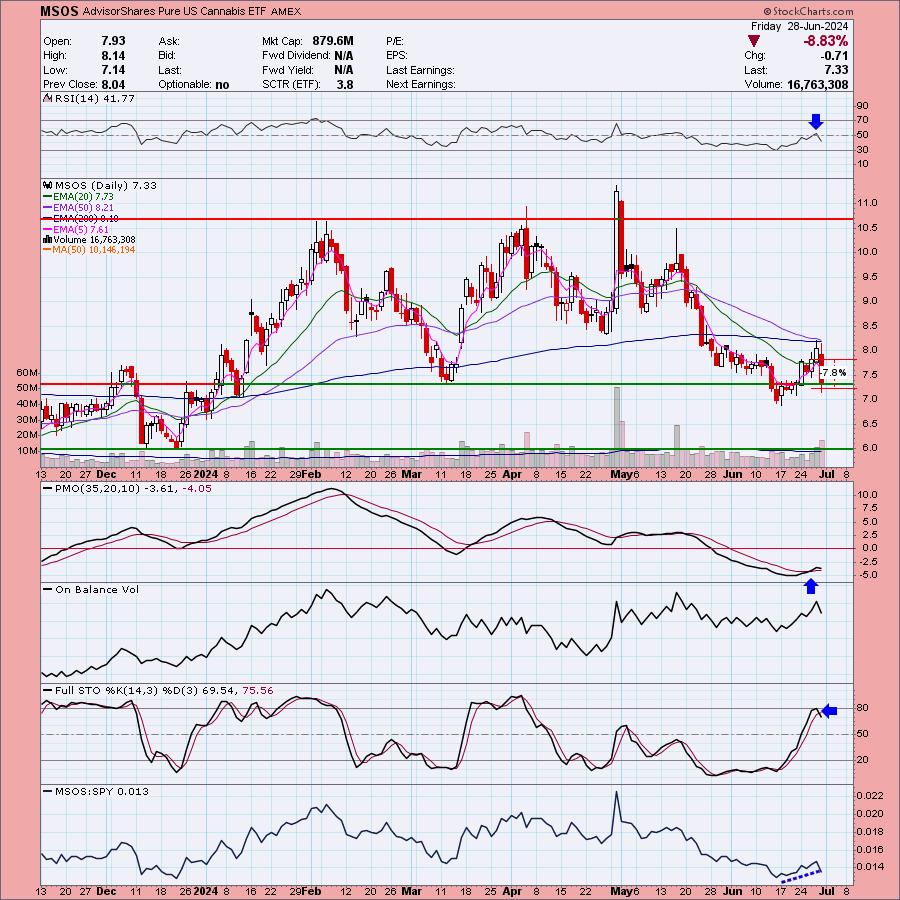
Here is today's chart:
We go one day of follow through rally and then it tanked today. It didn't trigger the stop, but I expect that it will given the voracity of today's decline. Where did this one go wrong? It's a very volatile group so it was listed as a boom or bust ETF. It busted. The indicators looked good, but that nearing Death Cross of the 50/200-day EMAs was probably a hint that we might not get the follow through we were looking for.
THIS WEEK's Performance:
DecisionPoint Market Scoreboard (Mechanical Trend Model Signals):
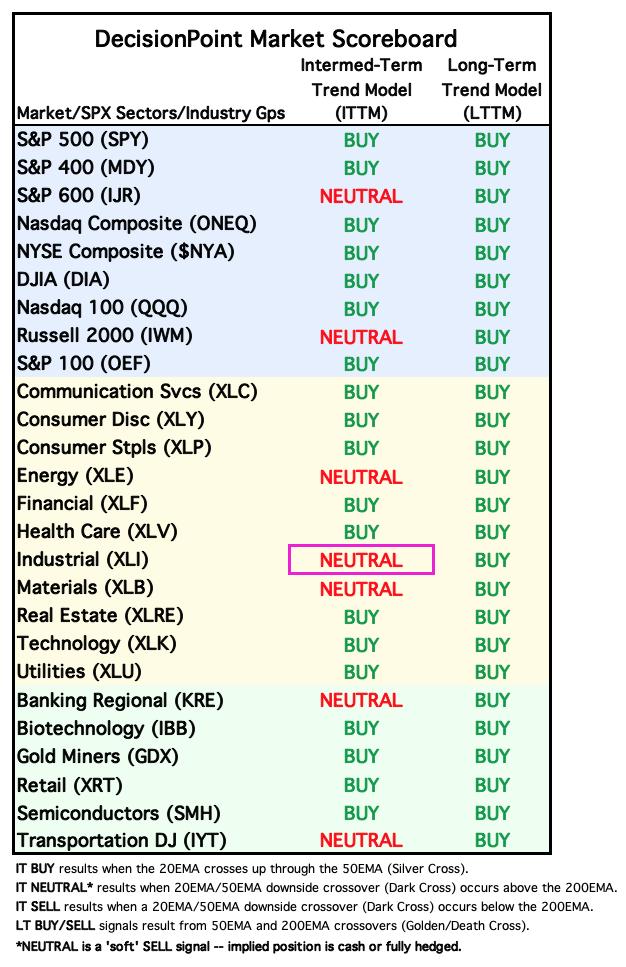
Friday signal changes are outlined in purple.
Click Here to view Carl's annotated "Under the Hood" ChartList!
Sector to Watch: Energy (XLE)
Energy just looks too good right now not to select it as Sector to Watch, but I will say that XLC and XLF had some promise. We're seeing a breakout from a declining trend with positive indicators. Participation is improving as more stocks begin to see positive momentum. Stochastics did top but they remain above 80. We're starting to see a rising trend in relative strength. There is still work to do based on the Silver Cross Index, but given %Stocks > 20/50EMAs are reading higher, it should continue to move higher itself.
Industry Group to Watch: Coal ($DWCCOA)
There is an ETF for Coal (COAL), but it has little to no volume so I opted to just go with the industry group chart. We have a double bottom as Coal begins to bounce off strong support. The PMO has just turned up and Stochastics are beginning to rise. We're getting in here early so there is a chance of a rally failure, but given the chart pattern, I do think we will see a nice rally. Some stocks in this area to consider: ARLP, CEIX, HNRG and SXC.
Go to our Under the Hood ChartList on DecisionPoint.com to get an in-depth view of all the sectors. On StockCharts.com you can find the Industry Summary.
Good Luck & Good Trading!
- Erin
erin@decisionpoint.com
Full Disclosure: I'm 48% long, 0% short.
Watch the latest episode of the DecisionPoint Trading Room with Carl & Erin Swenlin on Mondays 3:00p EST!
Technical Analysis is a windsock, not a crystal ball. --Carl Swenlin
NOTE: The stocks reported herein are from mechanical trading model scans that are based upon moving average relationships, momentum and volume. DecisionPoint analysis is then applied to get selections from the scans. The selections given should prompt readers to do a chart review using their own analysis process. This letter is not a call for a specific action to buy, sell or short any of the stocks provided. There are NO sure things or guaranteed returns on the selection of "diamonds in the rough."
Helpful DecisionPoint Links:
DecisionPoint Shared ChartList and DecisionPoint Chart Gallery
Price Momentum Oscillator (PMO)
Swenlin Trading Oscillators (STO-B and STO-V)
(c) Copyright 2024 DecisionPoint.com