
We are starting to detect some weakness among the mega-cap darlings so we now must use caution on portfolio expansion and be sure that stops are set. Breadth continues to be a problem so picking stocks will continue to be a challenge particularly if the market does begin to slide. It's hard to imagine that the broad market will pick up any slack from mega-caps.
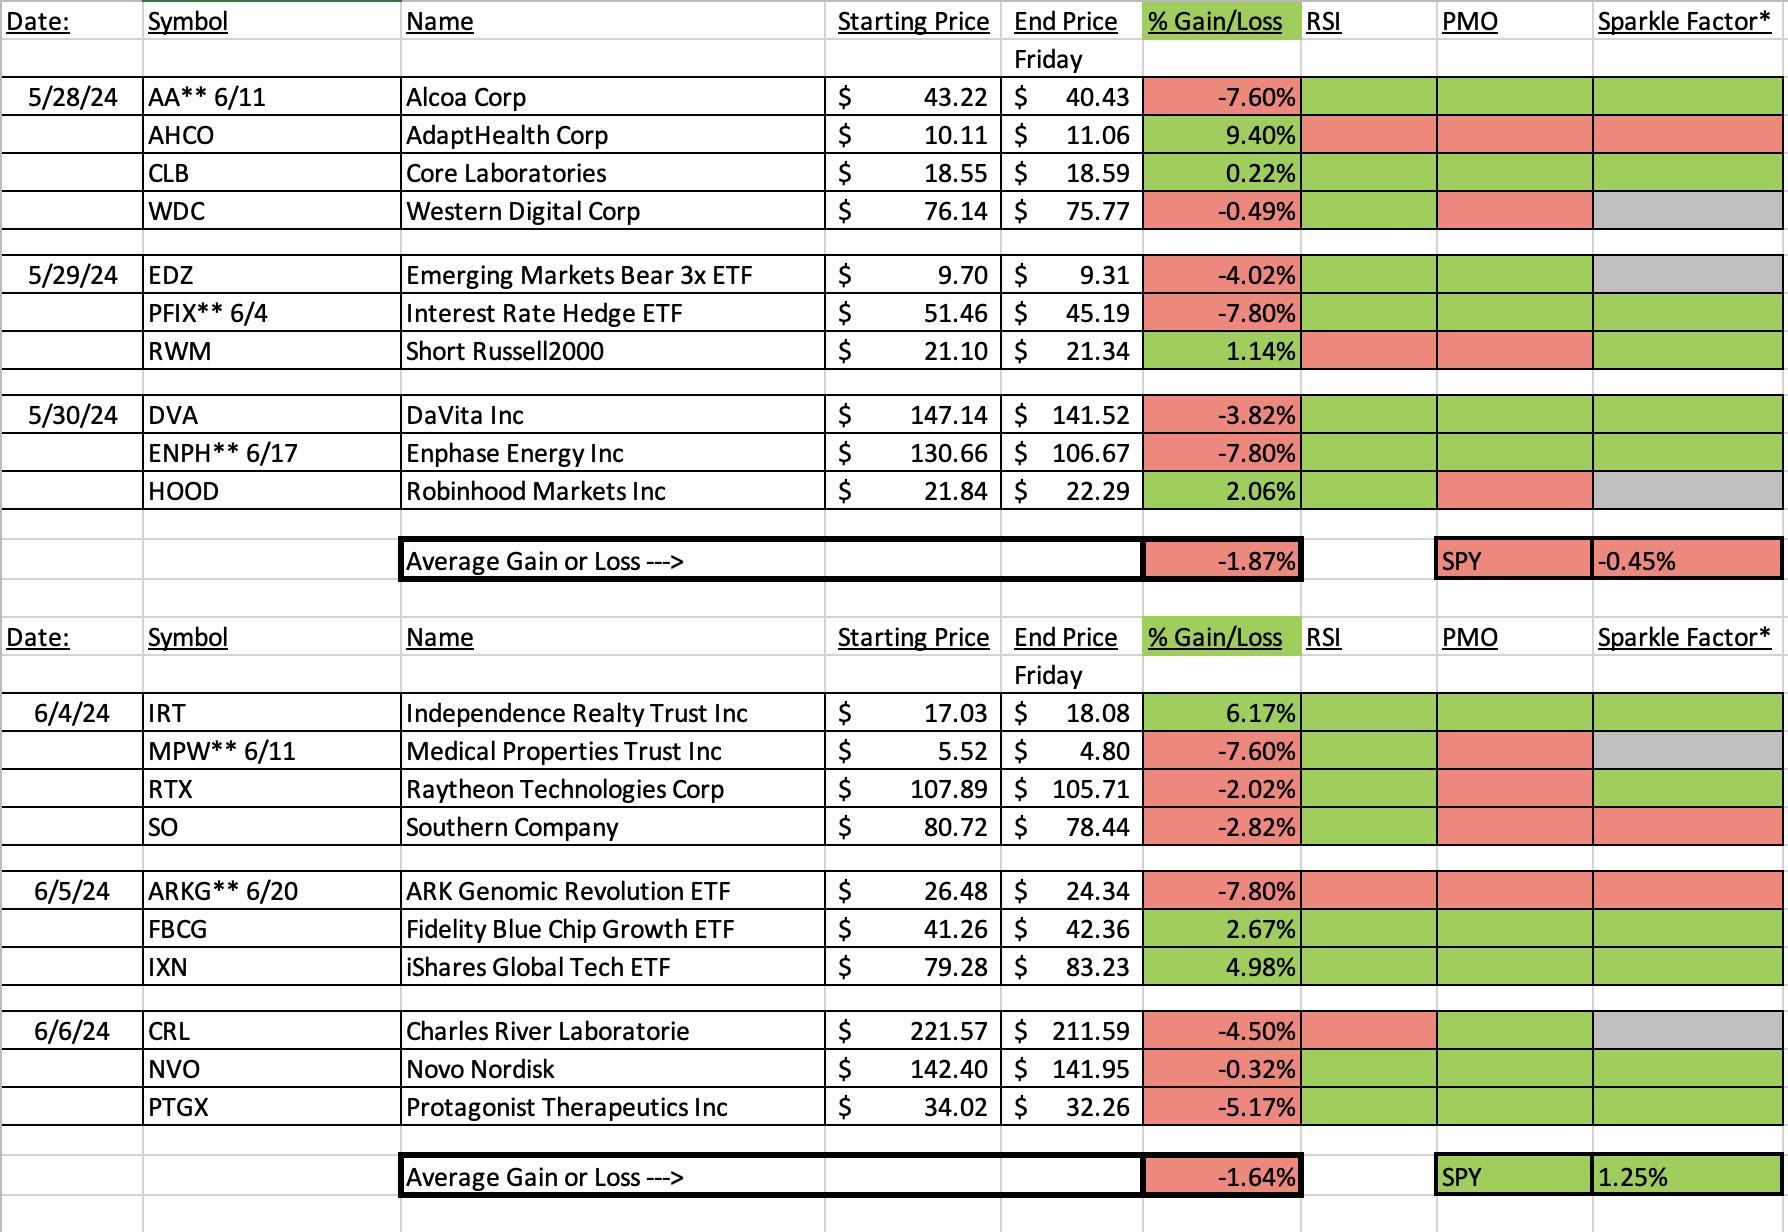
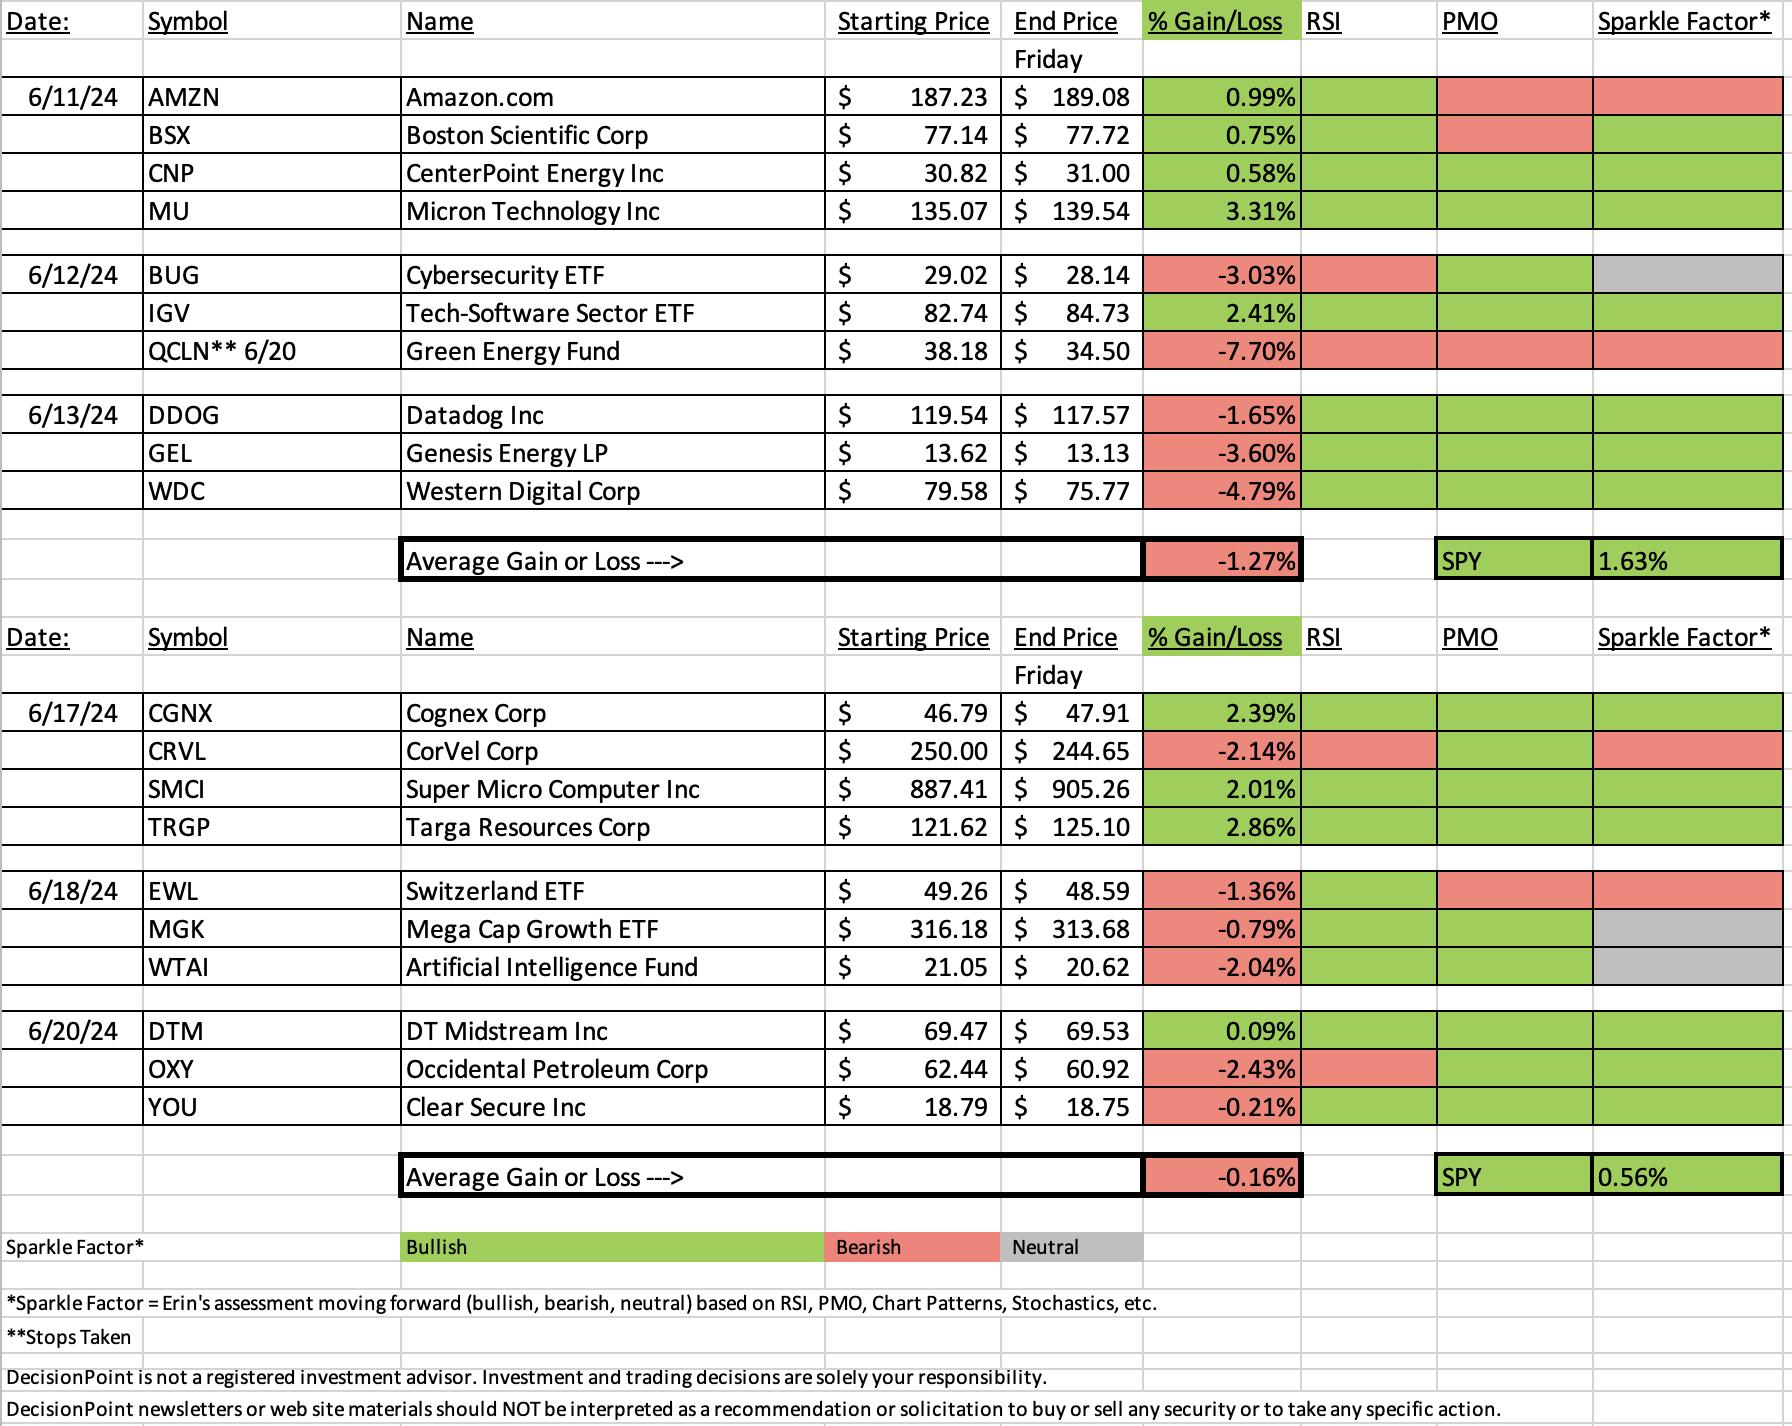
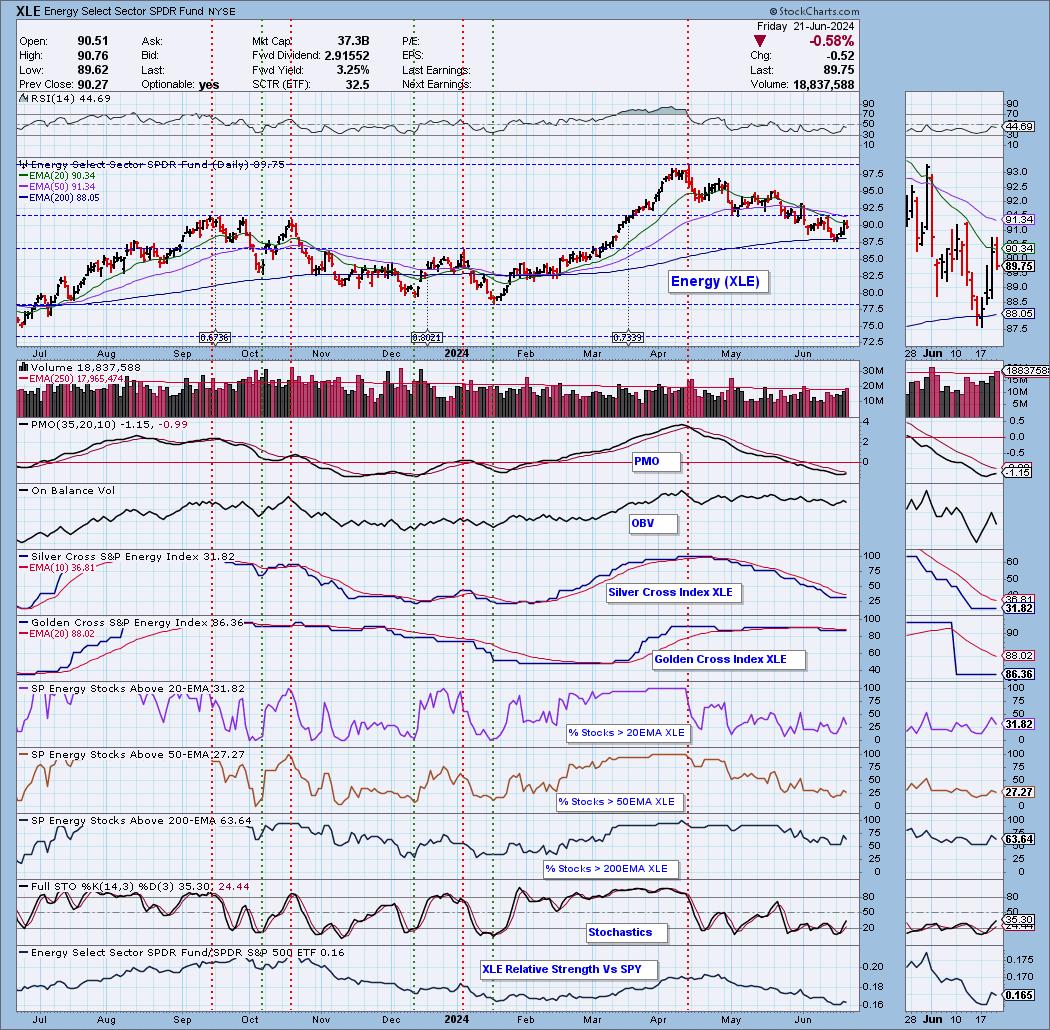
Energy is the Sector to Watch even though we don't have a breakout yet. It seems inevitable given the rally in Crude Oil. The Energy stocks picked this week should work well for exposure in this area. OXY didn't have a good day today, but I believe the Crude rally will eventually work in its favor. It had been up until today. On the other hand, Targa Resources (TGRP) was a "Darling" this week, up +2.86%.
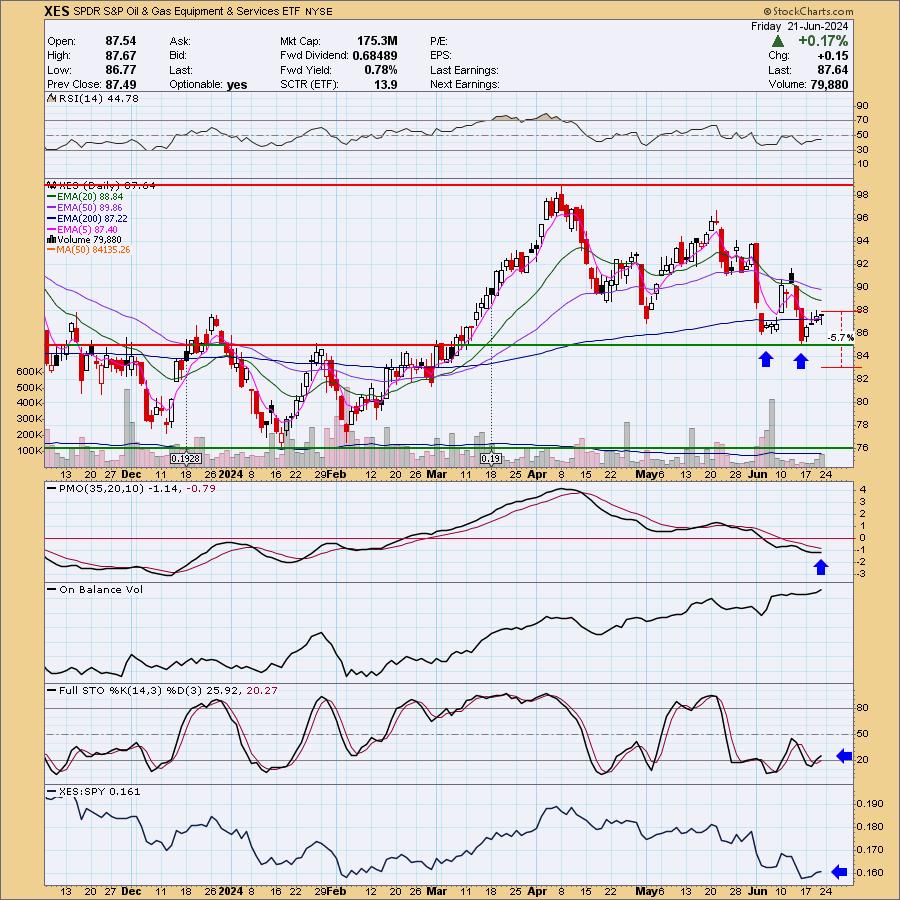
The Industry Group to Watch is Oil Equipment & Services. It looks like a good area to exploit if the rally finally gets going in this area of the market. Stock symbols we found this morning include: TNK, XPRO and LPG.
I did have time to run the Momentum Sleepers Scan this morning at the end of the trading room. I found some symbols to watch next week: ACHL, DLB, EXLS, LIVN, RJF, SCHL, TSN and VCEL.
See you in the Monday trading room!
Good Luck & Good Trading,
Erin

RECORDING & DOWNLOAD LINK (6/21/2024):
Topic: DecisionPoint Diamond Mine (6/21/2024) LIVE Trading Room
Recording & Download LINK
Passcode: June#21st
REGISTRATION for 6/28/2024:
When: Jun 28, 2024 09:00 AM Pacific Time (US and Canada)
Topic: DecisionPoint Diamond Mine (6/28/2024) LIVE Trading Room
Register in advance for this webinar HERE.
After registering, you will receive a confirmation email containing information about joining the webinar.

Below is the latest free DecisionPoint Trading Room recording from 6/17. You'll find these recordings posted on Mondays to our DP YouTube Channel. Be sure and subscribe HERE.
A few items about the spreadsheet: I've put on the spreadsheet whether the RSI is positive (green) or negative (red). The PMO column tells you if it is rising (green) or falling (red). Finally I've added my own "Sparkle Factor" that gives you my assessment going forward, bullish (green), bearish (red) or neutral (gray). The Sparkle Factor is basically my thoughts on whether I expect it to rise or fall. A neutral means it could really go either way so it could be added to a watch list. If you're in a stock I consider "neutral" going forward, the ball is in your court.
Darling:
Targa Resources Corp. (TRGP)
EARNINGS: 08/01/2024 (BMO)
Targa Resources Corp. provides midstream natural gas and natural gas liquids services. It also provides gathering, storing, and terminaling crude oil, and storing, terminaling, and selling refined petroleum products. It operates through the Gathering and Processing and Logistics and Transportation segments. The Gathering and Processing segment includes assets used in the gathering of natural gas produced from oil and gas wells and processing this raw natural gas into merchantable natural gas by extracting NGLs and removing impurities, and assets used for crude oil gathering and terminaling. The Logistics and Transportation segment focuses on the activities necessary to convert mixed NGLs into NGL products and provides certain value-added services such as the storing, fractionating, terminaling, transporting and marketing of NGLs and NGL products, including services to LPG exporters, and the storing and terminaling of refined petroleum products and crude oil and certain natural gas supply and marketing activities in support of its other businesses. The company was founded in October 2005 and is headquartered in Houston, TX.
Predefined Scans Triggered: Elder Bar Turned Green and P&F Double Top Breakout.
Below are the commentary and chart from Monday, 6/17:
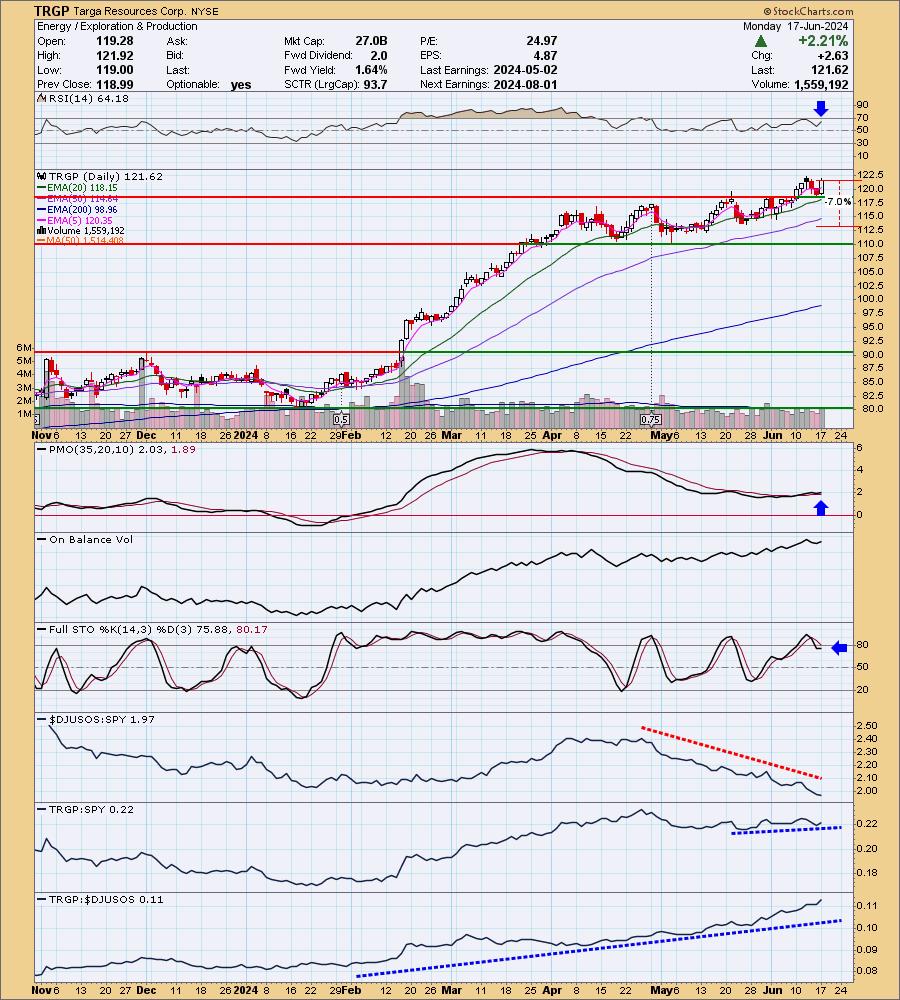
"TRGP is up +0.06% in after hours trading. The Energy sector hasn't gotten going yet, but the Crude Oil trade is shaping up. I liked TRGP because it has been rising while the Energy sector in general has been falling. It is bucking the trend so a Crude rally can only help in my opinion. The RSI is positive and not overbought. The PMO has surged above the signal line. Stochastics could be a bit better as they are flat, but they are in positive territory for now. The group has been suffering but TRGP has been a clear leader within the group. It is also seeing a little outperformance against the SPY right now. The stop is set beneath the 50-day EMA at 7% or $113.10."
Here is today's chart:
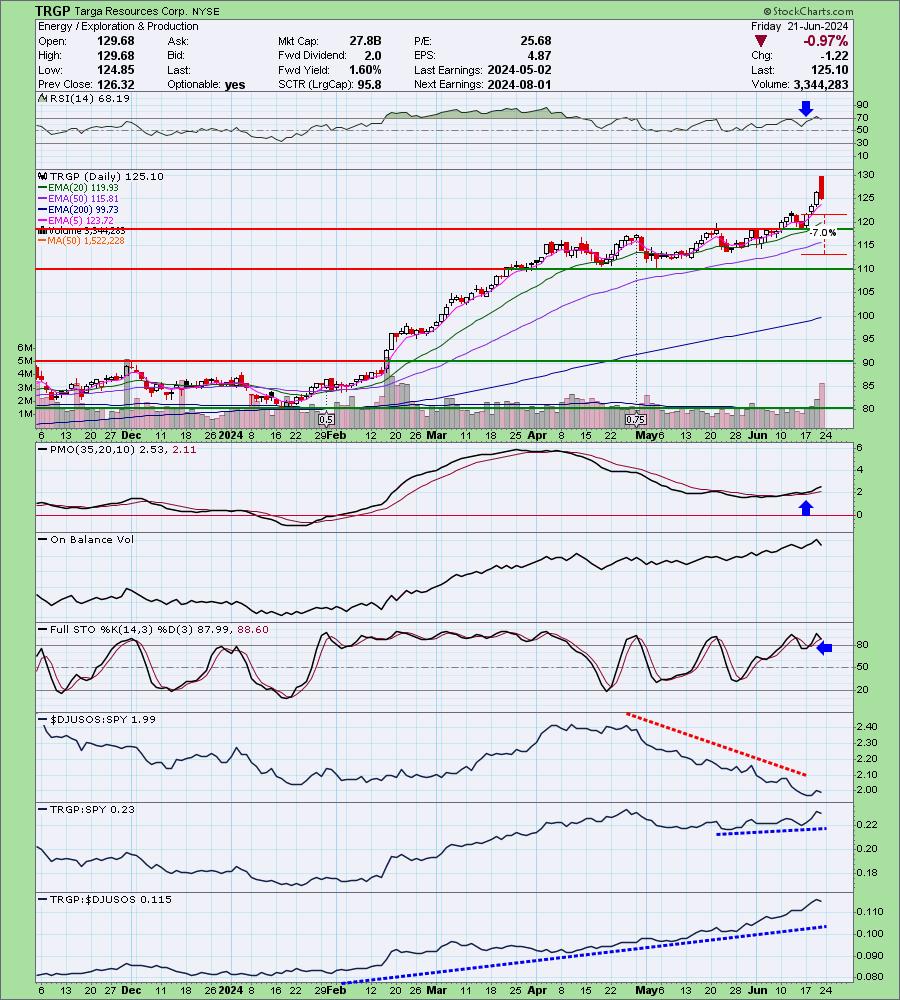
It wasn't a good day, but we still saw a higher low and higher high. This was a good decline as it took the RSI out of overbought territory and it offers a better entry point. The group is still suffering, but I do believe we will see this change with the Crude Oil trade. Everything is going right on the chart except for Stochastics topping. They are still above 80 so I am not overly concerned.
Don't forget, on Thursdays I look at reader-requested symbols, so shoot me an email at erin@decisionpoint.com. I read every email I receive and try to answer them all!
Dud:
Occidental Petroleum Corp. (OXY)
EARNINGS: 07/31/2024 (AMC)
Occidental Petroleum Corp. engages in the exploration and production of oil and natural gas. It operates through the following segments: Oil and Gas, Chemical, and Midstream and Marketing. The Oil and Gas segment explores for, develops and produces oil and condensate, natural gas liquids, and natural gas. The Chemical segment manufactures and markets basic chemicals and vinyls. The Midstream and Marketing segment purchases, markets, gathers, processes, transports and stores oil, condensate, natural gas liquids, natural gas, carbon dioxide, and power. The company was founded in 1920 and is headquartered in Houston, TX.
Predefined Scans Triggered: New CCI Buy Signals.
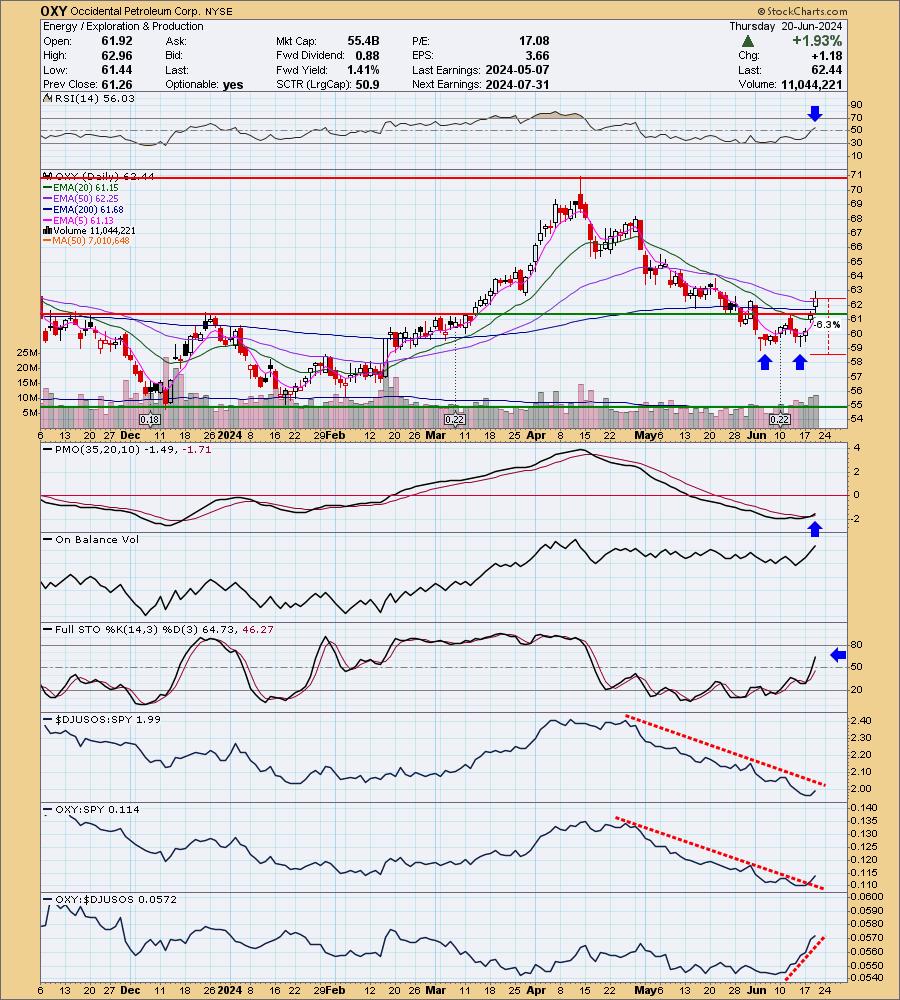
Below are the commentary and chart from Thursday, 6/20:
"OXY is up +0.22% in after hours trading. I really like the short-term bullish double bottom that has been confirmed with today's breakout move. The RSI has just now moved into positive territory. The PMO is on a new Crossover BUY Signal and Stochastics are making their way higher. Not surprisingly the group hasn't been performing well and neither has OXY against the SPY, but I believe we are going to see an upside reversal in Energy alongside a good Crude Oil trade. I do note that the declining tops on the relative strength line against the SPY was broken. If the group is going to turn around, this one is a big time leader within so it should see even more upside. The stop is set beneath support at 6.3% or $58.50."
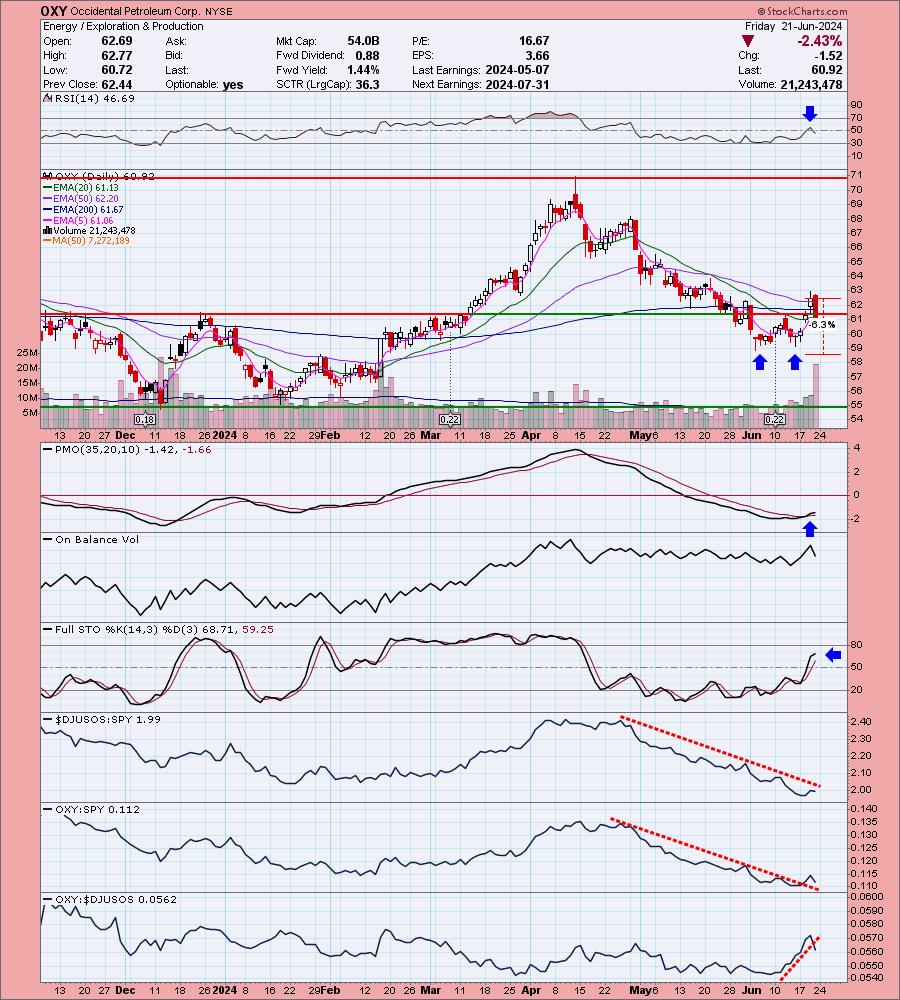
Here is today's chart:
It definitely was a bad day for OXY. It formed a bearish engulfing candlestick. This is going to offer a better entry. I like it moving forward. TGRP above was a Darling from this group and this one landed as the Dud. It does tend to outperform its group so I'm not sure what went on here. I still think this one has upside potential.
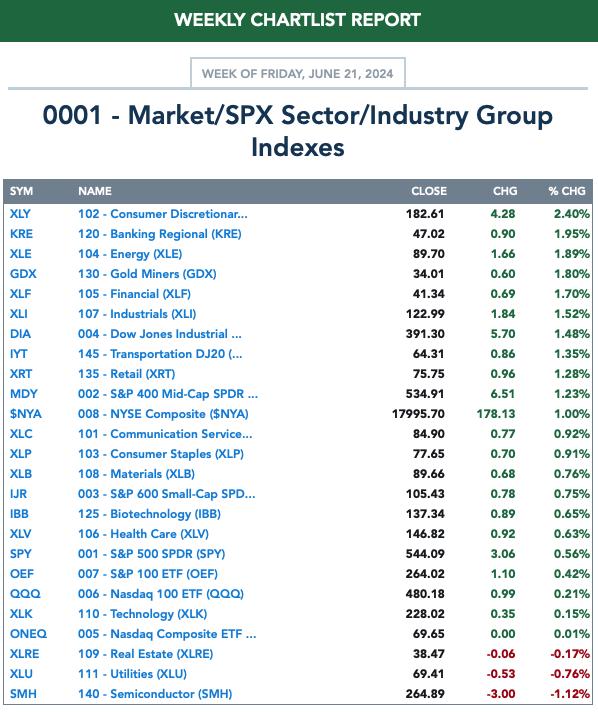
THIS WEEK's Performance:
DecisionPoint Market Scoreboard (Mechanical Trend Model Signals):
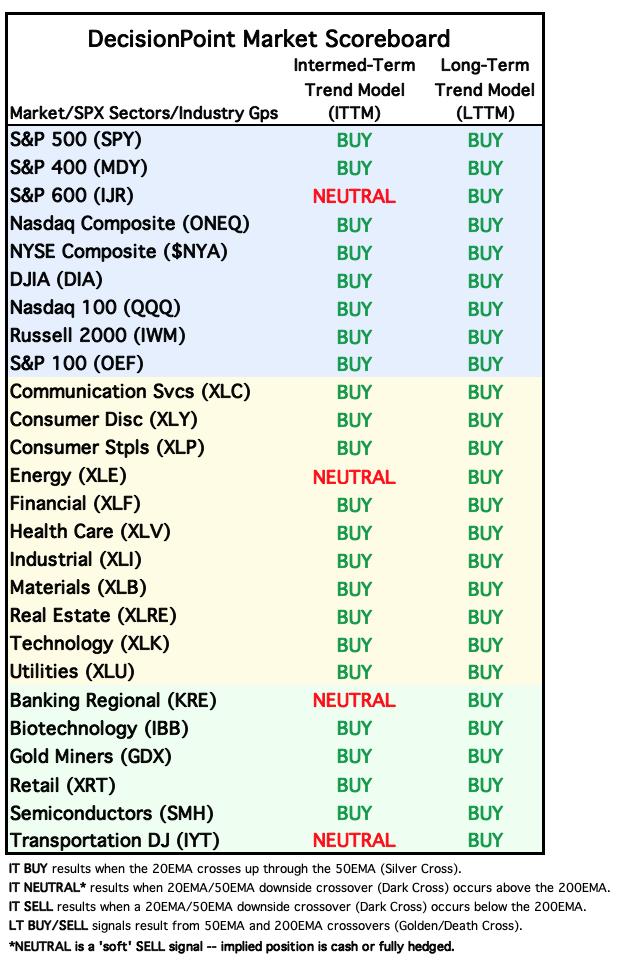
Friday signal changes are outlined in purple.
Click Here to view Carl's annotated "Under the Hood" ChartList!
Sector to Watch: Energy (XLE)
This is a Sector to "Watch". It isn't completely ready for prime time given weak participation numbers under the hood. The Silver Cross Index is also anemic, but given the rise in Crude Oil I think it is just a matter of time before this group reawakens. We have a very large bull flag on the chart and now the PMO has turned back up. Stochastics are beginning to rise. It is early here and it may not break the declining trend so tread carefully.
Industry Group to Watch: Oil Equipment & Services (XES)
Since I had an ETF for this group I decided to use it today. The group interests me primarily due to the double bottom pattern that is developing. The PMO has decelerated and is ready to turn back up. The RSI is still bearish, but rising. Stochastics have turned up and we can see a bit of outperformance creeping in. Keep an eye on Energy!
Go to our Under the Hood ChartList on DecisionPoint.com to get an in-depth view of all the sectors. On StockCharts.com you can find the Industry Summary.
Good Luck & Good Trading!
- Erin
erin@decisionpoint.com
Full Disclosure: I'm 48% long, 0% short.
Watch the latest episode of the DecisionPoint Trading Room with Carl & Erin Swenlin on Mondays 3:00p EST!
Technical Analysis is a windsock, not a crystal ball. --Carl Swenlin
NOTE: The stocks reported herein are from mechanical trading model scans that are based upon moving average relationships, momentum and volume. DecisionPoint analysis is then applied to get selections from the scans. The selections given should prompt readers to do a chart review using their own analysis process. This letter is not a call for a specific action to buy, sell or short any of the stocks provided. There are NO sure things or guaranteed returns on the selection of "diamonds in the rough."
Helpful DecisionPoint Links:
DecisionPoint Shared ChartList and DecisionPoint Chart Gallery
Price Momentum Oscillator (PMO)
Swenlin Trading Oscillators (STO-B and STO-V)
(c) Copyright 2024 DecisionPoint.com