
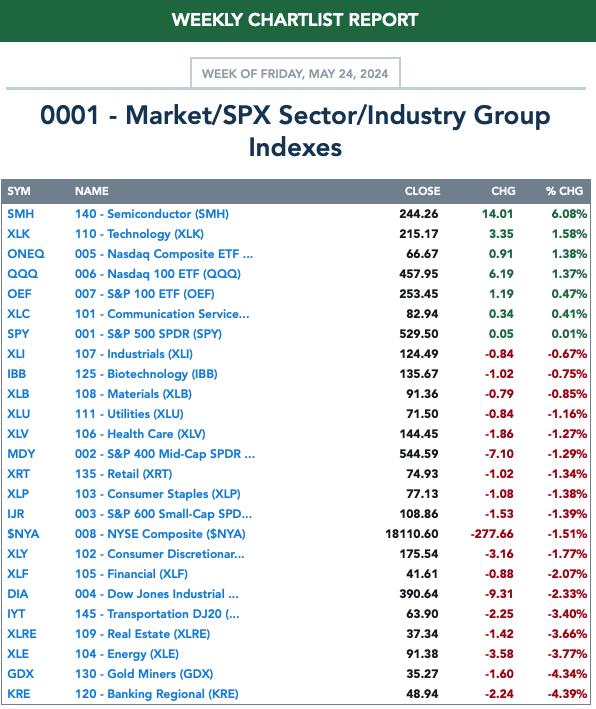
The market finished on a positive note today, basically ignoring all of the weak internals that we've been picking up for days now. We are not out of the woods. This is why this week's Sector to Watch and Industry Group to Watch, are just that, to be "watched". Expanding your portfolio is dangerous right now, especially when you consider the only positive area of the market is Technology which could lead the market lower if a decline picks up speed. Keep "watch".
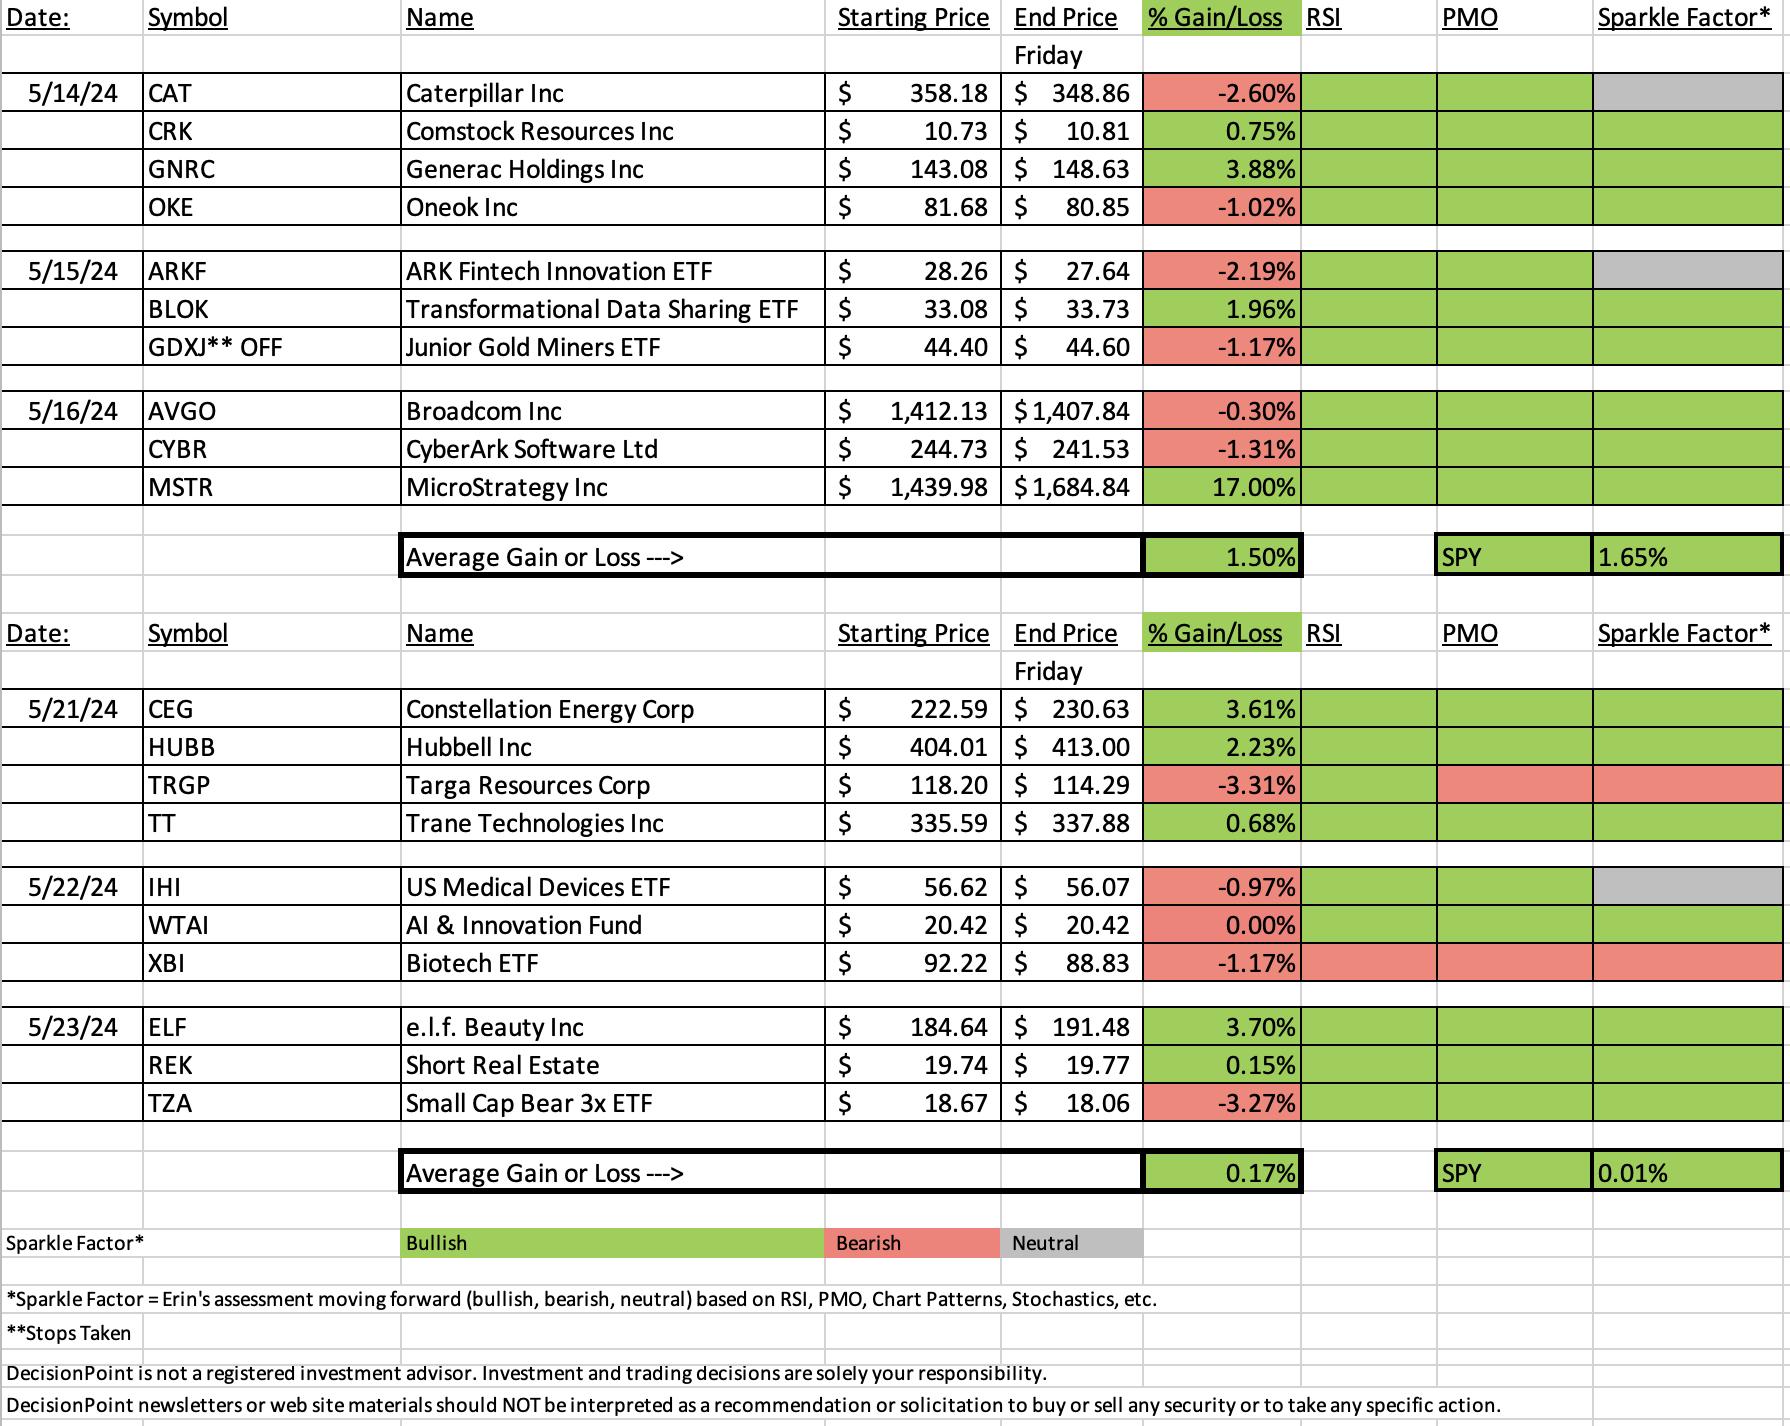
The 'Darling' this week was e.l.f. Beauty (ELF) which had a great day to follow through on earnings. It narrowly beat out Utility, Constellation Energy (CEG).
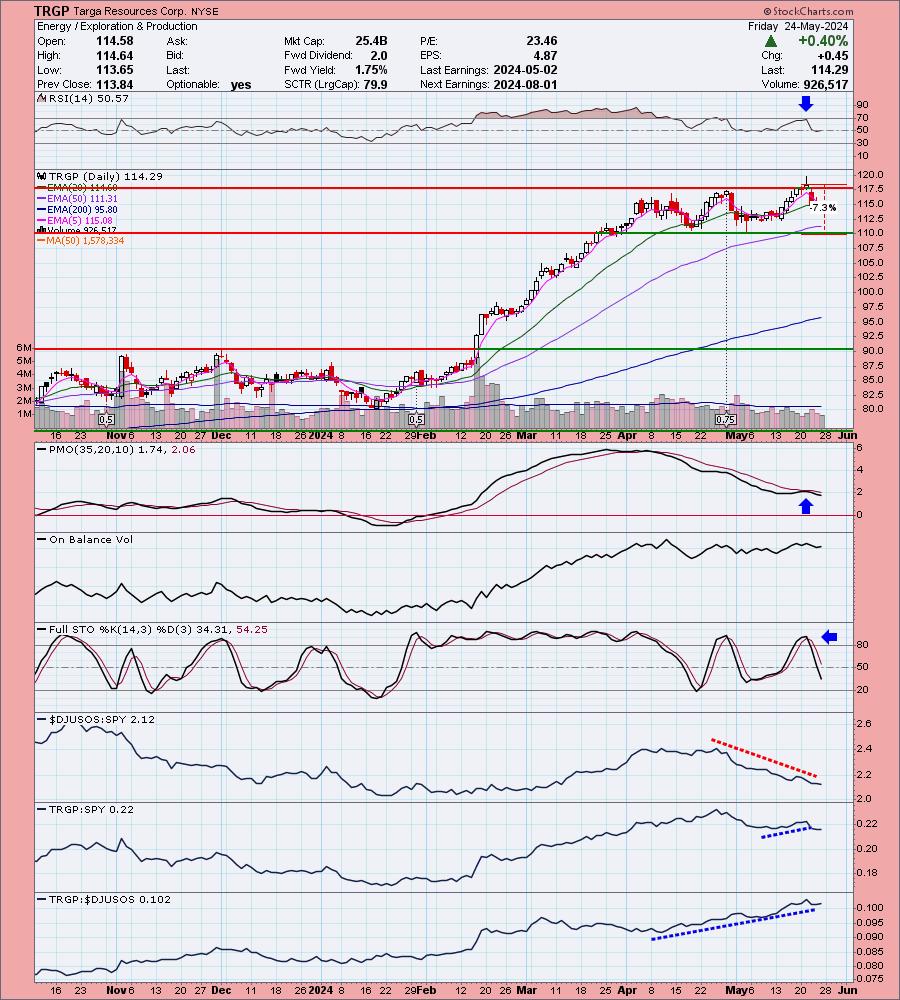
The 'Dud' this week was Targa Resources (TRGP). This is an Energy trade that never got going. If Crude Oil makes an upside reversal as it very well could next week, this one might come out of its decline. Unfortunately the indicators have really gone south and I decided to give it a bearish Sparkle Factor, meaning I don't like its prospects moving forward. All of the 'sell' earmarks were visible on the chart as you'll see.
We had time to run scans at the end of the trading room and I came up with a handful of symbols. Some of these may be a little overbought and as I said earlier, I wouldn't necessarily be adding to your portfolio this week. Here they are: AAON, AWI, MATV, ENV, PCAR, AMR and MASI.
Have a great three day weekend! There will be NO free DP Trading Room on Monday due to the holiday.
Good Luck & Good Trading,
Erin

RECORDING & DOWNLOAD LINK (5/24/2024):
Topic: DecisionPoint Diamond Mine (5/24/2024) LIVE Trading Room
Download & Recording Link HERE
Passcode: May#24th
REGISTRATION for 5/31/2024:
When: May 31, 2024 09:00 AM Pacific Time (US and Canada)
Topic: DecisionPoint Diamond Mine (5/31/2024) LIVE Trading Room
Register in advance for this webinar HERE.
After registering, you will receive a confirmation email containing information about joining the webinar.

Below is the latest free DecisionPoint Trading Room recording from 5/20. You'll find these recordings posted on Mondays to our DP YouTube Channel. Be sure and subscribe HERE.
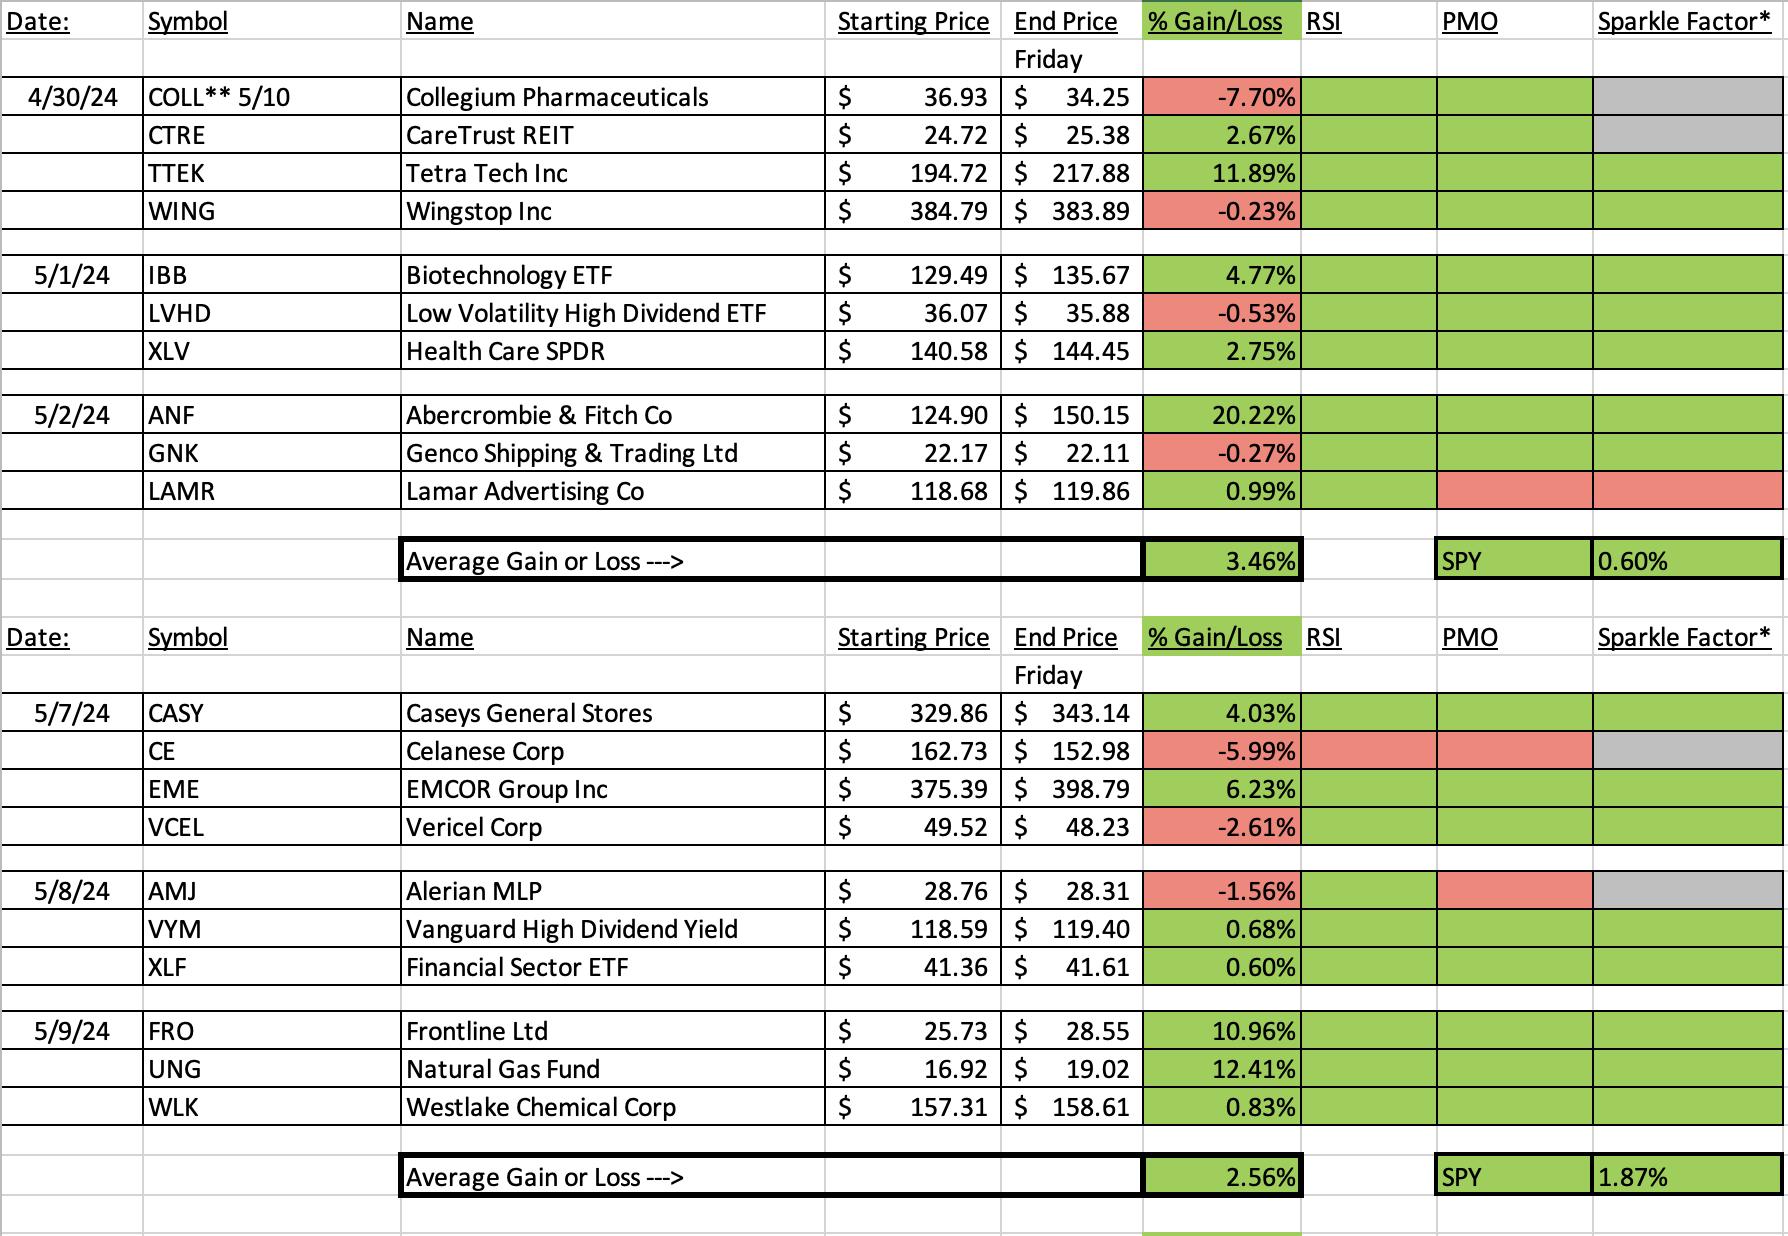
A few items about the spreadsheet: I've put on the spreadsheet whether the RSI is positive (green) or negative (red). The PMO column tells you if it is rising (green) or falling (red). Finally I've added my own "Sparkle Factor" that gives you my assessment going forward, bullish (green), bearish (red) or neutral (gray). The Sparkle Factor is basically my thoughts on whether I expect it to rise or fall. A neutral means it could really go either way so it could be added to a watch list. If you're in a stock I consider "neutral" going forward, the ball is in your court.
Darling:
e.l.f. Beauty, Inc. (ELF)
EARNINGS: 05/22/2024 (AMC) ** Reported Yesterday **
e.l.f. Beauty, Inc. is a holding company, which engages in the provision of cosmetic and skin-care products. The company focuses on the e-commerce, national retailers, and international business channels. Its brands include elf, elf skin, WELL People and KEYS soulcare. The company was founded in 2004 and is headquartered in Oakland, CA.
Predefined Scans Triggered: Elder Bar Turned Green, New CCI Buy Signals, Gap Ups, Bullish MACD Crossovers, Moved Above Upper Bollinger Band, Moved Above Upper Price Channel, Parabolic SAR Buy Signals, Entered Ichimoku Cloud, P&F Double Top Breakout and Strong Volume Gainers.
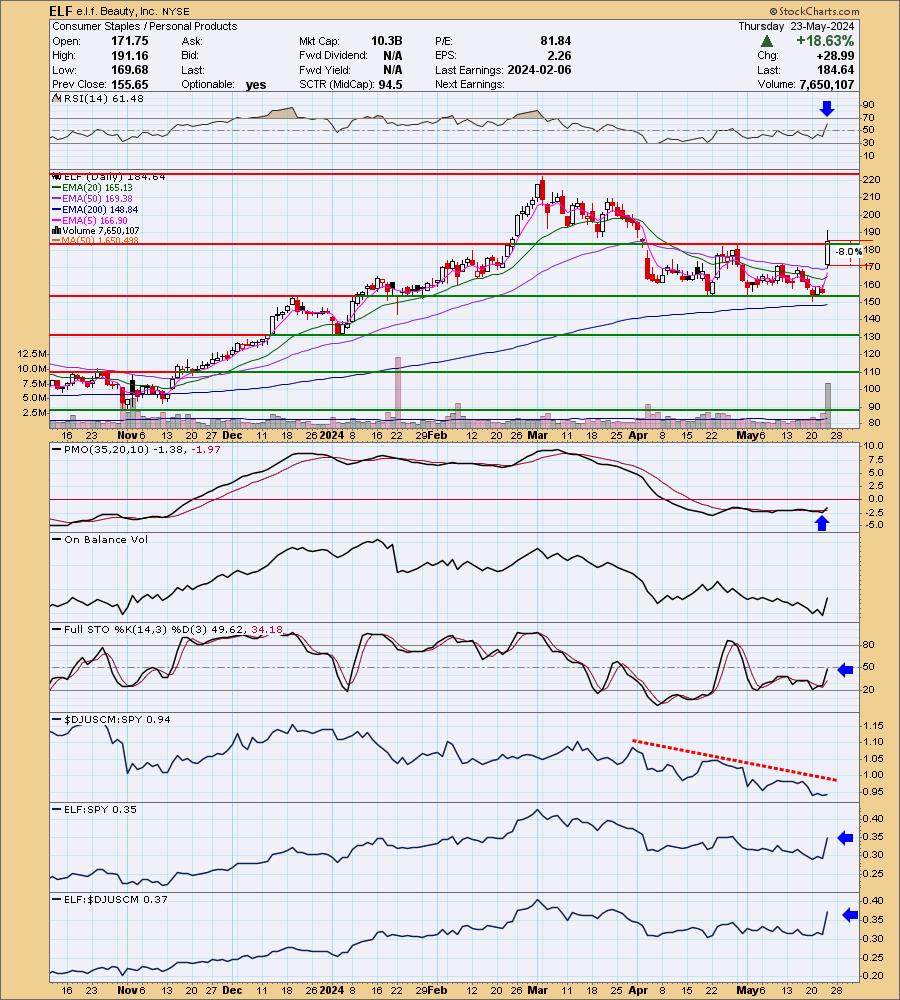
Below are the commentary and chart from Thursday, 5/23:
"ELF is up +0.30% in after hours trading despite an almost 19% gain today. This suggests follow through as do the indicators on this incredible breakout move. The RSI is not overbought which is saying something given the rally. The PMO has been yanked upward into a Crossover BUY Signal. This move came on very strong volume, but based on the OBV, we need more to match the prior top to dispel a possible negative divergence. Stochastics are rising strongly. The industry group is not doing well which is somewhat of a drag on ELF. But, it is outperforming after today's big move. I have set the stop as deep as possible. I don't like stops more than 8% (unless we're talking about a leveraged ETF). So we have an 8% stop set around $169.86."
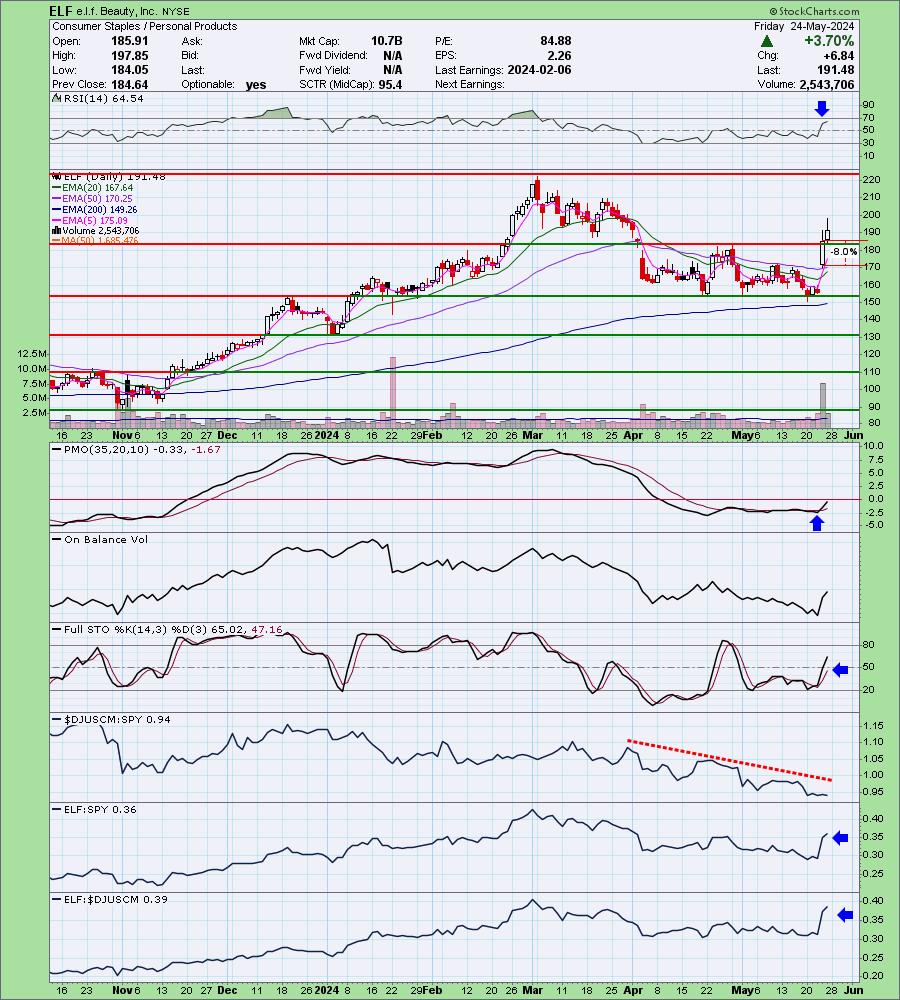
Here is today's chart:
Today saw excellent follow through on yesterday's big rally after earnings. This breakout looks convincing and indicators are only getting better. Best part is that it is still not overbought.
Don't forget, on Thursdays I look at reader-requested symbols, so shoot me an email at erin@decisionpoint.com. I read every email I receive and try to answer them all!
Dud:
Targa Resources Corp. (TRGP)
EARNINGS: 08/01/2024 (BMO)
Targa Resources Corp. provides midstream natural gas and natural gas liquids services. It also provides gathering, storing, and terminaling crude oil, and storing, terminaling, and selling refined petroleum products. It operates through the Gathering and Processing and Logistics and Transportation segments. The Gathering and Processing segment includes assets used in the gathering of natural gas produced from oil and gas wells and processing this raw natural gas into merchantable natural gas by extracting NGLs and removing impurities, and assets used for crude oil gathering and terminaling. The Logistics and Transportation segment focuses on the activities necessary to convert mixed NGLs into NGL products and provides certain value-added services such as the storing, fractionating, terminaling, transporting and marketing of NGLs and NGL products, including services to LPG exporters, and the storing and terminaling of refined petroleum products and crude oil and certain natural gas supply and marketing activities in support of its other businesses. The company was founded in October 2005 and is headquartered in Houston, TX.
Predefined Scans Triggered: New 52-week Highs, Moved Above Upper Price Channel and P&F Double Top Breakout.
Below are the commentary and chart from Tuesday, 5/21:
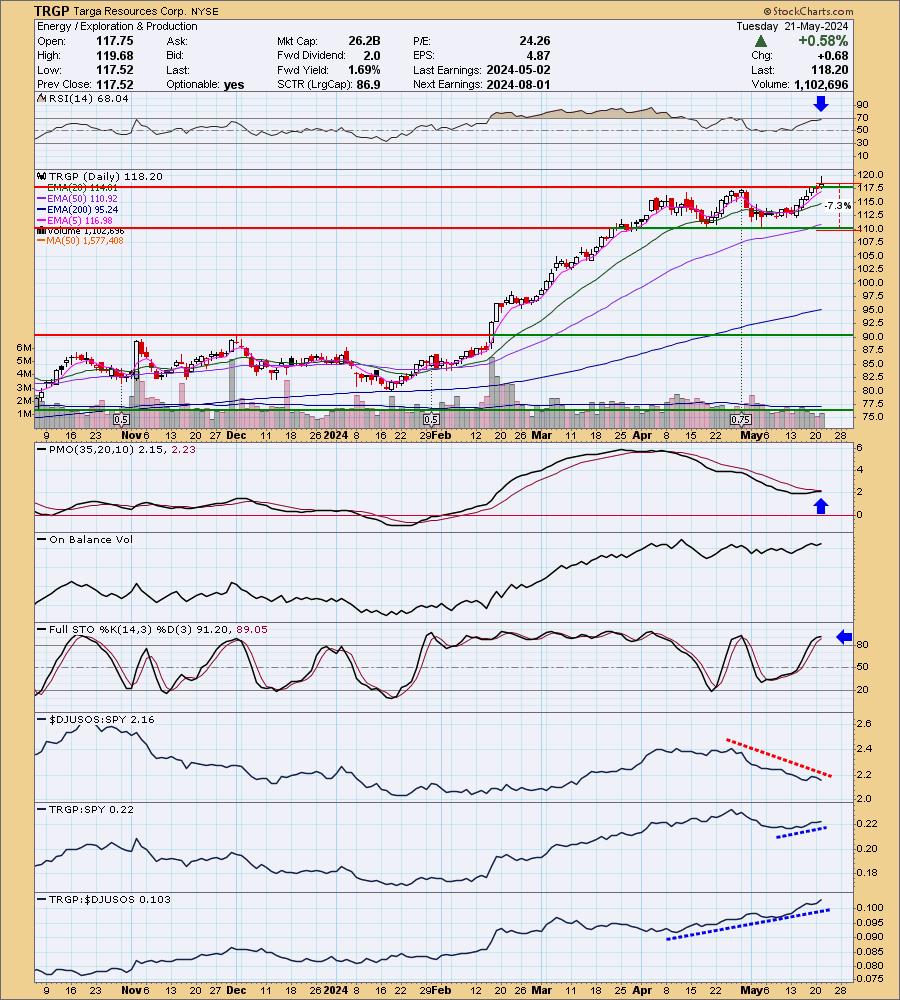
"TRGP is up +0.47% in after hours trading. I like the Energy sector for a reversal and this is already a strong performer within the sector. Today price broke out to new 52-week highs out of a trading range. The RSI is positive and not quite overbought yet. The PMO is about to trigger a Crossover BUY Signal. Stochastics are above 80. The group is underperforming, but TRGP is outperforming both the group and the SPY. I'm looking for more outperformance. The stop is set beneath support at 7.3% or $109.57."
Here is today's chart:
The chart looked really good on the breakout, but unfortunately the Crude Oil trade went south and dragged down TGRP. It isn't over for Crude Oil, but it appears the Energy trade is not going to happen as I expected. That is really what was the big problem for this stock. It is located in an area that is showing new weakness. The technicals were up to snuff when it was picked. Just goes to show you how much influence the sector and industry group has on your stocks.
THIS WEEK's Performance:
DecisionPoint Market Scoreboard (Mechanical Trend Model Signals):
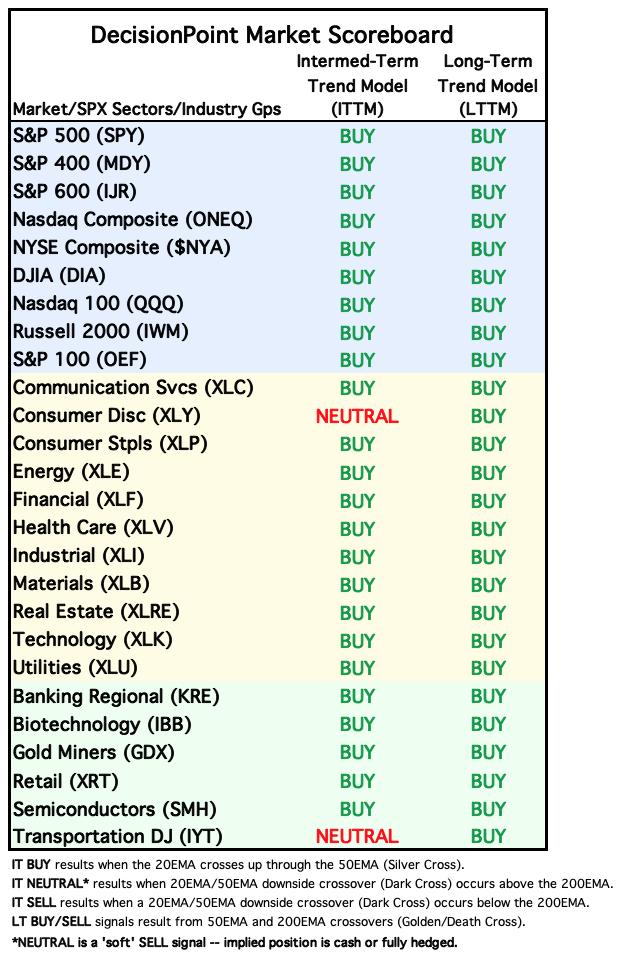
Friday signal changes are outlined in purple.
Click Here to view Carl's annotated "Under the Hood" ChartList!
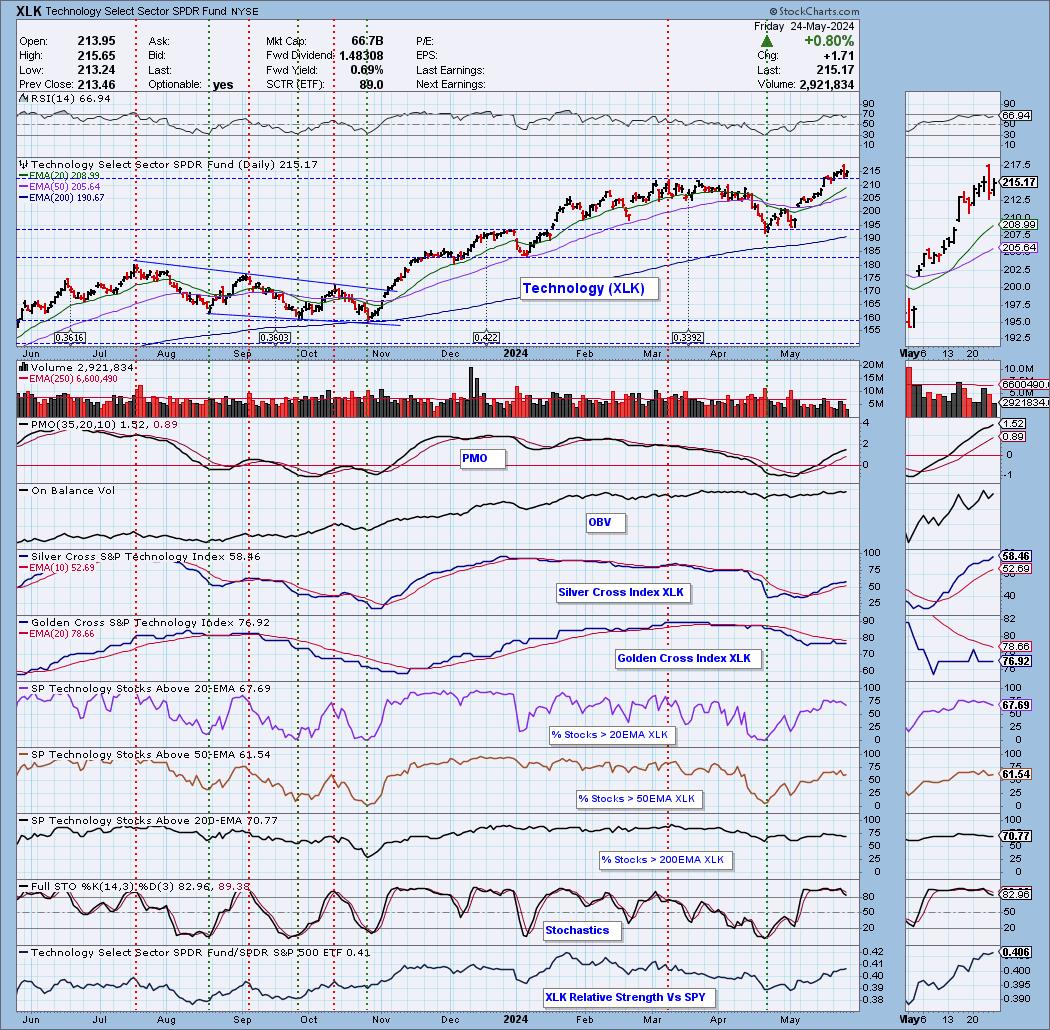
Sector to Watch: Technology (XLK)
Of all the sectors, XLK was the only one with a rising PMO and price that didn't look overly toppy. I list this as a "watch" for a number of reasons. First and foremost, participation is not expanding, even on a rally today. It is at a healthy level (above our bullish 50% threshold), but it is stagnating. The Golden Cross Index is below its signal line and Stochastics have topped. However, there are a number of positives on the chart. The RSI is positive and not overbought. The PMO is rising as is the Silver Cross Index while above its signal line. It is outperforming the SPY by a mile. This is the one are with some positive outlook, but if the market tanks as I suspect it will next week, Technology is going to have a tough time like its brethren.
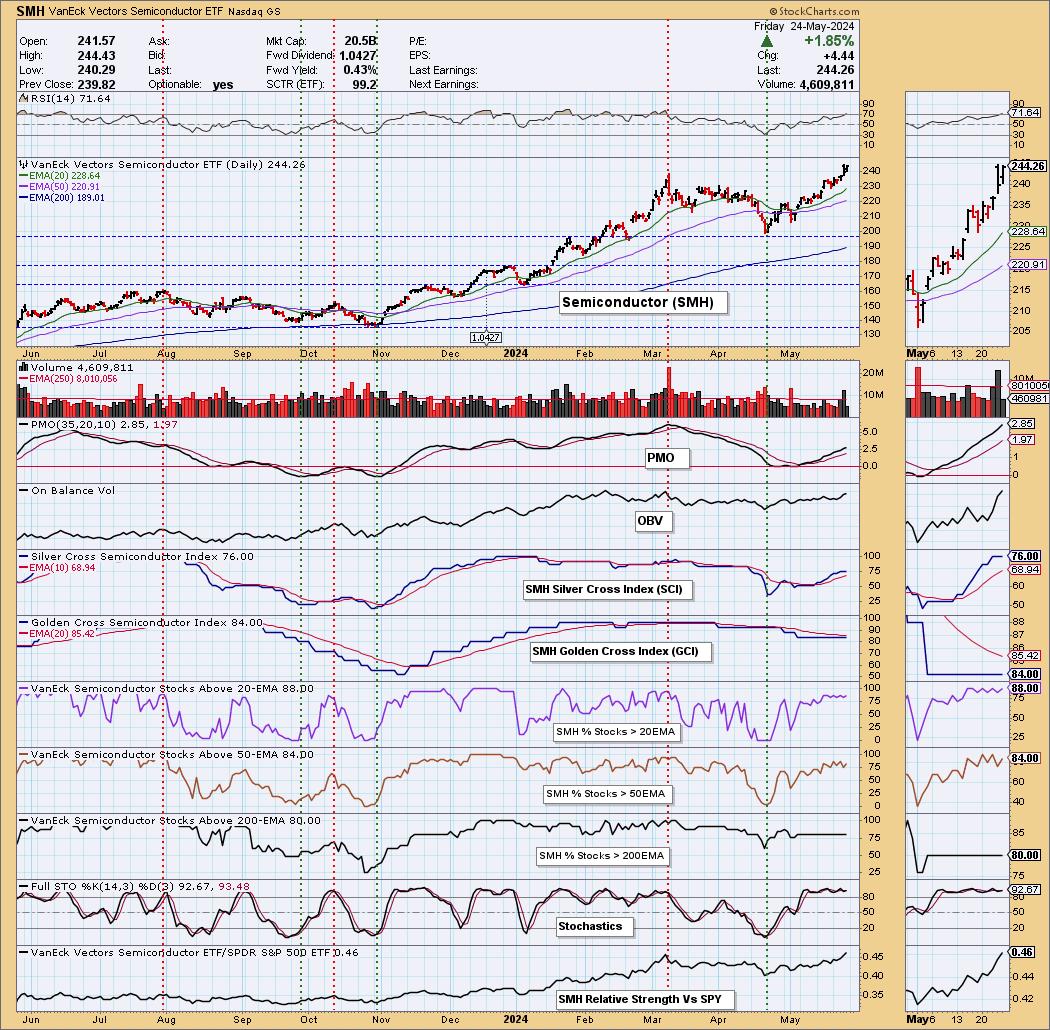
Industry Group to Watch: Semiconductors (SMH)
One of the reasons I chose Semiconductors (SMH) was because I could look under the hood and it looks quite good. Again any market disruption will likely pose a problem for this area of the market so be careful. It isn't a good time to add, but if you have a Semiconductor it isn't likely time to sell either. Watch the chart closely for signs of distress. The PMO is a very good guide. Participation is very strong and we can see incredible outperformance. Stochastics are camped out above 80 and the PMO is rising strongly. Momentum is on its side right now. It is overbought now which is the problem for the symbols I mined from the group. They look good, but again I wouldn't be adding to my portfolio right now. NVDA, QCOM, TER, TSM and KLAC.
Go to our Under the Hood ChartList on DecisionPoint.com to get an in-depth view of all the sectors. On StockCharts.com you can find the Industry Summary.
Good Luck & Good Trading!
- Erin
erin@decisionpoint.com
Full Disclosure: I'm 30% long, 5% short.
Watch the latest episode of the DecisionPoint Trading Room with Carl & Erin Swenlin on Mondays 3:00p EST!
Technical Analysis is a windsock, not a crystal ball. --Carl Swenlin
NOTE: The stocks reported herein are from mechanical trading model scans that are based upon moving average relationships, momentum and volume. DecisionPoint analysis is then applied to get selections from the scans. The selections given should prompt readers to do a chart review using their own analysis process. This letter is not a call for a specific action to buy, sell or short any of the stocks provided. There are NO sure things or guaranteed returns on the selection of "diamonds in the rough."
Helpful DecisionPoint Links:
DecisionPoint Shared ChartList and DecisionPoint Chart Gallery
Price Momentum Oscillator (PMO)
Swenlin Trading Oscillators (STO-B and STO-V)
(c) Copyright 2024 DecisionPoint.com